ABSTRACT
The creation of an information system for various facilities is crucial as it is a vital instrument for effective urban management, especially in the areas of monitoring the state of such facilities to ensure adequate maintenance, ease of access, etc. This paper focuses on how remote sensing and other modern techniques can aid in developing a buildings’ information system (BIS) for the University of Nigeria Enugu Campus. It comprised mapping the university environment, particularly the buildings within its boundary as well as developing a database containing the attributes of these buildings. Satellite images of the campus were downloaded and a map of buildings in the campus was developed through geo-referencing and digitizing. A database for the attribute information related to these buildings was also developed and finally the database was linked to the map. This project was carried out using application packages such as Microsoft Excel, QGIS 2.4.0, PostgreSQL 9.3.1, and a Hand-held global positioning system (GPS) receiver for ground-truthing. It is recommended that the accurate identification of buildings in the campus, especially in the residential quarters be improved by placement of number tags as this was a challenge encountered during the course of this project. Beyond this project, it is also of great essence to develop an information system for all other utilities on campus so as to achieve a harmonized and complete information system inventory for the university as it will greatly aid the management and maintenance of these utilities.
Key words: Buildings’ information system (BIS), spatial data, attributes data, database management system (DBMS), geographic information system (GIS).
An information system is an organized system for collecting, organizing, storing and communicating information (Rainer et al., 2007). Information is a very vital tool to man as it is an important necessity in our everyday life. It brings about knowledge and is an indispensable tool for effective planning. Several facilities co-exist within the university environment, and there is need to have information about these facilities on demand. The knowledge of the spatial and non-spatial (attribute) characteristics of these facilities are of valuable essence in their utilisation, management, development as well as the addition of new facilities.
A variety of technologies exist for the acquisition of geospatial data for an information system; Hardcopy maps (Meyers, 2000), aerial photographers, land surveyors, census takers, as well as an average person using a cell phone that is Global Positioning System (GPS)-enabled, can collect geospatial data, and this can be entered into a Geographic Information System (GIS) environment. The diverse attributes of several kinds of geospatial data can individually be used as a separate theme or layer within the GIS. Such attributes include ownership of land, buildings, rivers and lakes, roads, bridges, congressional districts, or counties. Therefore, utilizing the power of GIS analysis, it is possible to create a new path to interpreting information which otherwise, would be difficult to analyse and understand (Folger, 2009).
Utilities and facilities all over the world are changing in an unprecedented manner and this has added to the work of facility managers (Meyers, 2000). The development and expansion of the constructed facilities of an institution aggravate the difficulties of managing them. Before the advent of the computer technology, most institutions especially in developing nations relied on hardcopy maps and records to manage their facilities. This has proven inadequate because with time, physical maps deteriorate, get lost or are misfiled. Where available, similar records are kept at different departments (thus creating a waste of storage space); accessibility to data becomes insecure or impossible. These shortcomings therefore, call for new tools and strategies, not only to reduce management costs, but also to improve on space management. GIS can be seen as an indispensable instrument that facilitates the integration of information relating to these facilities and also proffers solution to the shortcomings stated earlier.
GIS has been defined as a computer-based system that enables users to collect, store, process, analyse and present spatial and non-spatial information about areas of the earth (Folger, 2009; Cete et al., 2010). The term GIS can also be seen as a system comprising software, hardware, people, data, organizations and institutional arrangements that aid the acquisition, storage, analysis, dissemination and presentation of both spatial and non-spatial information pertaining to portions of the earth (Chrisman, 2002).
In the 21st century, there has been a heightened understanding of the role of GIS by many facility managers especially within the universities. Campus Information Systems (CIS) that are GIS-based, have been utilized by a lot of these facility managers to achieve various aims, thereby making it a tool effective for planning, ease of administration and management.
The Building Information System (BIS, an offset of the GIS) is one information system that is designed to capture, store, manipulate, analyse, manage and present spatial as well as non-spatial information about buildings. It provides the means for inquiry, analysis and information updating after information about the facility must have been transferred to the computer environment (Konsol, 2001). The need for Building Information System is rapidly increasing as it improves the ease of maintenance and reduces the risk of error (Topay et al., 2004).
The University of Nigeria, Enugu Campus, though has automated some of its procedures, is still dependent on the old analogue system for recording, retrieving, updating, and documenting information of all facilities (surface and sub-surface) within her boundary, thus, developing a Campus Information System for University of Nigeria, Enugu Campus will therefore provide a substantial contribution to its future planning and management. Owing to the fact that the institution is situated in a very large space with a lot of facilities, and coupled with the limitations of resources and time constraint, this study focuses on using GIS as a tool to create a Building Information System for the campus. The result of which will aid the proper and effective management of these buildings, which will be of immense benefits to university administrators, other staff members, students, etc., thereby improving in the quality of teaching and learning.
Although there are platforms such as Google Earth and other internet based applications with which individuals from any part of the country can locate the university, the information derivable from these platforms are very limited as attributes of individual buildings cannot be extracted. This paper therefore shows that creating a Building Information System facilitates the availability of detailed information about every building in the university and thus allows for:
(1) Proper planning for future constructions within the campus.
(2) Easily navigating within the university while avoiding the inconvenience of questioning strangers.
(3) Knowledge about the current state of the buildings so as to ascertain those that need to be maintained and the urgency of maintenance.
A successful information system is essential for a successful business (Savoie, 2012). Scholarly articles exist on the creation or implementation of information system through the use of GIS for utilities such as buildings, roads, power-lines and a whole lot more. A lot of these works were carried out for different purposes such as in campuses for effective planning and management, for the government to aid the proper allocation of amenities and so on. These works have been carried out using diverse application programs (ArcGIS, Erdas Imagine, etc.), database management systems, data acquisition methods as well as several means of presentation.
Motuka (2008) in his work developed an integrated GIS database system of the U-block of the Kenya Polytechnic University College which sought to enable the institution’s management to have better methods of resource utilization (e.g. space) at the institution. Due to the fact that the college relied on the old system of organizing, retrieving and updating hardcopy facility drawings, where available, there was no coordinated system for storing, accessing and updating the available documents related to the physical infrastructure of the institution. Thus, the aim of his study was to develop, using an existing GIS tool kit, a means for developing a regular geo-database that organises digital data in order that illustration and visualization, information management, project organization and decision making are facilitated, thereby producing a geodatabase for facilities management for the U-Block of the Kenya Polytechnic University College, Nairobi. The two methods he used were digitization of the existing architectural drawings followed by the linking of the resulting spatial data with the non-graphic data using Microsoft Excel, ArcGIS, ArcView, and Microsoft Access software, being that they provide major procedures for the input and conversion of data. The functions of the project includes graphic processing abilities which give the users the means for map digitization and editing, geo-database management; including the capacity to introduce and manage data (non-graphic) joined with map features, and conversion, in order to transfer and work with files of diverse formats (e.g. from Ms Access to ArcView).
Aysel et al. (2015) carried out a project to develop an information system for the future and current planning of Mustafa Kemal University Tayfur Ata Sökmen Campus by integrating spatial information within a GIS environment. The objectives of the project were to develop geographic information system of the campus (both attribute and spatial data), establish inquiry system of the campus and model a 3D system of the campus. This was achieved by collecting the spatial and non-spatial data of the campus, which consists of topographic structure (slope, aspect, elevation), infrastructure (clean water lines, electrical lines, wastewater line), roads (main and secondary), buildings (administrative buildings, educational facilities, health units, community facilities, etc.) and thereafter, digitizing all data, creating attribute tables and creating a 3D model of the campus. For this project, they made use of an image data of the campus with 50 cm resolution comprising three bands and 16 bits, and the other data used for analyses and reference included topographic maps with scale of 1:25,000, detailed infrastructure maps obtained from Mustafa Kemal University Construction Works and Technical Department, ground reference data obtained from land survey by GPS, and non-spatial data about academic and administrative staff members and students. ERDAS 9.1 Imagine, ArcGIS 9.3, AutoCAD and Sketch up computer applications were used for image classification and data analyses.
Fajemirokun et al. (2006) employed the technique of GIS in mapping and managing crime in Nigeria, using Victoria Island (in Lagos State) as a population sample. The objective of his study was production of a map to show Victoria Island, containing its streets and plots as well as create a database for attributes such as addresses of buildings, types of buildings, purposes of buildings, address, and street names for the purpose of assisting the police in mapping out crime scenes and its surrounding in order to make it easier and quicker to respond to distress calls. He also incorporated the analysis of road network in order to aid the police arrive faster to the scene of the crime through the shortest route possible for the purpose of facilitating quick intervention to such distress calls. Findings revealed that GIS can be used to map and analyse crime occurrences with a view to determining the factors leading to such crimes and how they can be effectively managed.
In an article written in the Global Information Management (GIM) International, a BIS was created in Lombardy (Italy), based on archived and surveyed data for the risk-assessment of buildings that possess historic and architectural value. The BIS was created for the Maria Maggiore building in Bergamo, built in 1137. Essentially, a multisensory approach was utilized to carry out observations of the monument both inside and outside, Terrestrial Laser Scanning being the primary technology utilized. The procedures involved in developing the BIS includes collecting, classifying and transferring all the graphical and descriptive information that were found in Bergamo’s historical archives, to digital format; the most recent documents dating to the early 1900’s were first digitized, while the older ones were processed. The data collection survey was carried out with reflectorless and motorised total-stations instead of indirectly extracting them through the processing of the laser-scanned data owing to reasons of accuracy and reliability. A survey was also conducted using advanced techniques of geo-data acquisition to produce a model of the multi-level structure of the building, this was used to check the uncertainty in the position of points and remove points that are erroneous; a lot of horizontal distances were measured by means of hand-held lasers. The outer shape of the building (stored as a polyline in CAD) was used to show where the walls intersect with the ground level. The BIS was ArcView-based and the Lombardy authorities adopted the GIS as standard.
Tarhanet al. (2006) conducted a study targeted at achieving uniformity between non-spatial and spatial data through creating a campus information system that is based on GIS for the Izmir Institute of Technology (IIT). Due to the fact that IIT is a developing campus environment with new dormitories, sports area, faculty buildings, and its topography, geology and soil capability requires careful attention, a GIS-based Campus Information System will be of help for the new decisions. The objectives of the study were to store the non-spatial and spatial information on the campus to enable update, plan, or use for the purposes of administration, carry out hazard analysis to help understand the limitations of the campus site geography, and create an interactive access to information in the campus giving rise to easy access to sharable and personal information about the campus with the aid of an effective BIS. The non-spatial (attribute) and spatial (images) data about the campus were first collected, after which the database, maps, queries, and spatial analyses about the collected data were produced via ArcGIS which have been useful for administrative purposes.
Arif and Tashin (2002) also engaged GIS capabilities and developing web technologies in building a web-based campus information system for Karadeniz Technical University (KTU). The Karadeniz Technical University Information System (KTUBIS) provides information exchange for the university owing to the building of a database and presenting its data on the internet. Graphic as well as non-graphic data were collected. The graphic data comprising road, infrastructure, building, parking lot, geodetic point, illumination plant (point), and terrain configuration were collected from maps at a scale of 1:1000 and constitutes the major geographical features of KTU’s main campus. The buildings were grouped according to usage into dormitory or living quarters, educational, managerial, house, library, culture, sport, food, etc. The graphic data were edited and digitized using AutoCAD, while ArcIMS 3.2 application program from ESRI was utilised in serving the KTUBIS data and services. Some of the benefits of the KTUBIS includes the fact that maps of the campus required in any format, is easily created and can be collected in an updated environments, easy access to files that are organized by the system, the database created pertaining the university department can be accessed and utilized by the managerial services of the university and users such as campus planners, students, personnel, managerial officers, as well as others not within the university, can access the system via the internet.
It is also useful to state that whereas most of the applications of BIS executed in literatures were done using commercial software, we demonstrate that open source application programs (QGIS and PostgresSQL) can also be deployed efficiently for the creation of the BIS.
This paper is majorly aimed at demonstrating that a building information system for the University of Nigeria Enugu Campus was produced with open source application programs, which creates enabling platform for visualization and interaction; and upon conclusion, provided information about the physical structure, both spatial and non-spatial information as well as opportunity to make an inquiry about the buildings. Thus, the procedures described can also be used as a template to carry out further works on Building Information System for other areas as it is not yet a well-researched subject in Nigeria.
Study area
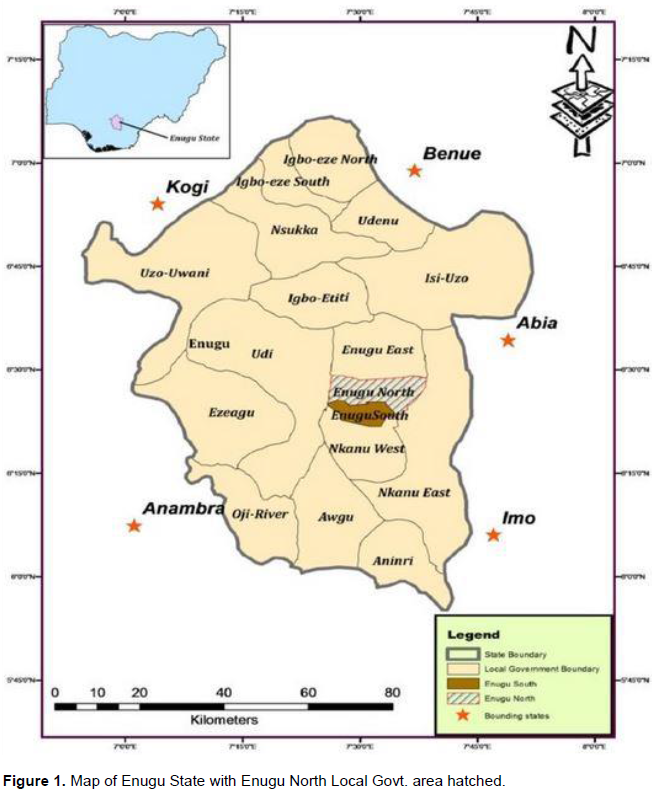
Enugu State is situated in Nigeria’s South-East geo-political zone. It lies 6°30' North of Equator, and 7°30' East of Latitude. On the world time zone, it is plus one hour (+1 h) of the GMT. To the south, it is bounded by Imo and Abia states, to the East, Ebonyi State, to the North-East, Benue State, to the North-West, Kogi State and to the West, Anambra State, covering about 7,161 km2 (2,765 m2) in area (Figure 1).
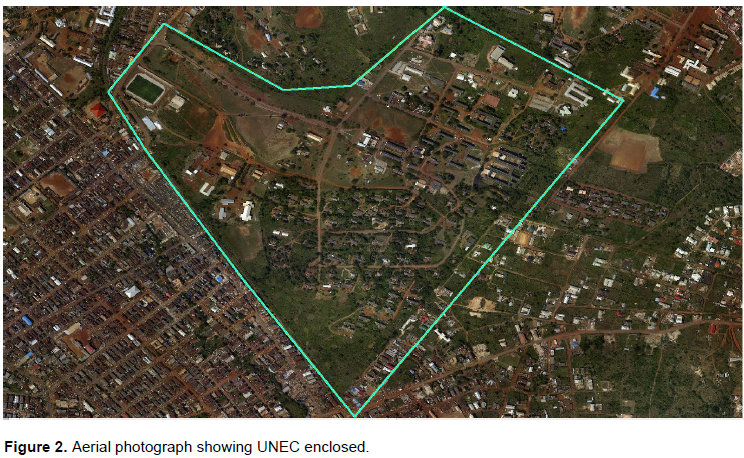
The specific area selected for this study is University of Nigeria Enugu Campus, in Enugu North Local Government Area of Enugu State. It is bounded by latitude 6°24’58’’ to 6°25’51’’ and longitude 7°29’50’’ to 7°30’43’’ with an area of approximately 200 ha (Figure 2).
Materials used
The materials utilized are HP laptop computer with the following specifications: Intel(R) Core(TM) i3-4005U CPU at 1.70GHz, RAM: 4.00GB and System type: 64-bit Operating System and a 32GB Flash drive while the computer application programs are QGIS 2.4.0, PostgresSQL 9.3.1 and Microsoft Excel.
Method
The methods are the reconnaissance survey, data acquisition, data processing, and finally, the integration of the processed data.
Since the project area is a familiar one, the reconnaissance survey was skipped and the major preliminary investigation was to evaluate various application programs so as to ascertain which best suits the project execution. It was resolved that the QuantumGIS (QGIS) software will be used alongside PostgreSQL as the database management system with PostGIS as its spatial database extender. The decision to execute the project using the QGIS software was influenced by the fact that it is open source and the PostgreSQL (which is also open source) was also chosen because it is very compatible with the QGIS software, and it is an object-oriented database management system, thus, having an edge over other regular relational database management systems.
Two major data types were utilized; spatial and non-spatial. The spatial data source was a geo-referenced image of the campus captured by aerial photography which showed locations of all buildings in the campus. Due to the fact that this image is old and does not display current developments within the study area, a more recent Google Earth image of the campus was also downloaded and utilized during the execution of the project. The non-spatial (attribute) data of the buildings was gotten from the Department of Works, University of Nigeria, Enugu Campus as well as other relevant sources. The process of acquiring data also included ground-truthing which was carried out to confirm the situation of some of the buildings and also to identify on the ground, the particular structure located in an area where it is not properly detectable in the image.
Data processing includes all the stages involved in the transformation from data to information. Such information guides decision taking since analysis can be made and inferences deduced. For the purpose of the project, the stages of data processing include:
(1) Image Geo-referencing
(2) Image Digitization
(3) Attribute Data Organization
(4) Database Creation
Image geo-referencing
This entails referencing the coordinates of features so that their coordinates on a map conforms to the actual coordinates on the ground. It is of two types; image-to-map rectification and image-to-image registration. The image-to-image registration was the geo-referencing type used in this project in order to align the Google Earth imagery with the geo-referenced aerial photograph of the study area. In this work, four points were used to geo-reference the image whose parameters are tabulated in Table 1.
Image digitization
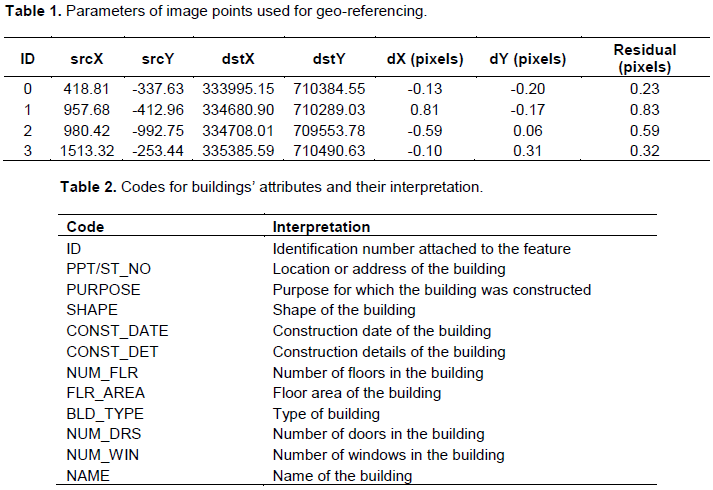
This is also known as vectorization, simply the process of converting the raster form of an image into vector using points, lines and polygons. The image digitization process simply encapsulates how the QGIS software was used to transform the already geo-referenced image into its vector format from which map can be produced and also serve as the base of the database created. The map of the study area was produced immediately after digitizing the required datasets from the basemap which are boundary, buildings, and roads. This of course was accomplished using the ‘composer manager’ of the QGIS software.
Attribute data organization
This involved organizing the contents of the attribute data in the Microsoft Excel environment. All the collated attributes for the buildings were neatly organized in Microsoft Excel with their contents properly tagged with special codes. The codes and interpretation are shown in Table 2.
After populating these fields in Microsoft Excel, and saving it, all its contents was joined to the attribute table of the building shape file layer created in QGIS.
Database creation
A database is simply a store-house of logically related data, and a computer program that holds such amount of large data and also ensures easy access, proper management, updating, manipulation and so on, is a database management system (DBMS). The process of creating a database was achieved for this project using the PostgreSQL database management system. Besides creating a database, it is also paramount that there is a link between the attribute dataset in the PostgreSQL database management system and the spatial dataset in PostGIS (the spatial database extender of PostgreSQL). After the creation of the database, hyperlinking was done to connect each of the building footprints to their corresponding images.
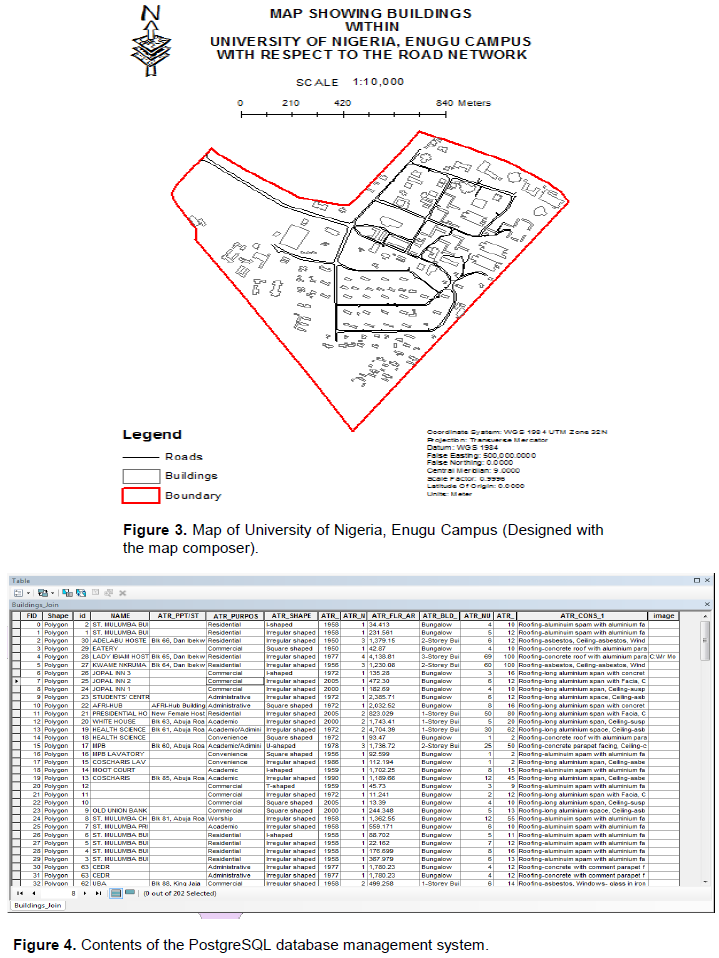
The results obtained include a map of the study area (Figure 3), a database containing attributes of all the buildings in the campus created using the PostgreSQL DBMS (Figure 4) and seamless configuration of the QGIS as a visualization and interaction tool for the database.
Details as well as attributes of any building of interest contained within the target area of the database can be extracted through the QGIS application where the map is housed. In other words, clicking on a building in the map on the QGIS interface gives one access to the information about the building contained in the database thereby making it easier for end users who may not be familiar with the database application to be able to get the information they require by just clicking on the building of interest identified on the map.
Figure 4 is a snapshot of the information collated pertaining to the buildings using the database manager of the QGIS software.
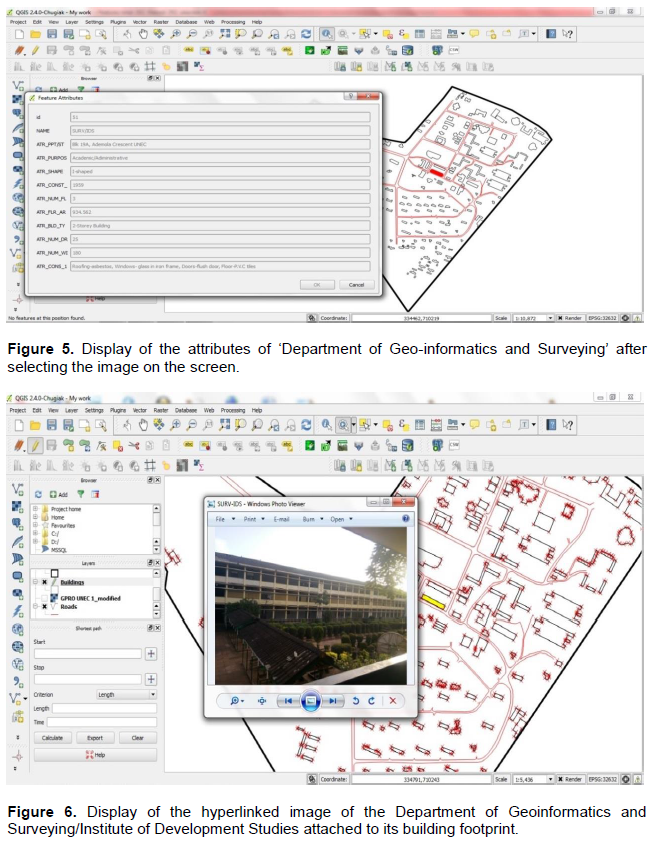
The QGIS application was configured to serve as a visualisation tool for the database. After which it became possible to access the contents of the database from the QGIS interface. Figures 5 and 6 show the visualization and interaction capacity of the QGIS software, because with a click on any of the buildings in the map, its attributes immediately appeared on-screen, making it easy to access holistically the attributes of any desired building.
The development of a BIS was well achieved as all buildings within the university campus are now captured with their attributes. The information contained in the database will be very useful especially to decision makers on the distribution of resources, proper citing of new structures as well as for security purposes especially at the residential because details of all blocks can be easily extracted. QGIS on the other hand presents a lot of potentials for the GIS community. Before now, the high cost of acquiring operational license for commercial GIS applications has made it difficult; especially in developing countries like Nigeria, for GIS users to deploy their abilities in solving GIS related problems around their locality. In comparison with other GIS software such as ArcGIS, the QGIS was considered a better option, especially because of the fact that it is open-source and can be easily accessed unlike the ArcGIS which is not freely available. Other advantages of QGIS include its boatloads of plug-ins that can be used to solve every day GIS problems. The software has over 300 plug-ins which gives it an edge over other GIS applications.
QGIS is also equipped with a special tool known as the ‘composer manager’, a special interface majorly designed for all cartographic activities. This tool was utilized in map drafting.
The database was obtained using the ‘DB manager’ in the QGIS environment alongside the PostgreSQL database management system, this therefore presents new sets of tools for proper documentation and inventory. The symbiotic relationship that exists between the QGIS and PostgreSQL is the reason why the QGIS interface was successfully configured as the visualization platform of the information relating to the buildings which is resident in the PostgreSQL database management system.
Moreover, the PostgreSQL database management system, alongside the QGIS software, also avails any user the ability to query the database using SQL (structured query languages) and demand from it, any record concerning the subject under study, that is, buildings in the study area.
The university campus is similar to an urban area because of its spatial size, structures, activities, etc. Thus, it is important to develop a CIS in order to properly manage and monitor these infrastructures and their development.
To achieve the aim of developing a BIS for all buildings within the campus, a geo-referenced aerial image of the study area was acquired. Also, a recent Google Earth imagery of the same location was downloaded as well. The image-to-image registration performed on both images gave rise to the accurate geo-referencing of the latter image with reference to the former.
The digitization process of the image led to the realization of a map of buildings in the university with respect to the road networks situated therein. This map is a culmination of all the datasets extracted from the base map (which is the image used). The realization of this map saw the development of a database comprising non-spatial data associated with the buildings in the university, using PostgreSQL, as well as the possibility of visualizing and interacting with this database management system, through the QGIS interface.
The results achieved provide spatial and non-spatial information about the buildings, as well as opportunity to make an inquiry about them, and therefore serves as a framework for future works. It can also be used as a template to carry out further works on BIS for other campuses as it is not yet a well-researched subject in Nigeria.
The authors have not declared any conflict of interests.
The authors acknowledge the enabling research atmosphere provided by the GIS lab of the Department of Geoinformatics and Surveying, Faculty of Environmental Studies, University of Nigeria, Enugu Campus and the support given by the Head of the Department in terms of lab equipment and GIS personnel.
REFERENCES
|
Arif CA, Tahsin Y (2002). Web based campus information system: Department of Geodesy and Photogrammetry Engineering Karadeniz Technical University,Trabzon, Turkey. International Symposium on GIS, September 23-26, Istanbul-Turkey.
|
|
|
|
Aysel G, Aylin S, M.Kutay Y, Müúerref Y (2015). Developing Geographical Information Systems of Mustafa Kemal University Tayfur Ata Sökmen Campus. Academic Journal of Science 04(02):53-60.
|
|
|
|
|
Cete M, Palancioglu M, Geymen A, Alkan M (2010). The Turkish Cadastral Information System and Lessons Learned. Scientific Research and Essays 5(7):625-633.
|
|
|
|
|
Chrisman NR (2002). Exploring Geographic Information Systems. New York: Taylor & Francis, pp. 13-14.
|
|
|
|
|
Fajemirokun F, Adewale O, Idowu T, Oyewusi A, Maiyegun, B (2006). A GIS Approach to Crime Mapping and Management in Nigeria: A Case Study of Victoria Island Lagos. Conference proceeding on the XXIII FIG Congress with the Theme: Shaping the Change, October 8-13, Munich, Germany.
|
|
|
|
|
Folger P (2009). Geospatial Information and Geographic Information Systems (GIS): Current Issues and Future Challenges. Congressional Research Service Report for Congress 2009.
|
|
|
|
|
Konsol D (2001). Creating a new database for the physical structure of the campus area of Çukurova University using GIS: Graduate Thesis, Çukurova University, Balcali, Adana.
|
|
|
|
|
Meyers JR (2000). GIS in the Utilities.
View
|
|
|
|
|
Motuka MA (2008). GIS In Facilities Management: A Case Study of the U-block at the Kenya Polytechnic University College. Unpublished Project Report, Department of Geospatial and Space Technology, University of Nairobi.
|
|
|
|
|
Rainer RK, Turban E, Potter RE (2007). Introduction to Information Systems, New Jersey, John Wiley & Sons.
|
|
|
|
|
Savoie MJ (2012). Building Successful Information Systems: Five Best Practices to Ensure Organizational Effectiveness and Profitability, New York. Business Expert Press.
Crossref
|
|
|
|
|
Tarhan Ç, Saygin Ö, Çinar A K, Yeti? Y, Ba?aran G (2006). A GIS-based Campus Information System: Izmir Institute of Technology. Retrieved 2018, May 25, from
View
|
|
|
|
|
Topay M, Kaya LG, Yildrim B, Ikiz E, Demritas SO (2004). ZKU Bartin Campus Information System. ZKU Bartin Faculty of Forestry Journal 1-11:71-77.
|
|