Full Length Research Paper

ABSTRACT
Agriculture, which accounts for 70% of water abstractions worldwide, plays a major role in water pollution. Resulting pollution poses risks to aquatic ecosystems and humans. With the aim of evaluating the saprobic state of four hydro systems subject to pollution from intensive rubber cultivation, the present study was carried out within and around the Hevecam rubber plantation in Niete, South Region of Cameroon. The study was done from September 2019 to December 2020 with monthly sampling, physico-chemical water analysis and determination of ciliate diversity and distribution. Water in the study stations was acidic (6.40±0.31CU), with average temperature (25.20±0.56°C) and conductivity of up to 761.8 µs/cm. Conductivity values coupled with phosphates (up to 29.7 mg/L), herbicide residues are indicators of agricultural pollution on water quality. Station N2 showed the greatest ciliate abundance and species richness. The long dry season of 2020 showed the highest diversity and abundance. The saprobic index indicated moderate to high levels of organic pollution (2.16 to 3.67). Water quality was degraded with the impact of the agricultural pollution due to the presence of herbicide and fertilizer residues at stations N2 and N4. High levels of phosphates and nitrates have resulted in an increased organic load reflected in the saprobic indices; indicating average to high organic pollution.
Key words: Saprobic, Hevecam, organic pollution, anthropogenic, water quality.
INTRODUCTION
Agriculture in modern times faces great challenges in terms of ecology, sustainability, and quantity of production, compared to a human population expected to continuously grow till the end of the present century (WPP, 2017). The solution has been seen to come from the intensification of agriculture. Intensive agriculture firstly aims at increasing production levels to the maximum, through the employment of chemical fertilizers and technology, and usually an extension of limited territory, as part of the optimization of the possible space (Lichtfouse et al., 2009). However, intensive agriculture has led to an increase in man’s impact on water resources both quantitatively and qualitatively. Quantitatively, more water is being required for agricultural activities while qualitatively there is a degradation of water bodies due to the introduction of pollutants which arise from agricultural activities (Casey, 2017). Agriculture is responsible for 70% of water used for human activities. It is therefore a very important contributor to water pollution. Large volumes of agricultural pollutants enter water bodies where they pose serious problems to aquatic ecosystems, human health and water use for diverse human activities (Mateo-Sagasta et al., 2017). Such degraded waters are therefore of lower quality, unfit to satisfy man’s diverse needs (Singh and Asha, 2016).
A continuous evaluation and monitoring of water quality is therefore necessary, in areas subject to intensive agricultural activities as this enables the rapid detection of perturbation and the implementation of sustainable solutions (Pratiksha and Vikram, 2022). Evaluation and monitoring are efficient when they involve the physical, chemical and biological characteristics of the water (Pooja, 2017).
Biological evaluation involves the use of living organisms present in the water to determine the water quality. It is based on the presence or absence of indicator organisms (bio indicators) but also their community structure (Trishala et al., 2016). It is in this light that ciliated protozoans are frequently used in the evaluation of organic pollution in water bodies (Antonija et al., 2021). They are very efficient in such studies given that they are usually present in numbers large enough to enable convincing statistical analysis, they are ubiquitous, they have very short generation times and are much more sensitive than metazoans to changes in their environment (Sparagano and Groliere, 1991).
The aim of the present work was therefore to evaluate using ciliated protozoans, the saprobic state of four contrasting hydro systems in an equatorial region subject to perturbations from intensive agriculture.
MATERIALS AND METHODS
Study site
The study was carried out in Niete, South region of Cameroon and its environs (Figure 1). Niete is an agro industrial locality covering a surface area of 2117 km2 and with a population density of 19.31 inhabitats/km2. It has as geographical coordinates 2° 40' 00'' N and 10° 03' 00'' E and is found between 20 and 200 m altitude with a relatively flat relief (3e RGPH, 2005). The main economic activity is the cultivation of natural rubber. In Niete, the rubber plant (Hevea brazilliensis) is cultivated intensively over 40000 ha of land. The waste products from this cultivation are a potential source of pollution of air, land and water (Abhik et al., 2014). Niete has an equatorial climate with 4 seasons? a long dry season from November to mid-march, a short rainy season from mid-march to mid-June, a short dry season from mid-June to mid-August and a long rainy season from mid-August to ending October. Average temperature is 25°C, a relative air humidity of 75% and rainfall varying from 1800 to 2000 mm per year. In Niete, two main types of soils were found? Ferralitic soils which are poor in nutrients and inadequate for intensive agriculture except with the use of intrans and hydromorphic soils found mainly around wetlands and aquatic environments (CVUC, 2014).

Sampling period
Sampling was done from September 2019 to December 2020 (sixteen months) following a monthly sampling frequency. However, results obtained were summarized and presented in seasons: long rainy season 2019 (LRS 2019), long dry season 2019 (LRS 2019), short rainy season 2020 (SRS 2020), short dry season 2020 (SDS 2020), long rainy season 2020 (LRS 2020) and long dry season 2020 (LRS, 2020). This was done in order to determine any possible influence of seasonality on the physical and chemical properties of water and on the distribution of ciliated protozoa at the stations studied.
Sampling stations
Sampling was done on four stations showing contrasting ecological conditions, 3 within the Hevecam rubber plantation (N2, N3 and N4) and 1 out of it (N1).
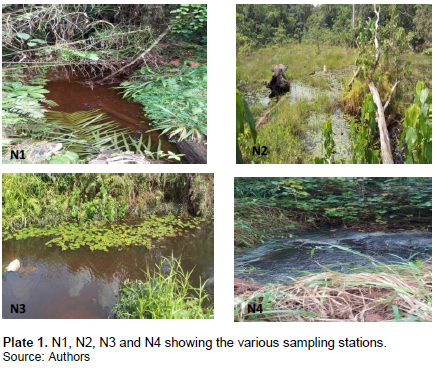
N1 is a slow flowing stream situated outside the Hevecam rubber plantation, within the equatorial rainforest. The waters were poorly illuminated due to a dense vegetation cover. There was a total absence of any form of human activities around this station. This station served as the reference (control) station during the study.
N2 is a large pond situated at the periphery of Village 11 within the Hevecam rubber plantation. Evident signs of eutrophication could be observed at this station as seen by the marked presence of macrophytes in and around the pond, as well as abundant floating water plants. There was also an important presence of decaying organic matter resulting from dead leaves branches and stems. The pond was highly illuminated due to the absence of vegetation cover and was surrounded by rubber farms which used herbicides and fertilizers in large quantities.
N3 was a fast-flowing stream located very close to Village 3 within the Hevecam rubber plantation. It was characterized by the presence of macrophytes at its banks and few floating aquatic plants. Water illumination was high due to the absence of vegetation cover. The station was surrounded by rubber trees whose cultivation depended on the use herbicides and fertilizers.
N4 was an industrial effluent from the rubber processing factory. It was situated in Village 7 within the Hevecam rubber plantation very close to the rubber processing factory. Water from the effluent was dark in color with a pungent smell indicative of anoxic and reductive conditions. There was the presence of macrophytes around the banks of the station but no plant matter was observed on or in the water. The effluent flowed freely and emptied into a nearby river. Plate 1 (N1, N2, N3 and N4) shows the various sampling station.
Physico-chemical analysis
Determination of physico-chemical parameters
Physico-chemical analysis was carried out both on the field and in the laboratory of Hydrobiology and Environment of the University of Yaounde 1.
On the field, some physical and chemical water parameters were measured directly these included: temperature in degree Celcius (°C) using a 1/10ºC graduated alcohol thermometer graduated, pH using a pH meter of mark HACH HQ11D, electrical conductivity in micro siemens per centimeter (µS/cm) and total dissolved solids in milligrams per liter (mg/L), using a multiparameter of mark HACK HQ14 and oxygen in percentage saturation (% sat) using a dissolved oxygen meter of mark AR8210. Water samples were collected using sterile double capped polyethylene bottles of 250 and 1000 mL bottles at the surface by directly filling, without bubbles, and transported to the laboratory in an insulated cooler. Back in the laboratory other parameters such as colour (Pt.Co), turbidity (FTU) suspended solids (mg/L), nitrates (mg/L), nitrites (mg/L) and phosphates (mg/L), using a spectrophotometer of mark HACH DR 1900. Heavy metals and herbicides were measured using a mass spectrometer of mark TSQ8000 and GC-MS/MS, respectively following standard methods (Rodier et al., 2009; APHA, 2017).
Measurement of biological parameters
Sampling of ciliates: Ciliates were sampled in 3 main ways: direct water sampling by collecting water from sampling stations from the water column without any form of filtration; sampling natural substrates by collecting dead leaves and branches on/in the water column; and sampling using artificial substrates consisting of 50 cm/50 cm/20 cm foam blocks placed at the bottom of each station and collected 5 to 7 days later (Dragesco et Dragesco-Kerneis, 1986).
Observation, identification and counting of ciliates: Water samples containing ciliated protozoa were homogenized and 1 mL was collected using a calibrated pipette and placed in a Petri dish. Observation, identification and counting were done both on living samples and after silver impregnations (silver carbonate and Klein Foisnner dry silver nitrate methods were used) (Foissner, 2014), using a binocular lens, a phase contrast light microscope and identification keys (Dragesco and Njine, 1971; Dragesco and Dragesco-Kerneis, 1986; Foissner et al., 1991, 1992, 1994, 1995). Three series of counts were carried out and their average recorded. This enabled the collection of abundance values for ciliated protozoans with reduced error linked to the random manner in which ciliates were distributed in water samples. Impregnations played a key role in identification by enabling the observation of taxonomically important cellular structures like the infraciliature, number, shape and position of nuclei (Foissner, 2014).
Data analysis
Data analysis was done using Microsoft Excel 2010, SPSS version 20.0 and PAST 3. It involved graphical representations of the results obtained, determination of diversity indices, significance difference tests (Tukey's range test) and correlation tests (Spearman's correlation coefficient). The monthly data obtained were used to calculate mean seasonal values. Tukey HSD post-hoc and Wilcoxons test were used to assess significant differences between stations and seasons for each physico-chemical parameter.
Spearmann rank correlation coefficient (r) was calculated using the software SPSS version 17.0. This coefficient enabled the measurement of the strength and direction (either positive or negative) of association between two ranged variables. It was used in the present study to establish the correlations between the different parameters measured and also the evaluation of the level of dependence between the different variables of the ecosystem. Two variables are more or less correlated using the Spearmann’s rank correlation (r) when their correlation coefficient is close to 1 (Jaber et al., 2018).
The Shannon and Weaver (H), Simpson's (1-D) and Margalef diversity indices were used to determine the community structure of ciliated protozoans. They accounted for both the abundance and the evenness of the species present.
Sorenson's Similarity Index (S) (Thorsvald, 1948) was used to determine the degree of similarity between the different sampling stations of the study.
The saprobic index (S) of Zelinka and Marvan (1961) was used in the biological assessment of organic pollution. Aquatic ecosystems are classified into 4 main classes (oligosaprobic, alpha mesosaprobic, beta mesosaprobic and polysaprobic).
The organic pollution index (IPO) (Leclercq, 2001) was determined in order to give a precise account on the degree of organic pollution across the different sampling stations during the period of study. The determination of this index was based on three parameters : NH4+ (mg/L), NO2- (µg/L) and PO43- (µg/L). For each parameter, 5 classes of ecological significance were defined (Table 1). The OPI corresponds to the class mean for the 3 measured parameters. The values obtained were classified under 5 different levels of pollution (Table 2) (Enah, 2019).

RESULTS
Physical parameters
Temperature
Temperatures varied from 24.5 to 26.3°C with an average
of 25.2±0.56°C. The highest temperature was obtained at station N3 during the SRS 2020 and the least at N1 during the LRS 2020. Station, N4 recorded the highest temperatures with a mean of 25.61±0.61°C and N1 the least with an average of 24.93±0.33°C. Highest temperatures were recorded during the short rainy season of 2020 with a mean of 26.19±0.40°C, while the least during the short dry season of 2020 with a mean of 24.71±0.04°C (Figure 2).

Suspended solids
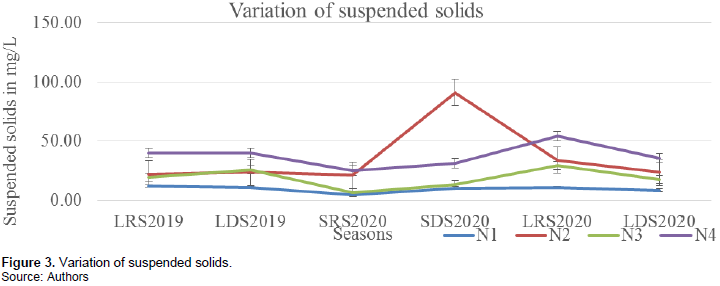
Suspended solids varied from 4.5 to 91.0 mg/L with a mean of 25.37±18.21 mg/L. The highest value was recorded at station N2 during the SDS (2020), and the least at station N1 during SRS (2020). Station N1 presented the lowest values with a mean of 9.46±2.44 mg/L while N4 had the highest values with a mean of 37.54±9.00 mg/L. Suspended solids were highest during the SDS 2020 with a mean of 36.42±32.48 mg/L and least during the SRS 2020 with a mean value of 14.25±8.89 mg/L (Figure 3).
Turbidity
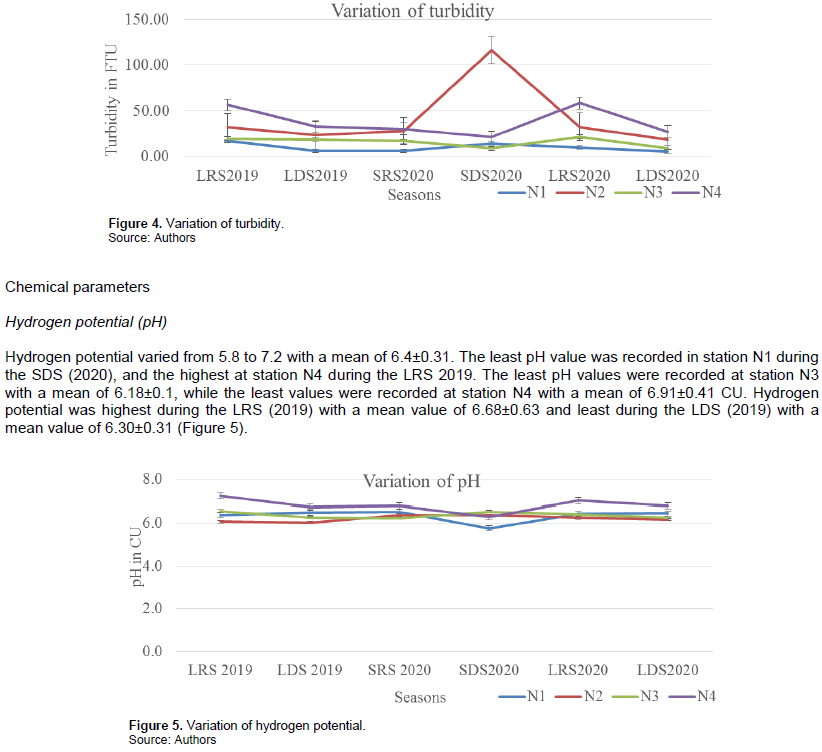
Turbidity varied from 6.0 to 116.7 FTU with an average of 26.46±23.13. The highest value was obtained at station N2 during the SDS (2020) and the least at station N1 during LDS (2020). Turbidity values were highest at station N2 with a mean of 41.97±33.74 FTU and least at N1 with a mean value of 10.01±4.28 FTU. The SDS (2020) had the highest turbidity values with a mean of 40.33±44.29 NTU while the LDS (2020) had the least values with a mean of 15.50±8.40FTU (Figure 4).
Electrical conductivity (EC)
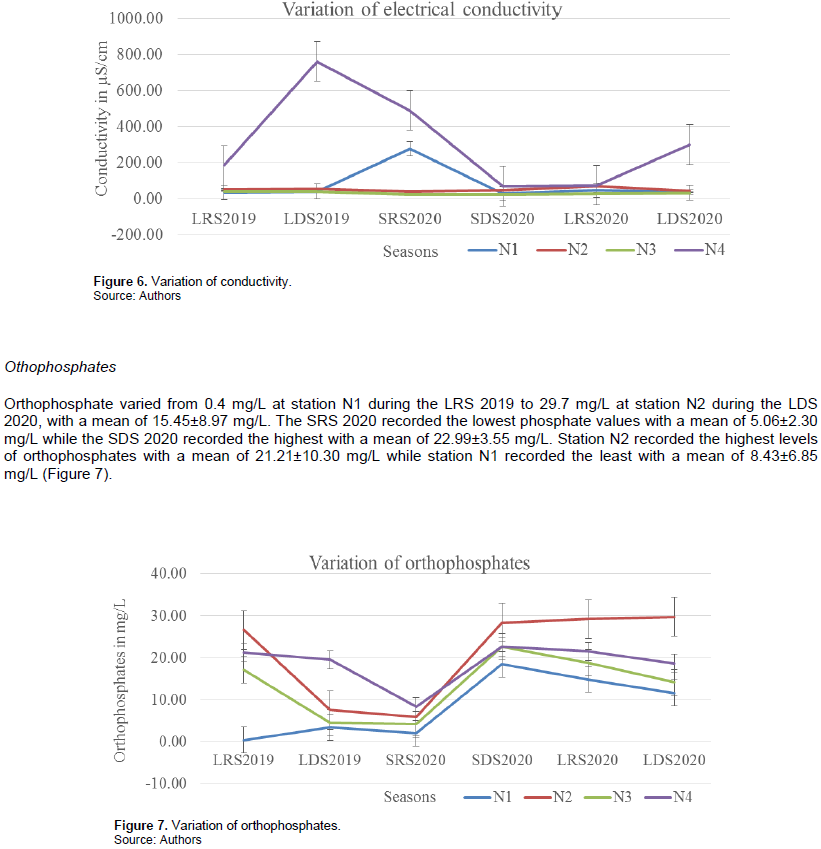
Conductivity values varied from 25.67 µS/cm at station N3 during the SDS of 2020 to 761.75 µS/cm at station N4 during the LDS 2020 with a mean value of 119.53±173.57 µS/cm. Station N4 recorded the highest values with a mean of 314.38±246.23 µS/cm while station N3 recorded the least with a mean of 32.94±6.2 µS/cm. Conductivity values were highest during the LDS 2019 with a mean value of 224.50±310.23 µS/cm and least during the SDS 2020 with a mean of 43.07±18.22 µS/cm (Figure 6).
Nitrates
A mean nitrate value of 1.70±0.88 mg/L was recorded, with maximum and minimum nitrate values of 4.05 mg/L recorded at station N4 during the SRS 2020 and 0.50 mg/L recorded at station N1 during the LRS 2019, respectively. Highest values were recorded at station N4 with a mean of 2.51±0.96 mg/L and the least at N1 with a mean of 0.87±0.22 mg/L. Nitrates were most abundant during the LRS 2020 with a mean of 2.04±0.90 mg/L and least during the SDS 2020 with a mean of 1.38±0.53 mg/L (Figure 8).

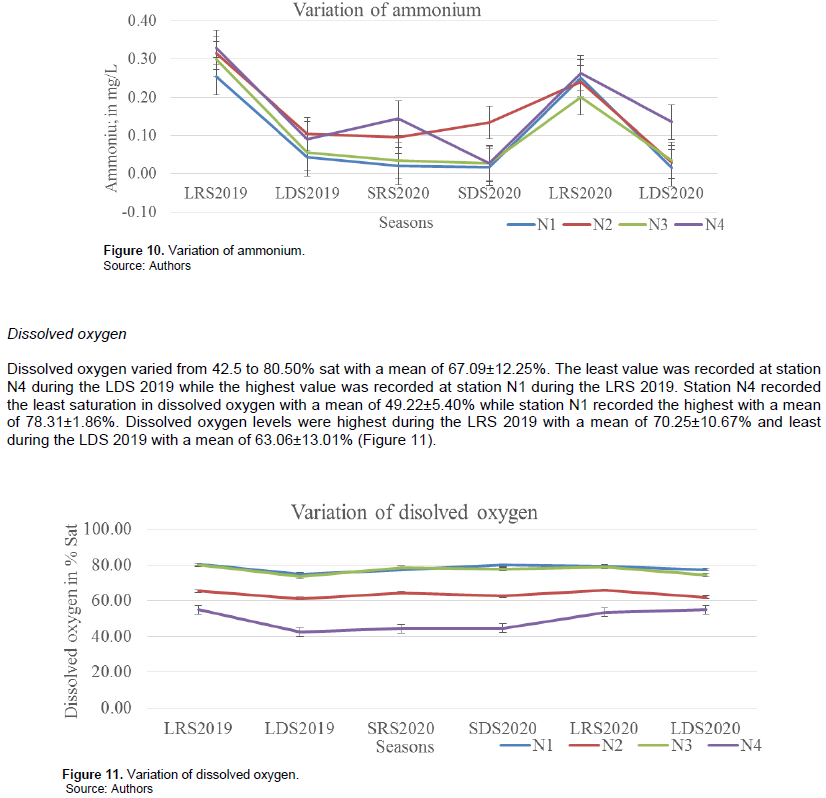
Ammonium
Ammonium varied from 0.02 to 0.33 mg/L with a mean of 0.13±0.11 mg/L. The highest ammonium value was recorded at station N4 during the LRS 2019, while the least was recorded at station N1 during the SRS, SDS and SDS of 2020. Ammonium was most abundant at station N4 with a mean value of 0.17±0.10 mg/L and least at station N1 with a mean of 0.10±0.11 mg/L. Ammonium values were highest during the LRS 2019 with a mean of 0.30±0.03 mg/L and least during the SDS and LDS 2020 with a mean of 0.05±0.05 mg/L (Figure 10).
Metallic elements
Several metallic elements were found in water samples. The most abundant being Zn, Mg, Na and Mn while the least being Cd and Ni. Metallic elements were highest at station N4 and least at station N3 and N4 (Figure 12).

Biological parameters
Ciliate composition
Five thousand seven hundred ciliates belonging to 57 species and 9 classes were recorded in the 4 stations. Marked domination of oligohymenophoreans was observed in both diversity (28%) and abundance (51%) (Table 3).

Ciliate species richness and abundance
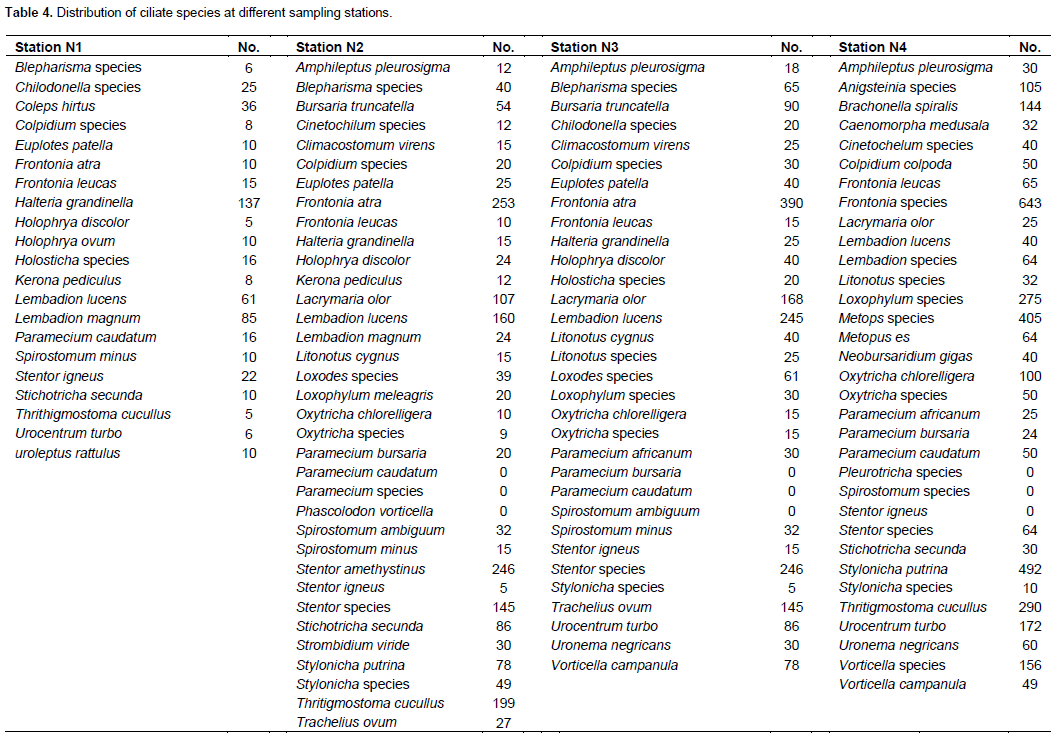
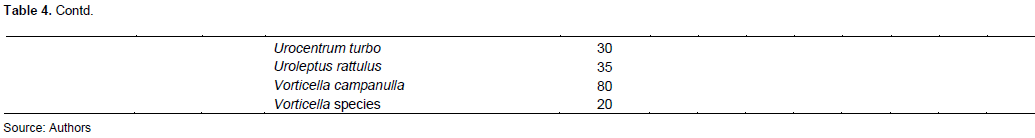
Ciliate species richness and abundance varied from one station to the other and from one season to another. The highest species richness and abundance were recorded at station N2 with a total of 2305 ciliates belonging to 39 species. The LDS 2019 recorded the highest species richness and abundance with 1521 ciliates belonging to 47 ciliate species recorded. Station N1 recorded the least species richness and abundance with just 375 ciliates belonging to 21 species recorded and the LRS 2019 recorded the least abundance with 555 ciliates belonging to 26 ciliate species recorded. The long dry season 2020 recorded the least species richness with only 25 ciliate species recorded (Figures 14A and B and 15A and B).
Ciliate diversity
Station N2 recorded the greatest diversity with Simpson 1-D and Shannon H diversity indices of 0.88 and 2.50, respectively. Station N1 showed the diversity with Simpson 1-D and Shannon H diversity indices of 0.72 and 1.49, respectively (Figure 16).

Sorenson’s similarity index
Sorenson’s similarity index stations in stations N2 and N3 showed the greatest similarity in ciliate community while stations N1 and N4 show the least with similarity indices of 73.2 and 33%, respectively (Table 4).
Data analysis and biological indices
Data analysis
Several parameters measured indicated significant differences from one station to another. Hydrogen potential was significantly higher at station N4 compared to N1, N2 and N3 with p values of 0.007, 0.001 and 0.01, respectively. Suspended solids also varied significantly between N1 and N2 (p=0.002), N2 and N3 (p=0.02) and between N2 and N4 (p=0.02). As for turbidity, a significant difference was noted only between N1 and N2 (p=0.03). Nitrates, nitrites and orthophosphates also recorded differences from one station to another. Nitrate values at station N2 were significantly different from those at N1 and N3 with p values of 0.001 and 0.02, respectively. Phosphate values recorded a significant difference only between stations N1 and N2 (p=0.02). As for nitrites significant differences were recorded between stations N1 and N2 (p=0.004), N1 and N4 (p=0.003) and between N1 and N3 (p=0.004). Significant differences were also recorded between temperature values in the SDS 2020 and those of LDS 2019 and SRS 2020 with p values of 0.003 and 0.03, respectively.
The abundance of ciliated protozoa differed significantly between the LDS 2019 and the LRS 2019 (p=0.004). Ciliate abundances also varied significantly between stations N1 and N2 (p= 0.02), but also between N1 and N4 (p=0.01). Several physico-chemical parameters showed either positive or negative correlations with ciliated protozoa recorded. Temperature had positive correlations with: Blepharisma hyalinum (p=0.03), Oxytricha chlorelligera (p=0.02) and Vorticella chlorelligera (0.02). Dissolved oxygen also had negative correlations with Brachonella spiralis (p= 0.013), Caenomorpha medusala (p=0.003) and Metopus es (p=0.00). Orthophosphates had significant positive correlations with Paramecium bursaria (p=0.012) and Stentor igneus (p=0.044). Suspended solids had a negative correlation with Chilodonella minuta (p=0.02) and positive correlations with Colpidium campylum (p=0.029), Frontonia species (p=0.015).
Biological indices
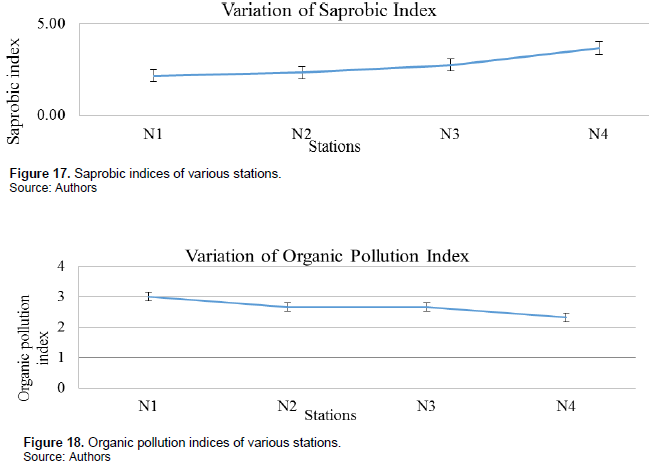
Saprobic index: Saprobic indices varied from one station to the other with station N1 having the least mean saprobic index during the various seasons of 2.16 and the station N4 has the greatest index of 3.67 as mean for the various seasons (Figure 17).
Organic pollution index: N1 had the least organic pollution index with a mean value of 3.00 indicative of moderate organic pollution while the rest had organic pollution indices indicative of strong organic pollution (Figure 18).
DISCUSSION
Water quality can be seen to vary greatly from one sampling station to another. It is evident that water quality in some of our stations notably N2 and N4 is of poor ecological quality. The relatively high (>20°C) and fairly constant water temperatures are typical of the tropical environment in which our study was carried out (Richter, 2016). These values are however similar to the 22 to 24°C recorded by Gwos et al. (2022), in streams in the Eastern region of Cameroon. These high temperatures speed up several chemical and biochemical processes in aquatic media (De villers et al., 2005). With the predominance of acidic ferralitic soils in the study area, the pH was averagely acidic except at the station N4. This modification of pH could be linked to infiltration of runoffs from nearby agricultural exploitations and effluents from the rubber conditioning factory which discharges at station N4 (Mitra et al., 2010). The influence of runoff rich in agricultural intrans such as fertilizers and herbicides can equally be shown by the relatively high values of parameters such as phosphates, nitrates, nitrites and ammonium. Results for these parameters were very similar to values recorded by Santza (2022) working in the Menoua basin in west Cameroon; an important agricultural zone in the country. The presence of phosphates and nitrates in water leads to an excessive growth of aquatic vegetation (Beniah and Ebere, 2020).
The excessive plant development notably at stations N2 and N4 might explain the high turbidity and suspended solids values recorded in these stations. These values were significantly higher than the maximum values of 20 mg/L and 23.5 FTU for suspended solids and turbidity, respectively recorded by Biram à Ngon et al. (2020) in Abouda forest stream, central region of Cameroon. Values for turbidity are also higher than the maximum value of 22.4 FTU recorded by Ndjama et al. (2017) in the Nkolbisson artificial lake in Yaounde. Campbell (2021) reported that suspended solids may decrease water’s natural dissolved oxygen levels and increase water temperature. This may prevent organisms living in the water, such as small fish, from being able to survive. TSS may also block sunlight, which may halt photosynthesis, decreasing the survival of plants and further decreasing water’s oxygen levels. Organic matter arising from the rubber conditioning factory present at station N4 might also explain the higher turbidity and suspended solids values recorded in the station (Arimoro, 2009).
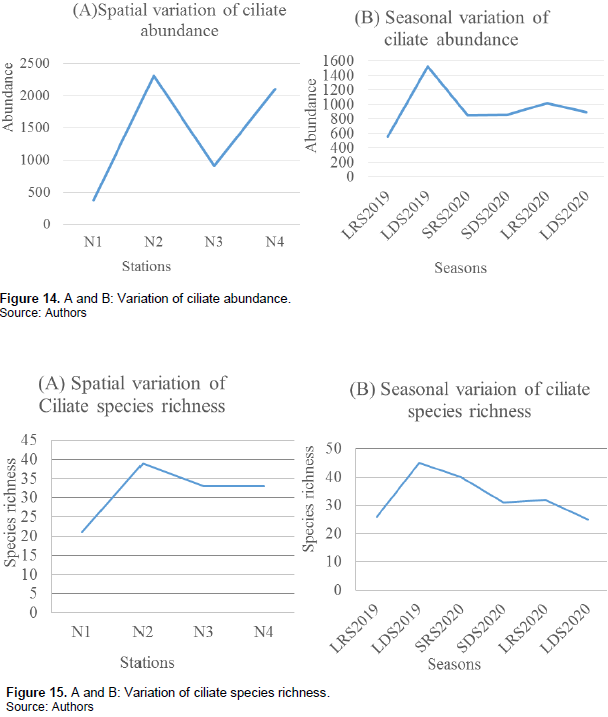
The relatively high dissolved oxygen levels recorded in the various stations except station N4 are typical of forests environments and are similar to results recorded in Nsapè, Douala (Tchakonte et al., 2014) and Mefou, Yaoundé (Foto et al., 2013). Low dissolved oxygen levels at station N4 however, are indicative of oxygen consumption by microorganisms during the degradation of organic matter present in industrial influents. Filter et al (2017) reported that due to microbial transformation of particulate and dissolved organic constituents, oxygen can be consumed within short flow distances and induce anoxic and anaerobic conditions. These results are concordant with those recorded by Omoigberale et al. (2021) on the impact of rubber effluent discharges on the water quality along a stretch of the Oken River, situated in the southern part of Edo State in Nigeria.
Higher conductivity values of up to 761.75 µS/cm recorded in station N4 were close to the mean value of 615.7 µS/cm recorded by Efiong and Eze (2004) in an effluent drain 50 m away from the rubber conditioning factory in Odukpani, Cross River State (Nigeria). This high conductivity values are linked to the decomposition of organic matter in the effluents and the presence of inorganic salts involved in rubber processing (Omoigberale et al., 2021).
Relatively high values of metallic elements and herbicide residues such as glyphosate, atrazine, metachlorine and flumeturon at concentrations not usually found naturally in surface waters in some stations and the proximity of these stations to agricultural production centers involving intrans on one hand and the insufficient treatment of industrial wastes by HEVECAM before discharging into the environment on the other hand (Mereta et al., 2020).
Ciliate species richness (57 species) is much higher than 34 species recorded by Ajeagah and Acha (2021) in the Mingoa drainage basin in Yaounde (Cameroon) and 43 species recorded by Djeufa (2008) in River Nga located in a peri urban zone (Cameroon). The highest species richness and abundance of ciliated protozoa was recorded in N2 while the least was in N1. The variation in ciliate species richness and abundance is linked to variations in values of various physico-chemical parameters such as nitrates and phosphate. High levels of phosphates and nitrates promote the development of phytoplankton and other plant matter whose decomposition upon death serves as an abundant source of food (Dias et al., 2008). The ciliate community consisting mainly of heterotrophic, predatory carnivorous, algivorous or omnivorous ciliates. According to Madoni and Braghiroli (2007), food is a very important factor in the distribution of ciliates in an ecosystem. Low levels of dissolved oxygen in station N4 is seen to favor the development of microaerobic ciliates such as Brachonella, Metopus and Caenomorpha which are indicators of the polysaprobic state of this station. Low oxygen levels also explain the lower ciliate diversity observed in station N4, which not all species can accommodate. This result is concordant with those reported by Udyog and Gupta (2001).
The organic pollution indices recorded in the stations indicated moderate to high levels of organic pollution. This concord with the values of saprobic indices recorded indicative of moderate to high organic load (Thorp and Covich, 2015). Station N1 located outside of the rubber plantation recorded the lowest level of pollution and station N4 which is an industrial effluent, the highest. Organic pollution in the study area is therefore clearly seen as resulting directly from intensive agriculture involving intrans and industrial effluents which were poorly treated before being discharged into the environment. This resulted in the proliferation of plant material, which is a consequence of a drastic increase in nutrients (notably phosphates and nitrates) in the environment (Mateo-Sagasta et al., 2017). The presence in surface waters of saprobelic ciliates such Metopus, Brachonella and Caenomorpha otherwise present mainly in anaerobic sediments and household sewage effluents (Foissner, 1999) is indicative of the state of organic pollution of this aquatic environments. It is therefore necessary for special care to be taken in monitoring water pollution in this area.
CONCLUSION AND RECOMMENDATIONS
Water from most of the study stations was degraded and of poor ecology. The presence of herbicides residues, heavy metals and high levels of phosphates and nitrates is indicative of pollution by agricultural intrans and industrial effluent. Clear correlations between physico-chemical parameters and ciliate distribution suggest influence of these factors on ciliate diversity and distribution. Excessive nutrient enrichment has resulted in an increased organic load of water with saprobic indices indicating moderate to high levels of organic pollution which explains the presence of saprobelic ciliates such Metopus, Brachonella and Caenomorpha in some stations. It is therefore necessary for urgent measures to be taken to stop the ongoing pollution of these aquatic ecosystems and put in place restoration mechanisms to ensure better water quality. It is also necessary to reinforce surveillance of aquatic ecosystems especially in pollution prone environments and also ensure the respect of norms with regards to treatment of industrial wastes before release into the environment.
CONFLICT OF INTERESTS
The authors have not declared any conflict of interests.
REFERENCES
|
Abhik M, Sadrita D, Bal KC, Koushik M (2014). Do Extensive Rubber Cultivation Influence Local Environment? A Case Study From Tripura, Northeast India. Current World Environment 9(3):768-779. |
|
|
Ajeagah GA, Acha YA (2021). Diversity of Infusorian Community Structure in an Equatorial Hydro system: Influence of Environmental Factors. Cameroon Journal of Biological and Biochemical Sciences 29(2):31-47. |
|
|
Antonija K, Vesna G, Renata MK, Petar Ž. Mirela SP, Sandi O, Katarina K, Thorsten S, Guillaume L, Ivan ?, Ivan M, Marija GU (2021). Ciliates (Alveolata, Ciliophora) as Bioindicators of Environmental Pressure: A Karstic River case. ELSEVIER: Ecological Indicators 124(107430). |
|
|
APHA, AWWA, WEF (2017). Standard Method for Examination of Water and Waste Water, 20th edition. American Public Health Association 1150 p. |
|
|
Arimoro FO (2009). Impact of Rubber Effluent Discharges on the Water Quality and Macroinvertebrate Community Assemblages in a Forest Stream in the Niger Delta. Chemosphere 77(3):440-449. |
|
|
Beniah OI, Ebere CE (2020). Pollution and Health Risks Assessment of Nitrate and Phosphate Concentrations in Water Bodies in South Eastern, Nigeria. Environmental Advances. |
|
|
Biram ANEB, Foto MS, Ndjama J, Mbohou NZ, Mboye BR, Dzavi J, Oumar MO, Tarkang C, Nyame MD, Mbondo BS, Ngalamou C (2020). Water Quality Assessment in a Less Anthropogenic Forest Stream in the Centre Region of Cameroon. Haya: The Saudi Journal of Life Sciences. 5(1):1-8. |
|
|
Campbel B (2021). What is Total Suspended Solids (TSS). Water and Waste Digest (WWD). |
|
|
Casey KN (2017). Agriculture and Water Pollution Risks. UTAR Agriculture Science 3?34-44. |
|
|
Communes et villes unies du Cameroun (CVUC) (2014). Niete. |
|
|
De Villers J, Squilbin M, Yourssowsky C (2005). Physico-Chemical and Chemical Quality of Surface Waters: Generale Framework. Bruxelles Institute for Environmental Managment. Environmental data Observatory. |
|
|
Dias RJP, Wieloch AH, D'Agosto M (2008). The Influence of Environmental Characteristics on the Distribution of Ciliates (Protozoa, Ciliophora) in an Urban Stream of Southeast Brazil. Brazilian Journal of Biology 68(2):287-295. |
|
|
Djeufa HG (2008). Community Structure of Ciliated Protozoans in the Nga Water Body. DEA dissertation. University of Yaounde 1. 73 p. |
|
|
Dragesco J, Njine T (1971). Complement to the Knowledge of Cameroonian Free Living Ciliates. Annales de la Faculté des sciences du Cameroun 7(8):79-140. |
|
|
Dragesco J, Dragesco KA (1986). Free Filiates of Inter Tropical Africa: Introduction to the Knowledge of the Study of Ciliates. ORSTOM, Faune Tropical XXVI, Paris, 559 p. |
|
|
Enah DA (2019). Characterasation of Benthic Macro-Invertebrates: Indicators of Organic Pollution in an Urbanized Area of North West Cameroon. Ph.D Thesis. University of Yaounde, Cameroon 242p. |
|
|
Filter J, Jekel M, Ruhl AS (2017). Impacts of Accumulated Particulate Organic Matter on Oxygen Consumption and Organic Micro-Pollutant Elimination in Bank Filtration and Soil Aquifer Treatment. Water 9:349. |
|
|
Foissner W (1999). Soil Protozoa as Bioindicators: Pros and Cons, Methods, Diversity, Representative Examples. Agriculture, Ecosystems and Environment 74:95-112. |
|
|
Foissner W (2014). An Update of Basic light and Scanning Electron Microscopic Methods for Taxonomic Studies of Ciliated Protozoa. International Journal of Systematic and Evolutionary Microbiology 64(Pt_1):271-292. |
|
|
Foissner W, Blatterer H, Helmut B, Kohmann F (1991). Taxonomische des Saprobien Systems. Band I :Cyrtophorida, Oligotrichida, Hypotrichida and Colpodea : Informationsberitchte Des Bayer Landesamtes Für Wasserwirtschaft. Heft 1/91, 478 p. |
|
|
Foissner W, Helmut B, Kohmann F (1992). Taxonomische des Saprobien Systems. Band II : Peritrichida, Heterotrichida and Odontostomatida: Informationsberitchte Des Bayer Landesamtes Für Wasserwirtschaft 5(92):1-502. |
|
|
Foissner W, Helmut B, Kohmann F (1994). Taxonomische des Saprobien Systems. Band III : Hymenostomata, pProstomatida, Nassulida: Informations Beritchte des Bayer Landesamtes Für Wasserwirtschaft Heft 1/94, 548 p. |
|
|
Foissner W, Helmut B, Kohmann F. (1995). Taxonomische des Saprobien Systems. Band IV : Gymnostomatae, Loxodes, Suctoria : Informationsberitchte Des Bayer Landesamtes Für Wasserwirtschaft Heft 1/95, 540 p. |
|
|
Foto MS, Tchakonté, S, Ajeagah, GA, Zébazé TSH, Bilong BCF, Njine T (2013). Water Quality Assessment Using Benthic Macroinvertebrates in a Periurban Stream (Cameroon). International Journal of Biotechnology 2(5):91-104. |
|
|
Gwos NSR, Foto MS, Nyame MD, Betsi WCN, Biram ANEB, Disso E, Mboyé BN (2022). Characterisation of Benthic Macroinvertebrates and Some Environmental Factors of Streams in Cameroon East Region. World Journal of Biology Pharmacy andHealth Science 11(01):5-17. |
|
|
Jaber A, Odeh A, Elayyan, Haifaa O (2018). Towards Quality Assurance and Exellence in Higher Education. River Publishers 284 p. ISBN 978-87-93-93609-54-9. |
|
|
Leclercq L (2001). Interest and Limits of Water Quality Estimation Methods. Scientific Station of Upper -Fagnes Belgium, Work document 44 p. |
|
|
Lichtfouse N, Mireille D, Philippe S, Véronique A (2009). Sustainable Agriculture. Dordrecht. Springer P 5. |
|
|
Madoni P, Braghiroli S (2007). Changes in the Ciliate Assemblage Along a Fluvial System Related to Physical, Chemical and Geomorphological Characteristics. European Journal of Parasitology 43(2):67-75. |
|
|
Mateo-Sagasta J, Marjani SZ, Turral H (2017). Water Pollution from Agriculture : A Global Review, the Food and Agriculture Organization of the United Nations Rome 35 p. |
|
|
Mereta ST, Ambelu A, Ermias A, Abdie Y, Moges M, Haddis A, Hailu D, Beyene H, Kebede B, Mulat WL (2020). Effects of Untreated Industrial Effluents on Water Quality and Benthic Macroinvertebrate Assemblages of Lake Hawassa and its Tributaries, Southern Ethiopia, African. Journal of Aquatic Science 45(3):285-295. |
|
|
Mitra M, Hasfalina CM, Mohd AH, Phang LY (2010). Treatment of Waste Water from rubber Industry in Malaysia. African Journal of Biotechnology. 9(38):6233-6243. |
|
|
Ndjama J, Ajeagah GA, Nkoue GRN, Wirming J, Biram ANEB, Eyong EGT, Ako AA, Mohamadou B, Tchouya RVN, Hell JV (2017). Physico-Chemical and Biological Characteristics of the Nklobisson Artificial Lake in Yaounde, Cameroon. Journal of Water Resource and Protection 9(12):1547-1563. |
|
|
Omoigberale MO, Ezenwa IM, Biose E, Okoye C (2021). The Impact of Rubber Effluent Discharges on the Water Quality of a Tropical Rain Forest River in Nigeria. African Journal of Aquatic Science pp. 1-12. |
|
|
Omorusi VI (2013). Evaluation of Waste Water (Effluent) from Rubber Latex Concentrate for Microbiological and Physcio- Chemical Properties. Researcher 5(5):60-63. |
|
|
Pooja A (2017). Physical, Chemical and Biological Characteristics of Water. Pathshala 16 p. |
|
|
Pratiksha S, Vikram G (2022). Artificial Intelligence and Data Science in Environmental Sensing. Elsevier Incorporated. 978-0-323-90508-4. 305 p. |
|
|
Richter M (2016). Temperatures in the Tropics. In: Pancel, L., Köhl, M. (eds) Tropical Forestry Handbook. Springer, Berlin, Heidelberg. |
|
|
Rodier J, Legube B, Marlet N, Brunet R (2009). Analysis of water. 9th edition. Dunod, Paris 1579 p. |
|
|
Santza CV, Ndjouenkeu R, Ngassoum MB (2022). Water from the Menoua Watershed (Cameroon) and Agricultural Pollution: the Chemical Risks Inherent in its Consumption. Environnement, Risques et Santé. 21(2):157-168. |
|
|
Singh RM, Asha G (2016). Water Pollution? Sources, Effects and Control. 16 p. |
|
|
Sparagano O, Groliere CA (1991). Evaluation of Water Quality of a River with Ciliates as Bioindicators of Pollution. Comparism with Physico-Chemistry. Applied Hydro Ecology 1:43-62. |
|
|
Tchakonté S, Ajeagah GA, Dramane D, Camara A, Konan KM, Ngassam P (2014). Impact of Anthropogenic Activities on Water Quality and Freshwater Shrimps Diversity and Distribution in Five Rivers in Douala, Cameroon. Journal of Biodiversity and Environmental Sciences 2(4):183-194. |
|
|
Third Census on the Population and Habitat (RGPH) (2005). Bureau Centrale des Recensements et des Etudes de Population du Cameroun (BUCREP). |
|
|
Thorp JH, Covich AP (2015). Ecology and General Biology, Fourth Edition. Elsevier Inc. pp. 225-271. ISBN 978-0-12-385026-3. |
|
|
Thorsvald S (1948). A Method of Establishing Groups of Equal Amplitude in Plant Sociology Based on Similarity of Species Content. Limnology and Oceanography 5:1-3. |
|
|
Trishala KP, Deepak R, Agrawal YK (2016) Bioindicators: The Natural Indicator of Environmental Pollution, Frontiers in Life Science 9(2):110-118. |
|
|
Udyog S, Gupta PK (2001). Assemblage of Ciliated Protozoan Community in a Polluted and Non-Polluted Environment in a Tropical Lake of Central Himalaya: Lake Naini Tal India. Journal of Plankton Research 23(6):571-584. |
|
|
World Population Prospects (2017) Revision: Key Findings and Advance Tables » (PDF). United Nations Department of Economic and Social Affairs, Population Division P 2. |
|
|
Zelinka M, Marvan.P (1961). Zur Präzisierung derbiologischen Klassifikation der Reinheit Fliessender Gewässer.Archiv f?r Hydrobiologie 57:389-407. |
|
Copyright © 2024 Author(s) retain the copyright of this article.
This article is published under the terms of the Creative Commons Attribution License 4.0


