ABSTRACT
Partial least square-structural equation modelling (PLS-SEM) was used to evaluate the factors affecting the development of effective water resource management policies. Researchers employed a purposive sampling method to come up with the most suitable respondents. The sample size of 152 respondents was computed from a population size of 245 water experts within Lake Victoria Basin (LVB) in Uganda. The questionnaire was self-administered to 152 respondents to dig out their views based on their experiences in water resource management. The authors aimed to ï¬nd out the relationship between efficiency of water allocation, natural hazards and risks, stakeholders’ participation, governance and decentralization, socio economic activities and effective water resource management policies. The ï¬ndings of this study revealed that governance and decentralization, natural hazards and risks, and socio-economic activities had a significant positive effect on effective water resource management policies. Governance and decentralization had the highest path coefficient (β= 0.453 and p-values = 0.000). The R2 value was scored at 0.680, which collectively explained 68% of the overall variance in the development of the policies. The study recommends putting special attention on governance and decentralization for effective water resource management policies. These ï¬ndings can support practitioners and decision makers engaged in the management of water resources within LVB and other water bodies worldwide.
Key words: East African Community, National Policies, integrated water resource management (IWRM), Partial Least Square-structural equation modelling (PLS-SEM).
Lake Victoria is the second largest fresh water lake in the world as well as the largest tropical lake. It has a surface area of 68,000 km2 (Odongtoo et al, 2018). The Lake is shared between Kenya, Uganda, and Tanzania that control 6, 45, and 49 % in sizes respectively (Dauglas et al., 2014). Lake Victoria Basin (LVB) is of great socioeconomic significance to the riparian states and it is a major source of water for domestic, agricultural, and industrial purposes. It provides large quantity of fish for East African countries as well as United States of America, Australia, European Union countries and Israel (Mongi et al., 2015).
Dauglas et al. (2014) and Okurut (2010) revealed that rapid population growth, increase in commercial activities, industrialization and poor waste management services led to increase in the volume of urban waste being discharged directly into the lake. These affect the quality and quantity of water resources in LVB. In order to avert this problem, there is a need for proper policies on the management of both liquid and solid waste from industrial and domestic sources. There is also need to strengthen, monitor, and control anthropogenic activities in the basin that are the root cause of ecosystems degradation. Government of riparian states managing LVB need to encourage regional interventions and incorporation, policies, strategies, laws, and other agreements into national legislation (Nakiyemba et al, 2013). The unsustainable land use practices such as deforestation, overgrazing, application of agricultural chemicals and uncontrolled urbanization negatively affect water resources and natural drainage systems within the basin (Mongi et al., 2015; Odongtoo et al., 2018). The end results are poor water quality, land degradation and increasing incidence of floods (Nsubuga et al., 2014; Devi et al., 2018). Good policies are necessary since they provide for implementation of laws and regulation governing sustainable use of water resources (Megdal et al., 2017). Water resource policies encompass the policy-making processes that affect the collection, preparation, use and disposal of waste (Afroz et al., 2014; Griffin, 2016). African Development Bank (ADB) (2000) reported that fourteen African countries were already experiencing water stress and water scarcity, and that, the above figure is expected to increase to twenty-five by year 2025 due to high population growth rate.
Poor management of water resources causes contamination of surface and ground water resources which in turn lead to a rise in the incidence of water-borne diseases, land degradation, floods, soil erosion, degradation of ecosystems, and loss of biodiversity (Linuma and Tenge, 2017). This situation is expected to worsen with rapid population growth, urbanization and growing water scarcity in LVB if nothing is done about it (Gichuki et al., 2012). National policies are of fundamental importance as they provide a framework for legislation, strategic planning and operational management (Bakibinge et al., 2011). They provide institutional mechanism for mitigation of such disasters when they occur (Nsubuga, et al., 2014).
According to Nsubuga, et al., (2014), the Uganda National Water Policy was adopted in 1999 and set the stage for water resources management to guide development efforts aimed at improving water supply and sanitation; furthermore, to promote a new integrated approach to water management that guides the allocation of water and associated investments. However, the policies tend to focus on standard policy solution such as liberalization and pricing of water services only. Nsubuga et al. (2014) added that the overall objective of the Uganda’s water policy is to manage and develop the water resources in an integrated and sustainable manner, so as to secure and provide water of an adequate quantity and quality. In addition, the policies acknowledge the need for cooperation on trans-boundary water resources management and its decentralization (Bakibinge et al., 2011).
Environmental policies for East Africa deal with management of environment, prevention of illegal trade and movement of toxic chemical substances. For the case of LVB, the challenge is to ensure uniformity of application of this protocol in line with existing national and by-laws in each riparian states (Bakibinge et al., 2011).
According to Nakiyemba et al. (2013), farmers in Uganda are highly dependent on wetlands for their livelihoods and it becomes difficult to realize the expected benefits of policies on wetlands. Furthermore, some policy failures include lack of institutional capacity, poor cooperation and coordination, lack of political support and communication. These had facilitated continuous encroachment on wetland. Linuma and Tenge (2017) reported that people living around LVB were not aware of the formal institutions involved in water resources management. Above authors argued that since the indigenous people have little awareness of policies and legislation concerning water resources, it had accelerated conflicts between formal and informal systems. The objective of this study was to apply PLS-SEM to evaluate the factors affecting development of effective water resource management policies for an integrated water resource management (IWRM) of LVB. PLS-SEM contained a two-step procedure that involved the evaluation of the outer measurement model and evaluation of the inner structural model (Henseler et al., 2009; Shahid et al., 2018).
Brief description of the study area
LVB is a Trans-boundary ecosystem shared among Uganda, Kenya, Tanzania, Rwanda and Burundi. It is situated on the latitudes 50 30”N and 120S and longitude 41050”E and 280 45”E (Mongi et al., 2015). The basin is well endowed with natural resources such as mineral, water, forest, land for agricultural and industrial purposes, human habitat, wildlife and fishery (Odongtoo et al, 2019).
The study was done in the districts of Buikwe, Jinja, Wakiso, Mukono and Kampala. The reason for choosing the above districts was based on that fact that; they heavily depend on LVB for their survival, the areas have water resource management challenges and there were key stakeholders willing to contribute to research works. Key stakeholders that were engaged in this study included employees from Lake Victoria Basin Commission, Lake Victoria Fishery Organization, Uganda Forest Authority, National Environment Authority, Ministry of Water and Environment, National and Regional policy making and communication organs and key community leaders.
Method of data collection
The data collection procedures involved three important steps as shown in Figure 2 which was adapted from Shahid et al. (2018). First: Preliminary variables were obtained through literature review to develop the hypotheses. Second: Pilot study was done to gain a better insight and completeness of the questionnaire tool. Third: A survey was conducted to obtain the perception of the respondents.Sample size was computed using Slovin’s formulae:
where n is the sample size, N is the population size and e is the error margin (Tejada and Punzalan, 2012). Sample size of 152 respondents was computed from a population size of 245 persons, a degree of confidence of 95% and error margin of 5%.
The questionnaire that was used to test the hypothesis consists of two sections. Section one consist of the respondents’ personal information and section two was categorized into five groups in accordance with the nature of the factors. The questionnaires were self-administered to different stakeholders having experience of more than 5 years in water sectors including executives, managers, water engineers and IT officers. The data collection process took four months. The summary of the hypothesis are as shown in the conceptual model in Figure 1 which was adapted from Shahid et al. (2018). Hypothesis 1 (H1): Efficiency of water allocation factor has a significant and positive effect on water resource management policies. Hypothesis 2 (H2): Natural hazard and risk factor has a significant and positive effect on water resource management policies. Hypothesis 3 (H3): Stakeholders’ participation factor has a significant and positive effect on water resource management policies. Hypothesis 4 (H4): Governance and decentralization factor has a significant and positive effect on water resource management policies. Hypothesis 5 (H5): Socio-economic activities factor has a significant and positive effect on water resource management policies (Figure 2).
Data analysis
The analysis of hypothesized structural model in figure 1 was done using Smart-Partial Least Square version 3. Smart-PLS has advantages over other regression-based methods because of the following reasons; First: it has a good capability of evaluating several latent constructs with various manifest variables. Second: It has a capability to evaluate the constructs when the sample size is small. Third: It has the ability to deal with highly complex models and categorical variables (Hair et al, 2011). Smart-PLS is commonly applied in regression models, covariance models, correlation model, path analysis and confirmatory factor analysis (Shahid et al., 2018). In this study, the sample size was 152 and therefore justifies the use of Smart-PLS.
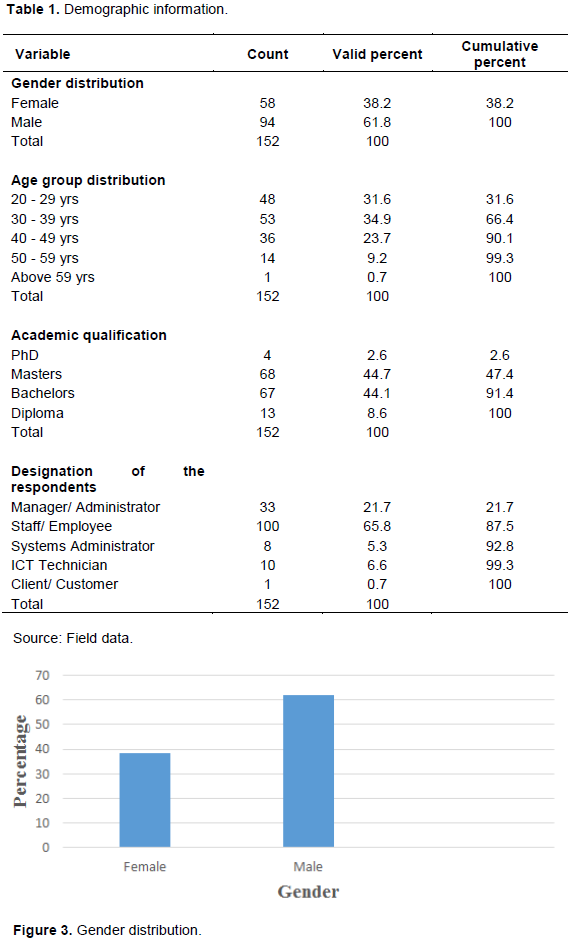
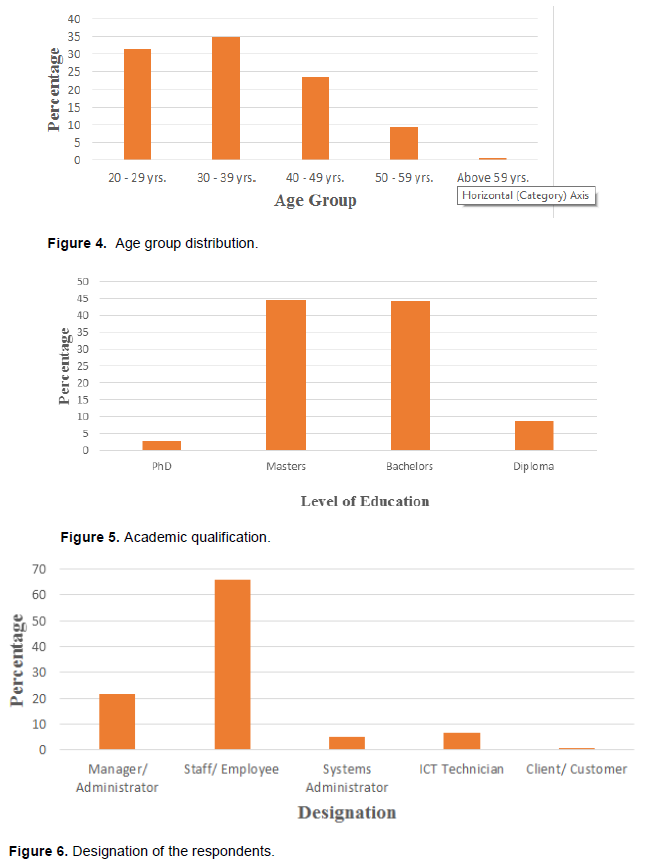
Demographic information of the respondents
The demographic information is as shown in Table 1. 61.8% were males and 38.2% were females. The highest percentage (34.9%) is the middle age group (30-39 years). 20-29 years were 31.6%; 40-49 years were 23.7%. Those aged 50 years and above were 9.9%. In Figure 5, the highest percentage (44.7%) of the respondents has Master’s Degree, followed by those who have Bachelor’s degree (44.1%), Diploma (8.6%) and PhD (2.6%) (Figures 3 and 4).
In Figure 6, the highest category of workers (65.8%) were staff/employee followed by mangers/administrators (21.7%), system administrators (5.3%) and ICT Technician (6.6%). Age, sex, qualifications and designation are important in understanding opportunities offered and constraints. It has a significant effect on the perception of a person in terms of information (Mongi et al., 2015). The highest percentage of the age group was the middle group (30-39) years. These are the most active group in water resource management. They can even form social group and association to help manage water resources. Older people tend to have more while highly educated people display more in-depth knowledge on the subject matter. Low level of education has an impact on the use and adoption of technologies. Designation relates more to the skills surrounding the management of water resources.
Evaluation of outer measurement model
Outer loading
To evaluate the factors affecting the development of effective water resource management policies, PLS-SEM was used because it employs a good procedure to determine an association and causal relationship between variables. It computes the path coefficient to assess the validity of the constructs (Hair et al., 2013). PLS-SEM employs a robust bootstrapping technique that computes the signiï¬cance value of the path coefï¬cient (Shahid et al., 2018). The hypothesized model was analyzed in two different stages; First: it comprised a measurement model that defined the relationship between latent indicators and their manifest variables. Second: a structural model comprising the relationship between the latent variables. A total of 20 latent indicators got through review of literature were named as the observed variables and put into five groups. The five groups were called exogenous latent constructs. The conceptual model presenting the relationship between the five exogenous latent constructs and endogenous latent construct is as shown in Figure 1.
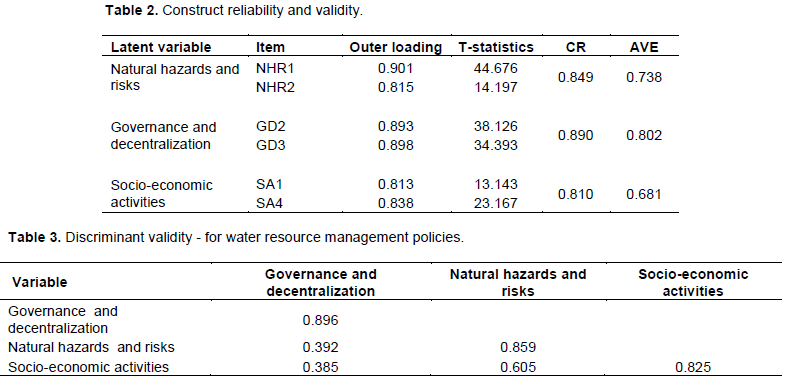
In order to calculate the reliability, internal consistency, and validity of the observed variables, outer loading was used (Gabriel et al., 2016). Consistency evaluations were based on a single observed and construct reliability tests. Convergent and discriminant validity were used for the assessment of validity. Observed variables with an outer loading of 0.7 or greater are greatly acceptable, while the outer loading with a value less than 0.7 is unacceptable and should be dismissed (Shahid et al., 2018). From Table 2, the outer loadings ranged between 0.813 and 0.901and therefore acceptable. Composite Reliability (CR) was used for internal consistency evaluation in the construct reliability. Composite reliability values of 0.6 to 0.7 are acceptable in exploratory research while in more advanced stages of research, 0.7 to 0.9 can be regarded as satisfactory (Nunnally and Bernstein, 1994).
Average variance (AVE)
The lowest 50% of the average variance from the observed variable should be taken by the latent constructs in the model (Hair et al., 2011). From Table 2, all AVE values were more than 0.5, so convergent validity was confirmed for this study model. These results confirmed the convergent validity and good internal consistency of the measurement model. Table 3 shows the Fornell and Larcker criterion test of the model where the squared correlations were compared with the correlations from other latent constructs. It shows that all the correlations were smaller relative to the squared root of average variance exerted along the diagonals satisfying discriminant validity of the model. Table 3 shows that the cross-loading of all observed variables were more than inter-correlations of the construct of all other observed variables in the model. Therefore, these findings confirmed the cross-loadings assessment standards and provided acceptable validation for discriminant validity of the measurement model.
Estimation of path coefficients (b) and p-values (p)
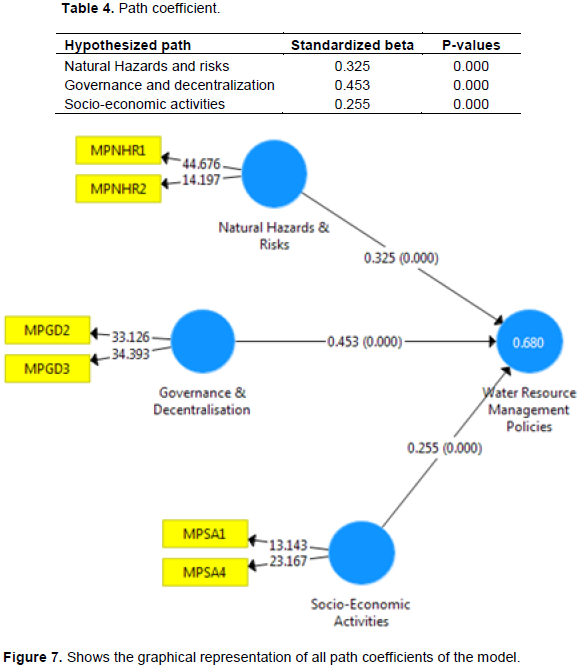
In Table 4, the path coefficients in the PLS and the standardized beta (b) coefficient in the regression analysis were computed. Through the b values, the significance of the hypothesis was tested. The b denoted the expected variation in the dependent construct for a unit variation in the independent construct(s) as shown below. The b values of every path in the hypothesized model were computed; the greater the b value, the more the substantial effect on the endogenous latent construct. However, the b value had to be verified for its significance level through the p- test which is supposed to be less than 0.05 (Kay, 2013).
In (H2), we predicted that the natural hazards and risk factor would significantly and positively influence water resource management policies. As predicted, the findings in Table 4 and Figure 7 confirmed that natural hazard and risk factor significantly influenced water resource management policies (b = 0.325, p < 0.00). Hence, H2 was supported. Furthermore, when observing the direct and positive influence of governance and decentralization related factor on effective water resource management policy, the findings from Table 4 and Figure 7 endorsed that the governance and decentralization related factor positively influenced water resource management policy (b = 0.453, p < 0.000) showing that (H4) was robustly confirmed. Also the influence of socio economic related factor on water resource management policy was positive and significant (b = 0.255, p < 0.000), showing that (H5) was greatly supported. The greater the beta coefficient (b), the stronger the effect of an exogenous latent construct on the endogenous latent construct. Table 4 and Figure 7 showed that governance and decentralization related factor had the greatest path coefficient (b = 0.453, p< 0.000) when compared to other b values in the model. This shows that it has a greater value and therefore exerts a greater influence on water resource management policy. The rest of the hypothesis failed the statistical test hence, were discarded.
Coefficient of determinant R2
As shown in Figure 3, the R2 = 0.68. The R2 measures the total quantity of the effect which the exogenous latent constructs has on the endogenous latent construct. It is also a measure of the model’s predictive accuracy. In this study, the inner path model was scored at 0.68. This means that the three independent constructs substantially explain 68% of the variance in water resource management policies. According to Henseler et al. (2009) and Hair et al. (2011), R2 values of 0.75 and above are considered substantial, while R2 value of 0.50 to 0.75 is regarded as moderate, 0.26-0.50 is acceptable and R2 values of 0.26 and below are considered as weak. Hence, in this study, the R2 value was moderate.
Business benefit
In accordance with the complete analysis of the study, some of the hypotheses as shown in Table 4 were statistically significant and hence were accepted while others failed the analysis and were rejected. These results give accurate information of the factors affecting development of effective water resource management policies. This result can support building a set of strategies to overcome challenges in the management of water resources in LVB. It is therefore important to consider natural hazards and risks, governance and decentralization, and socio-economic factors when developing effective water resource management policies for an integrated water resource management of Lake Victoria Basin.
Limitation and constraints of the study
Lake Victoria Basin covers many countries including Uganda, Kenya, Tanzania, Rwanda and Burundi. For this study it was not possible to visit all the countries of the East African Community (EAC) due to logistical constraints. However, this will be the case in future when the current logistical constraints are solved. There were some research participants who never wanted to either be interviewed or ï¬ll the questionnaire after knowing that the research is about the activities they were involved in around the Lake. This took the researchers a lot of time to identify willing participants to take part in the study.
The key contribution of this study was to empirically identify the factors affecting the development of effective water resource management policies using the PLS-SEM technique. It was also to examine the fundamental issues affecting constructs observed by water resource management experts in LVB. The results of the study revealed that natural hazards and risks, governance and decentralization, and socio-economic activities had a significant and positive effect on the effective water resource management policies. The overall results revealed that governance and decentralization had the highest path coefficient (beta= 0.453, p=0.000) which means it had the greatest influence on water resource management policies. Furthermore, the study discovered that there were weaknesses in the enforcement of policies and also little awareness of the policies. This could be so, because of lack of reliable communication strategies which can help stakeholders share and coordinate information on management of water resources. Therefore, water resource managers should pay more attention to governance and decentralization related factors during the development of polices in water resource management. The findings of this study show that not all suggested hypotheses were supported; those that did not pass the test were discarded.
The study recommends that managers of LVB pay more attention to factors related to natural hazards and risks, Governance and Decentralization, and Socio-economic activities for a development of effective water resource management policies with special attention on governance and decentralization. The study further recommends that all stakeholders engaged in LVB be involved in the development of policies. Also more awareness creation on policies managing LVB needs to be done by all respective riparian states of East African Community (EAC) to their citizen.
Lesson learned and further studies
The study revealed that some people living around LVB were not aware of the formal institutions involved in water resources management. That it may be due to less perception of the communities towards these institutions as part of the entity in the management of water resources. Furthermore, the study revealed that indigenous people have little awareness of policies and legislation concerning water resources which had accelerated conflicts between formal and informal systems.
Areas for further studies may include analyzing the relationship between factors for development of effective water resource management policies and effective decision making for an integrated water resource management of Lake Victoria Basin.
The authors have not declared any conflict of interests.
Many thanks to all institutions and key informants involved in the studies for cooperating with the authors in providing the reliable information needed for this study. Special thanks to Makerere University and Busitema University for financial support during data collection.
REFERENCES
|
African Development Bank (ADB) (2000). Integrated Water Resources Management Policy.
|
|
|
|
Afroz R, Masud MM, Akhtar R, Duasa J (2014). Water Pollution: Challenges and Future Direction for Water Resource Management Policies in Malaysia. Environment and Urbanization ASIA 5(1):63-81.
Crossref
|
|
|
|
|
Bakibinge-ibembe DJ, Said AV, Mungai WN (2011). Environmental laws and policies related to periodic flooding and sedimentation in the Lake Victoria Basin of East. Africa. African Journal of Environmental Science and Technology 5(5): 367-380.
|
|
|
|
|
Dauglas WJ, Hongtao W, Fengting L (2014). Impacts of population growth and economic development on water quality of a lake: case study of Lake Victoria Kenya water. Environmental Science and Pollution Research-Springer-Verlag Berlin Heidelberg 21:5737-5746.
Crossref
|
|
|
|
|
Devi SP, Jothi S, Devi1 A (2018). Data Mining Case Study for Water Quality Prediction using R Tool. International Journal of Scientific Research in Computer Science, Engineering and Information Technology 3(1):262-269.
|
|
|
|
|
Gabriel CC, Christian MR, Jörg H, José L (2016). Prediction-oriented modeling in business research by means of PLS path-modeling. Business Research 69:10.
Crossref
|
|
|
|
|
Gichuki J, Omondi R, Boera P, OKurut T, Matano A, Jembe T, Ofulla A (2012). WaterHyacinth Eichhorniacrassipes (Mart.) Solms-Laubach Dynamics and Succession in the Nyanza Gulf of Lake Victoria (East Africa): Implications for Water Quality and Biodiversity Conservation. The Scientiï¬c World Journal 2012.
Crossref
|
|
|
|
|
Griffin R (2016). Water Resource Economics: Analysis of scarcity policies, and projects. MIT Press.
|
|
|
|
|
Hair FJ, Ringle MC, Sarstedt M (2013). Partial Least Square Structural Equation Modelling: Rigorous Application, better results and higher acceptance. Elsevier 46:1-12.
Crossref
|
|
|
|
|
Hair JF, Ringle C, Sarstedt M (2011). PLS-SEM: Indeed a Silver Bullet. Marketing Theory and Practice 19:139-151.
Crossref
|
|
|
|
|
Henseler J, Ringle C, Sinkovics R (2009). The Use of Partial Least Squares Path Modeling in International Marketing. Advance in International Marketing 20:277-319.
Crossref
|
|
|
|
|
Kay WKK (2013). Partial Least Squares Structural Equation Modeling (PLS-SEM) Techniques Using SmartPLS. Marketing Bulletin 24:1-32.
|
|
|
|
|
Linuma OF, Tenge AJ (2017). Challenges of Formal Institutions in Water Resources Management in the Lake Victoria Basin. International Journal of Modern Social Sciences 6(1):34-50.
|
|
|
|
|
Megdal SB, Eden S, Shamir E (2017). Water Governance, Stakeholder Engagement, and Sustainable Water Resources Management 9:190.
Crossref
|
|
|
|
|
Mongi HJ, Mvuma AN, Kucel S, Tenge AJ, Gabriel M (2015). Accessibility and utilization of mobile phones for governance of water resources in the Lake Victoria Basin: Constraints and opportunities in Tanzania. African Journal of Environmental Science and Technology 9(5):438-450.
Crossref
|
|
|
|
|
Nakiyemba WA, Isabirye M, Poesen J, Maertens M, Deckers J, Mathijs E (2013). Decentralised Governance of Wetland Resources in the Lake Victoria Basin of Uganda. Natural Resources 4:55-64.
Crossref
|
|
|
|
|
Nsubuga NWF, Namutebi NE, Nsubuga-Ssenfuma M (2014). Water Resources of Uganda: An Assessment and Review. Journal of Water Resource and Protection 6(14):18.
Crossref
|
|
|
|
|
Nunnally JC, Bernstein I (1994). The Assessment of Reliability. Psychometric Theory 3:248-292.
|
|
|
|
|
Odongtoo G, Lating PO, Ssebuggwawo D (2018). A Mobile Application Tool To Mitigate Communication Challenges in Water Resource Management of Lake Victoria Basin: Water resources and wetlands, 4th International Conference Water resources and wetlands, 5-9 September 2018, Tulcea (Romania). p. 312.
|
|
|
|
|
Odongtoo G, Ssebugwawo D, Okidi LP (2018). Factors Affecting Communication and Information Sharing for Water Resource Management in Lake Victoria. In: Handbook of Climate Change and Biodiversity, p. 211.
Crossref
|
|
|
|
|
Odongtoo G, Okidi LP, Ssebuggwawo D (2019). An integrated Solution for an Integrated Water Resource Management of Lake Victoria Basin. Annals of Valahia University of Targoviste. Geographical Series 19(1):11-21.
|
|
|
|
|
Okurut T (2010). Integrated Environmental Protection Approaches: Strengthening the role of Water Supply Operators in Resource Conservation", 15th International African Water Congress and Exhibition Commonwealth Resort, Munyonyo, Kampala, Uganda
|
|
|
|
|
Shahid H, Fangwei Z, Ahmed FS. Ali Z, Muhammad SS (2018). Structural Equation Model for Evaluating Factors Affecting Quality of Social Infrastructure Projects. Open Access Journal of Sustainability 1415:10.
Crossref
|
|
|
|
|
Tejada JJ, Punzalan JR (2012). On the Misuse of Slovin's Formula. The Philippine Statistician 61(1):129-136.
|
|