Water quality is a highly concerning issue as long as irrigation is planned to be used for crop production. Hence, groundwater at Bochessa catchment was assessed to determine the spatiotemporal variability of its quality and to evaluate its suitability for irrigation. For this study, 8 boreholes were selected and sampling was done during the dry and wet seasons between 2015 and 2017. Totally 48 water samples were collected from monitoring boreholes for laboratory analysis. Water samples were analyzed for 13 parameters including major cations and anions. The general linear model of two ways analysis of variance was used to determine the variability of parameters across the seasons and locations. The results revealed that about 46.0 and 16% of the parameters showed significant variation at P<0.05 across seasons and locations, respectively. This suggests temporal variation has a noticeable effect on the quality of groundwater. Almost all quality parameters showed a declining trend during the wet season. This also confirmed that how temporal variation influences groundwater quality in the area. SAR values in all locations were found within the limit and the water is suitable for irrigation. However, its values showed an increasing trend over time suggesting sodicity may challenge irrigation practices. Therefore, management practices such as; irrigation-fallowing, leaching, and choice of crops may help the farmers to maintain soil productivity.
Food insecurity issues in developing countries including Ethiopia make irrigated agriculture an important area of interventions. FAO (2017) and CSA (2018) reports indicated that more than eight million peoples were faced with the food shortage problem annually in dry regions of Ethiopia. Major causes that attributed to this problem are climate variability and extreme weather conditions during cropping seasons (Husien et al., 2017; FAO, 2017; Hadera, 2018). For instance, 2015/2016 El Niño-induced drought caused crop failure mainly in dry parts of the country (FSIN, 2018). Continuous seasons of poor rainfall coupled with prolonged drought in such areas strained livelihoods, destroyed crops and pushed up food prices. Besides, more than 80 percent of populations live in rural areas where rain-fed agriculture is the dominant source of household income (Edossa et al., 2014; Abduselam, 2017; CSA, 2018). This situation makes the livelihood of the farming community extremely vulnerable to changes in weather conditions. Hence, the use of irrigated agriculture is a key factor to counter the problems created by fluctuating weather conditions.
Central Rift Valley Lakes Basin where the present study site located is well known for a shortage of rainfall but potentially suitable for irrigated agriculture (Legesse and Ayenew, 2006; Ayenew, 2007; Halcrow, 2008). Edossa et al. (2014) and Kefyalew (2016) reported that agricultural activities are considered as the main source of income for households in the area to sustain life. Despite this fact, agricultural practices are traditional and only practiced during the rainy seasons. The government and non-governmental organizations have given due attention to improving the situation by facilitating infrastructures for irrigation practices. Several authors argued that sustainable irrigated agriculture highly depends on an adequate supply of quality water (Edossa et al., 2014; Abay et al., 2016; Husien et al., 2017; Qureshi et al., 2018; Sankar et al., 2018). Ayers and Westcot (1985) suggested that early day's water quality has often been neglected because good quality water supplies have been plentiful and readily available. Pascual et al. (2014) and Mesfin (2015) reported that demand for irrigation showed an increasing trend over time. The supply of water for irrigation practices in the future requires sound planning to ensure the available quality water must be used productively.
The suitability of water for irrigation is determined by the type and total amount of salts present in the water (Bauder et al., 2011; Husien et al., 2017). The problems associated with irrigation water may vary both in kind and degree and can be modified by manipulating soil conditions, choosing proper crops and relying upon favorable climate seasons (Adamu, 2013; Mesfin, 2015; Husien et al., 2017). There is no prescribed limit on water quality; rather its suitability is determined by conditions that could affect the accumulation of water constituents. The water quality variation may arise from its sources or may develop over time through leachates from cultivated lands. Variations in irrigation water quality can also be affected by climate and surrounding land-use practices. For instance, the use of poor quality water for irrigation may aggravate salinity problems, but practicing fallowing for some time may help to reduce the severity. Thus, monitoring the quality of available water source is very important in assuring its supply for future needs.
Water quality variability occurs not only across locations but also over time. Hence, the evaluation of its quality across time and location is critical to use the available water resources in an efficient manner. Abel et al. (2011), Reddy (2013) and Islam et al. (2016) reported that the variability of water quality can pose management challenges in irrigated fields. Thus gathering reliable information on trends of water quality is essential to design appropriate farm management practices. Tessema et al. (2014), Abay et al. (2016), Islam et al. (2016), Nag and Suchetana (2016) and Husien et al. (2017) suggested that knowledge on irrigation water quality will help a lot during the development of strategies for farm management practices. Some works on irrigation water quality evaluation were done in the present study area (Mesfin, 2001; Halcrow, 2008; Pascual-Ferrer et al., 2014; Abay et al., 2016; Hadera, 2018). However, these works did not consider the spatial and temporal variability of irrigation water quality at the farm level. Therefore, the present study was undertaken with three main objectives, namely i) assessing seasonal and spatial variation of irrigation water quality; ii) determining the suitability of water quality for irrigation and iii) suggesting possible management options to the farmers.
Description of the study area
Location
The study area is located in Adamitulu District in the South Western Shewa zone of the Oromiya Regional State of Ethiopia (Figure 1). Geographically, the area extends from 7° 50' 00'' to 7° 53' 57'' N latitude and from 38° 42' 00'' to 38° 46' 00'' E longitude. The site is located in the Central Rift Valley region about 160 km south of Addis Ababa, nearby Ziway town. The study site has an area of 1020 hectares and accommodates more than 700 households that are dependent on a mixed crop-livestock production system. The altitude of the study area ranges from 1600 - 1950 m above sea level in the tropical semi-arid zone in the middle part of the Ethiopian rift valley system. There is a small variation in the length of days in different seasons and the area is suitable for tropical crop production.
Climate and land use
Metrological data (1997 - 2017) obtained from the nearby weather station (Ziway Branch) are presented in Figure 2. The average relative humidity varied from 46.5% during the dry season to 75.5% during the wet season. The average minimum temperature were 19.2°C while the average maximum temperature was 27.5°C. A major rainfall event in the area occurs between June to September and a minor rainfall event occurs between March and May. The main rainy season contributes more than 75% of the total annual rainfall that the area received. The mean annual rainfall in the area varied from 600 to 850 mm and the rainfall pattern is erratic and unreliable. However, annual average potential evapotranspiration is approximately 1200 mm which signifies the importance of irrigation to filling the gap. The geology of the area is marked by a thick cover of volcanic and fluvial lacustrine deposits (Woldegabriel et al., 1990; Halcrow, 2008). The oldest volcanic rocks are also found in the western and eastern escarpments. Alemayehu et al. (2016) reported that the Solonchacks is the major soil type exhibited in the area and in most cases such type of soils developed from salt-rich parent materials. The property of the soil ranges from slightly alkaline to strongly alkaline in reaction and dominantly sandy loam in texture. Topographically the area is characterized by plain to undulated hills located adjacent to the escarpment of the central part of the Ethiopian mountain channels.

The major land-use types in the area are related to cultivation and grazing. The cultivable land is concentrated in the flat area while grazing land is located in the hilly area and lakeshores. The major cash crops grown in the area with help of irrigation are; tomato (Solanum lycopersicum), leafy cabbage (Brassica carinata), onion (Allium cepa) and green beans (Phaseolus vulgaris). The main food crops are maize (Zea mays L.), teff (Eragrostis teff) and wheat (Triticum asteivum). These crops are mainly cultivated during the rainy seasons. The most dominant types of livestock found in the area are cattle and goats with limited numbers per household. The natural vegetation is situated nearby the lake and river banks and is mainly composed of bushes and acacia species. In general, the economy of the study area is largely based on subsistence crops and animal production activities.
Site selection
The study area was selected based on food insecurity problems that are prevalent in the area due to unreliable climatic conditions. Moreover, the site is well-known for the shortage of rainfall but is suitable for irrigated agriculture with the help of surface or groundwater sources. Agriculture is the most dominant form of economic activity in the area which supports the livelihood of inhabitants. However, the farming system is traditional and highly dependent on rain as a source of water. Recently, governmental and non-governmental organizations have given due attention to developing small scale irrigation facilities in the area to improve the situation. Irrigation practices, in most cases, are highly linked to the availability of good quality water sources. The use of unsuitable water sources for irrigation may lead to deterioration of soil quality. Therefore, assessing the seasonal variability of irrigation water quality at the farm level is critical to provide reliable information to the users. It can help them to improve on-farm water management practices to maintain the productivity of farmlands.
Sampling techniques
The characteristic features of the boreholes were fully understood before the actual work by doing preliminary surveys in the area. The survey was conducted by using an informal discussion with extension workers and model farmers who actively engaged in irrigation practices. The discussion pays more attention to irrigation practices and trends of input utilization. The obtained information’s indicated that in the dry season most farmers practiced irrigation with help of groundwater. The information’s further outlined that boreholes found near to the farm fields were more utilized for irrigation purposes while near the home yards were utilized for domestic consumption. Moreover, the water level data collected before the actual work indicated that boreholes used for irrigation showed more fluctuation compared to boreholes used for house consumption. Based on these facts, the boreholes near the vegetable farms were selected for monitoring and sampling purposes. The analyzed quality parameters and sampling frequency are chosen carefully concerning preliminary survey results and the objectives of the study. This study focused only on eight monitoring boreholes, four of which were pumped by the motor pump and the remaining four, by rope and washer pumps. The depth of boreholes varied from 5 m (near the lake) to 12 m (far from the lake). The diameter for all monitoring boreholes was 1 m on an average. The water level in boreholes varied from 0.15 m in the dry season to 2 m in the rainy season.
Sample collection
The sampling activity was done twice per year (during dry and rainy seasons) for three consecutive years (2015 - 2017). This study hypothesized that seasonal and spatial variability affects irrigation water quality, which in turn could influence its suitability for irrigated agriculture. Hence, this study was carried out mainly to evaluate the extent of seasonal and spatial variation effects on the quality of irrigation water in the area. Eight samples were collected from eight different shallow wells during each sampling period. A total of 48 samples were collected during the entire investigation period for laboratory analysis by using plastic bottles. The bottles used for the sample collection were washed carefully with detergent to maintain the quality of the data for laboratory analysis. The bottles were filled to the top, sealed and labeled with a unique code number which was maintained throughout the laboratory analysis period to enhance the accuracy of results. The collected water samples were preserved in the icebox, transported and analyzed according to the standards set for irrigation water quality (Ayers and Westcot, 1985). The analysis was carried out at Arba Minch University Water Quality Laboratory Center.
Laboratory analysis
Analyses of physicochemical properties of the water samples were done using standard laboratory procedures. The electrical conductivity (EC) and pH respectively were determined using conductivity meter and pH-meter as suggested by Greenberg et al. (1992). Soluble cations such as Na+ and K+ were determined by flame photometer after proper calibration with combined Na-K standard solutions (RTI, 1991). Soluble Ca2+ and Mg2+ were analyzed directly by atomic absorption spectrophotometer (APHA, 1998). Chlorides (Cl-), calcium carbonate (CaCO3), carbonate (CO32-) and bicarbonate (HCO3-) ions were measured by the argentometric method by titrating against silver nitrate standard solution with potassium chromate indicator by using the procedure suggested by Greenberg et al. (1992). Similarly, phosphate (PO43-), nitrate (NO3-) and boron (B) were determined by spectrophotometric methods as described by AOAC (1990) (Table 1). Sodium adsorption ratio (SAR) was estimated by using equation 1 as suggested by Richards (1954). The concentrations of all ions in this equation are expressed in milliequivalents per liter.


Statistical analysis
Generalized linear model procedure in the statistical package for the social science (SPSS) version 16 application was used for data analysis. The general linear model of two ways analysis of variance (ANOVA) was used to determine differences among the mean of water quality parameters across seasons and locations. The mean of each parameter was compared across the seasons and sampling locations using post-hoc comparison tests. It was carried out to find the exact difference between the mean of each quality parameter across all locations and seasons. The probability level for the determination of significance was 0.05.
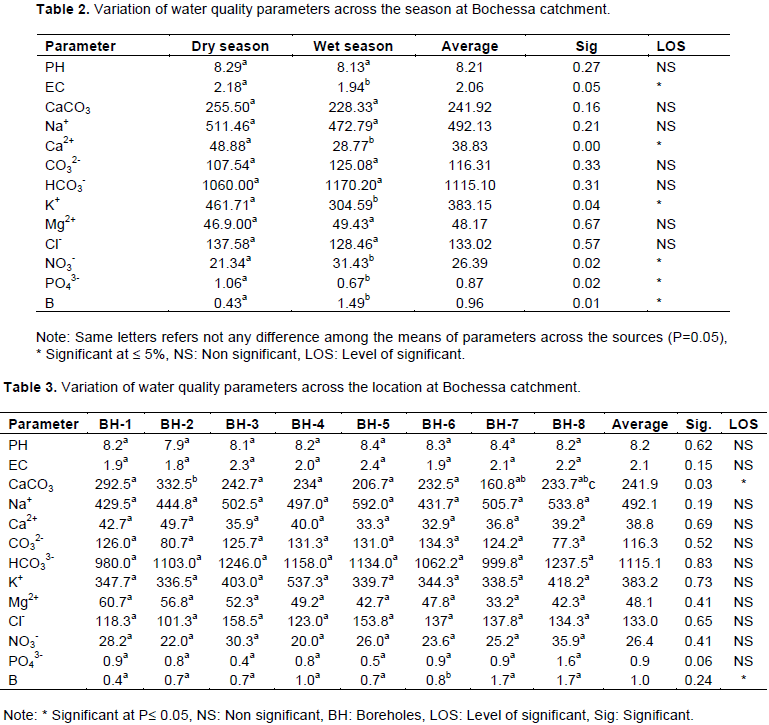
This study was conducted to assess the seasonal and spatial variations in water quality of Bochessa catchment for stallholder irrigation. The results of laboratory analysis of different parameters were recorded and the mean values were from the analysis of variance (ANOVA) for each borehole, are given in Tables 2 and 3. Graphical illustration of the variations in the trend of water quality parameters over time and distance from the lake are shown in Figures 3 and 4. The values of SAR, RSC, SSP, PI, MAR, and KR estimated using Equations 1, 2, 3, 4, 5 and 6 are given in Table 4. The results of the correlation coefficient analysis among the parameters are also shown in Table 5.
Seasonal variability of groundwater quality
Adamu (2013) and Hadera (2018) have shown that the quality of irrigation water influences soil productivity to a greater extent. Hence, the quality of irrigation water should be considered during the planning of any irrigation project. Michael (1992) and Hillel (2000) emphasized that water quality evaluation should focus at the farm level for recommending possible management options to the users. The present evaluation was done at the farm level to suggest some possible on-farm management practices. Subsequently, farmers can use it to improve management practices in irrigated fields. It may be observed from Table 2 that about 46% of water quality parameters analyzed showed significant differences at P<0.05 at all sampling periods. Moreover, about 62% of the water quality parameters showed a decreasing trend during the wet season. This implies that seasonal variations had a noticeable impact on the quality of irrigation water in the area.
The pH value during the study period ranged from 8.13 to 8.29 (Table 2). The pH was higher in the dry season as compared to the wet season. This may be attributed to the dilution effects of rainfall that was experienced in the area during the wet season. Its value during the study period remained greater than 8.00 suggesting that the water is alkaline in nature. Adamu (2013) and Reddy (2013) noted that pH is not an important criterion for irrigation, because it can be buffered by soil and most crops can tolerate a wide range of pH levels. The estimated pH values during the study period were within the permissible range. However, as the average pH value (8.21) of the water approaches the upper limit, its continuous use may have adverse effects on soil quality.
The EC values ranged from 1.94 to 2.18 dS/m (Table 2). The highest value was observed in the dry season. The EC values were within the permissible limit for agricultural purposes as compared to the standard value given in Table 1. However, the EC value was above the threshold levels for most of the vegetable crops grown in the area. Ayers and Westcot (1985) noted that different crops have different salt tolerance limits. The recommended EC threshold values for some of the sensitive vegetable crops grown in the area beans, cabbage, onion, and tomatoes vary from 0.7 to 1.7 dS/m (Ayers and Westcot, 1985). But, the level of measured salt concentration in the irrigation water was not suitable for growing these crops. The irrigation water with ECw=1.5 dS/m is not suitable for salt-sensitive crops such as beans but may be used for tolerant crops like a tomato. Therefore, the use of groundwater in the study area may adversely influence the production of salt-sensitive crops. Still, it is possible to use the water for salt-sensitive crops with strong management practices while maintaining the soil salinity within the salt tolerance limit of the crops.
Total hardness as expressed by CaCO3 ranged from 228.33 to 255.50 mg/L (Table 2). The values of CaCO3 were lower during the dry season. This might be attributed to the dilution effects created by rainwater during the wet season. Concentrations in all sampling periods were more than 200.00 mg/L (Table 2). Sawyer and McCarty (1967) recommended the CaCO3 value <75 mg/L as soft, 75 to 150 mg/L as moderate, 150 to 300 mg/L as hard and above 300 mg/L as very hard. The average measured value of CaCO3 is equal to 242.00 mg/L confirmed that the assessed water samples across the season can be ranked as hard. The measured values of CO32- and HCO3- in the water samples ranged from 107.54 to 125.08 mg/L and 1060.00 to 1170.20 mg/L, respectively (Table 2). The values were relatively high during the wet season as compared to the dry season. The acceptable ranges for HCO3- and CO32- lie between 0 to 519 mg/l and 0 to 3 mg/l, respectively (Table 1). But, the measured average values of both HCO3- and CO32- were by far higher than the acceptable limits (Table 2). Therefore, the assessed water in the area could be described as being at severe risk with regards to carbonates and bicarbonates. Abay et al. (2016) also recorded high values of HCO3- and CO32- in the area.
The measured values of calcium and magnesium ions varied from 28.77 to 48.88 mg/L and 46.90 to 49.43 mg/L, respectively (Table 2). The higher value for Ca2+ was observed in dry season while for Mg2+ the higher value was observed in the rainy season. The permissible range of Ca2+ and Mg2+ for irrigation lies between 0 to 400 and 0 to 60 mg/L, respectively (Table 1). Thus, the measured values of Ca2+ and Mg2+ for irrigation water during the study periods were within the safe limits. The values of Mg2+ remained higher than the values of Ca2+. Therefore, there may be Mg2+ related problems as it deteriorates soil structure, particularly where the water is sodium-dominated and highly saline. The concentration of sodium ion (Na+) varied from 472.79 to 511.46 mg/L (Table 2). The higher value of Na+ was also observed during the dry season as compared to the wet season. The permissible limits of Na+ for irrigation water ranged from 0 to 920 mg/l (Table 1). This suggested that the measured value of Na+ was within the safe limit and is suitable for irrigation purposes. However, its value remained higher than 400.00 mg/l and it showed high value compared to other cations during the investigation period. Therefore, Na+ concentration in irrigation water pays attention to maintain soil quality in the area. Abay et al. (2016) and Hadera (2018) also reported similar results earlier concerning to sodium ions.
The concentration of nitrate (NO3-) and phosphate (PO43-) varied considerably. The measured values across the season ranged from 21.34 to 31.43 mg/L and 0.67 to 1.06 mg/L, respectively (Table 2). The highest value of NO3- was observed during the wet season while the highest value of PO43- was found during the dry season. This might be attributed to poor farm management practices that were experienced in the area. Edossa et al. (2013) reported that farmers in the area use on average 300 kg ha-1 DAP and 340 kg ha-1 urea for irrigated vegetable crop production. This implies that fertilizers were not wisely used in the irrigated fields in the area. As shown in Table 1, the permissible range of NO3- and PO43- for irrigation water varies from 0 to 30 mg/L, and 0 to 2 mg/L, respectively. Thus, the concentration of NO3- was beyond the critical limit during the wet season and it was within the normal range in the dry season. Therefore, the use of improved fertilizer management practices at the farm level is important to reduce the leaching of nutrients to the groundwater. There is no restriction on PO43- level as far as water for irrigation is concerned. The concentration of potassium ion (K+) varied from 304.59 to 461.71 mg/L (Table 2). The concentration of K+ was very high as compared to the standard limit which is equal to 2 mg/L (Table 1). This may be attributed to the nature of the underlying rocks that are found in the area.
Other common toxic ion and elements that are found in irrigation water are chlorine (Cl-) and born (B). Their concentration across the season varied from 128.46 to 137.58 mg/L and 0.43 to 1.49 mg/L, respectively (Table 2). The value of Cl- did not vary substantially across the seasons, but the variation in B was remarkable. However, the concentrations of both components across the seasons were found to be within the acceptable limits for irrigation and are equal to 355 and 3 mg/l, respectively (Table 1). Therefore, using this water for irrigation may not result in toxic effects on growing crops with regards to Cl- and B. The overall seasonal analysis of water quality in the catchment indicated that 69% of the estimated parameters were within the acceptable limits for irrigation.
Thus the majority of water quality parameters were within the permissible levels and suitable for irrigation. Halcrow (2008) and Abay et al. (2016) also reported similar results from the same study area earlier.
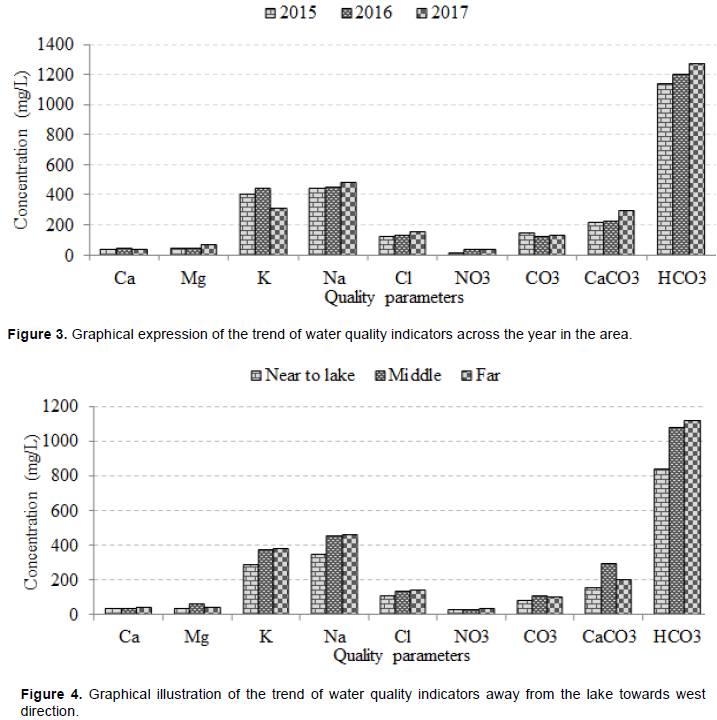
It may be observed from Figure 3 that the majority of the parameters related to water quality increased across the year. This means that the seasonal variations had considerably influenced the quality of irrigation water. However, pH, EC and Ca2+ did not show remarkable change over time. The variations in CO32- and CaCO3 with time were inconsistent. The water quality parameters which increased with time could influence the poor farming practices that existing in the area. Therefore, the practice of improved irrigation management practices is of paramount importance in the area. The use of irrigation water for crop production neglecting proper management practices could negatively affect the quality of water and soil in the catchment. Thus, monitoring the quality of groundwater across the fields at some time interval is crucially important in taking timely action to alleviate the limitations.
Spatial variability of groundwater quality
It may be observed from Table 3 that the majority of water quality parameters did not vary considerably with sampling locations. About 85% of the quality parameters were more or less the same at P<0.05 with sampling locations. This implied that chemical compositions of earth materials were by and large similar across the fields. The spatial variability did not influence the constituents of groundwater in the area. The values of pH and EC in the area are ranged from 7.90 to 8.40 and 1.80 to 2.40 dS/m, respectively (Table 3). The pH values at some locations were approaching the upper limit suggesting that continuous irrigation may influence soil quality in the area. However, the average values of pH and EC were equal to 8.20 and 2.10 dS/m respectively which were below the recommended critical limits for irrigation (8.40 and 3.00 dS/m) (Table 1). Therefore, the use of this water for irrigation will not as such adversely affect soil quality. Abay et al. (2016) also reported more or less similar findings earlier from this area.
The measured values of different irrigation water quality parameters at different locations within the catchment are given in Table 3 and the variations are shown in Figure 4. It may be observed from Table 3 that the mean values of the quality parameters followed by the same letter in the same row were not significantly different from each other. The concentration of Ca2+, Mg2+ and Na+ in irrigation water at different sampling locations varied from 32.90 - 49.70 mg/L, 33.20 to 60.70 mg/L and 429.50 to 592.00 mg/L, respectively (Table 3). The concentration of Na+ was higher than Ca2+ and Mg2+. This may cause toxicity problems following surface irrigation. The measured value of Ca2+, Mg2+, and Na+ were within the permissible ranges and the water was suitable for irrigation as confirmed by the standards given in Table 1. The concentrations of Mg2+ at different locations were relatively higher as compared to Ca2+. Therefore, there might be Mg2+ related problems on soil quality as Mg2+ makes the soil more alkaline particularly under Na+ dominated conditions (Adamu, 2013). These findings agreed with the previous findings reported by Hadera (2018) in same the area.
The concentration of common toxic ions such as chloride (Cl-) and the element boron (B) varied from 101.30 to 158.50 mg/L and 0.40 to 1.70 mg/L, respectively (Table 3). They are unlike Na+, and are essential for plant growths, but needed in small quantities only. The concentration of B varied across sampling locations while Cl- did not show such a variation. This might be attributed to farm management practices that existing in the area. Moreover, it may be observed from Figure 4 that both of these parameters showed an increasing trend along the way from the lake to intensively cultivated vegetable fields. This could also confirm as to how farm management practices influence different water quality parameters across the fields. The continuous use of fertilizers and other chemicals in such fields could change the levels of certain parameters. Concentrations of Cl- and B at all sampled locations were within the acceptable limits that are set for irrigation purposes (Table 1). Similarly, high values for both of the parameters in the same area were also reported earlier by Halcrow (2008) and Abay et al. (2016).
The value of CaCO3, CO32- and HCO3- at all sampling locations varied from 160.80 to 332.50 mg/L, 77.30 to 134.30 mg/L and 980.00 to 1246.00 mg/L, respectively (Table 3). The CO32- and HCO3- did not vary across sampling locations while CaCO3 varied significantly at different sampling locations. The values of all these parameters were high at all sampling locations during the investigation period. The concentrations of CO32- and HCO3- in irrigation water at all locations were above the permissible limit for irrigation as given in Table 1. Thus the analyzed water samples were hard and could influence the efficiency of drippers in trickle irrigation systems due to clogging effects. Therefore, checking the function of each dripper at a certain time interval is critical in improving efficiency as long as the water is supposed to be used for irrigating farmlands. The frequent use of water for agricultural purposes could have a negative influence on soil quality suggesting the use of appropriate on-farm water management practices. Similar values were also reported by Hadera (2018) in the same area with regard to these parameters.
Concentrations of nutrient parameters such as; NO3-, PO43- and K+ at all sampling locations varied from 20.00 to 35.90 mg/L, 0.40 to 1.60 mg/L and 336.50 to 537.30 mg/L, respectively as given in Table 3. Their values did not show as such any remarkable variations across sampling locations. But, in all cases, high concentrations were observed in the area during the investigation period. This might be attributed to the dominance of vegetable production experienced in the area. Such type of farming system favors intensive use of agricultural inputs which in turn could increase the concentration of such nutrients in nearby water sources (Edossa et al. 2014). Edossa et al. (2013) reported that farmers on an average used 300 kg ha-1 di-ammonium phosphate (DAP) and 340 kg ha-1 urea in the area. This also supports the above argument that emphasizes unwise use of fertilizer in agricultural fields can increase the concentration of these nutrients in nearby water bodies. This suggested that regular monitoring of water quality in vegetable production areas is essential to provide reliable information to the farmers. The average values of NO3- (26.40 mg/l) and PO43- (0.90 mg/L) were within the acceptable limit for irrigation (Table 1). But, the value of K+ was above the acceptable limit. The K+ exhibited a similar situation under both time and space in the area. The most likely factor that could cause a high concentration of K+ in the area is the nature of underlying rocks. This finding agreed with some previous results reported by Halcrow (2008) and Hadera (2018).
The overall spatial analysis of irrigation water quality parameters in the catchment indicated that about 69% of the parameters were within the permissible limits for irrigation. The rest, 31% of the quality parameters were above the permissible limits recommended for irrigated agriculture. This suggests a low degree of restriction on the use of water for irrigation in the study area. However, almost all quality parameters showed higher values across sampling points during the investigation period. The concentration of all quality parameters studied showed similar trends with seasonal analysis in the catchment. Farm management practices and the nature of underlying rocks, in general, are the most likely factors that cause spatial variability of irrigation water quality in the area.
The variations in some of the constituents of groundwater with distance from the lake in the area are shown in Figure 4. It may be observed from Figure 4 that almost all the studied irrigation quality parameters increased with the distance from the lake. This could be due to farming practices that were taking place across the fields. The intensity of cultivation, of course, increased with distance from the lake towards the west direction. The intensive farming practices require more inputs (fertilizers and other chemicals) which in turn could increase the concentration level of some of the components. Sodium and potassium were the dominant cations while bicarbonate was the dominant anion found a bit far away from the lake (Figure 4). Major cations and anions showed an increasing trend of going away from the lake. This may also confirm how farm management practices would influence groundwater quality in the area. In general, farm management practice was the most likely factor that can cause spatial variability of groundwater quality in the nearby area.
Suitability of groundwater quality for irrigation
The sodium adsorption ratio (SAR) is an index that shows the potential of irrigation water in inducing sodic soil conditions. The values of SAR were estimated using Equation 1 and it ranged from 10.20 to 17.30 meq/L (Table 4). The values were higher for all the samples. This might be attributed to the high concentration of sodium as compared to calcium and magnesium ions. Ayers and Westcot (1985) suggest that water having SAR values less than 15 meq/l is considered as fair and suitable for irrigation. It may be observed from Table 4 that the estimated average value of SAR is equal to 13.20meq/l. It was less than the critical limit. Thus, this water was suitable for irrigation. However, the SAR value approached the upper limit of suggested critical value (15 meq/L) and the continuous use of this water may aggravate the sodicity problem in the area. Therefore, regular monitoring of water quality during the irrigation season is very important to maintain soil fertility. Higher SAR values were also reported by Abay et al. (2016) and Hadera (2018) in the same area.
Residual sodium carbonate (RSC) values were estimated using equation 2. The estimated values across the sampling locations are given in Table 4 and it varied from 13.20 to 26.70 meq/L. The values of RSC were higher for all the studied samples in all sampling locations. Water with a high concentration of carbonates and bicarbonates could increase sodium hazards in the area. Higher concentrations of residual carbonates favor precipitation of Ca2+ and Mg2+. Raghunath (1987) recommended that RSC values <1.25 meq/L are considered as good, 1.25 to 2.50 meq/L are marginally suitable and above 2.50 meq/L are unsuitable for irrigation. The estimated average value of RSC in our present study was equal to 20.8 meq/L. It was higher than the recommended limit (2.50 meq/L). Therefore, the use of this water for irrigation may have a negative influence on soil quality. This also suggests that groundwater quality issues should be taken into account while planning for irrigation. Abay et al. (2016) and Hadera (2018) also reported high RSC values in the same area.
The magnesium adsorption ratio (MAR) values were estimated using Equation 3 and the values are given in Table 4. The values varied from 54.60% to 70.20% with an average of 65.80. Raghunath (1987) suggested that MAR <50% can be considered as suitable for irrigation whereas >50% are unsuitable for crop plants. The estimated MAR values in all sampling locations were higher than the limit suggested by Raghunath (1987). Regular use of this water may cause Ca2+ related problems for irrigated crops.
Soluble sodium percentage (SSP) and Kelly’s ratio (KR) are also two widely used parameters for evaluating the suitability of water quality for irrigated agriculture. Because excess sodium ion concentration in irrigation water produces undesirable effects on soil and crops. The SSP and KR values were estimated using equations 4 and 6, respectively and are given in Table 4. The SSP and KR values varied from 79.30 to 87.20% and 2.80 to 6.20, respectively. The values of SSP below 60% (Todd, 1980; Reddy, 2013) and Kelly’s ratio <1 (Kelly, 1963) are considered as good and safe for irrigation. However, the estimated values of both parameters in the study area were higher than the recommended values. This suggests that the continuous use of this water may cause sodium related problems.
The permeability index (PI) is employed to evaluate the effect of long-term use of irrigation water on soil quality. The estimated values of the PI are given in Table 4. The PI values varied from 65.60% to 77.90% in the area during the investigation period. According to Doneen (1964) water having PI values greater than 75% is considered excellent, between 25 and 75% is good and below 25% is unsuitable for irrigation. The average estimated PI value equal to 70.80% (Table 4) confirmed that the assessed water samples can be ranked as good. This suggests that irrigating the fields with the available water may not as such influence the permeability of the soil.
Correlation analysis
The Pearson’s correlation coefficient was calculated to explore the degree of relationships among the quality parameters of groundwater. The greater the value of correlation coefficient is, the better and more useful the regression variables (Patil and Patil, 2011). The results showed that certain attributes of irrigation water showed significant relation with each other, whereas others did not show any significant form of relationships among themselves. As indicated in Table 5, the EC was positively correlated with most of the irrigation water quality parameters during the dry season in the area. Strong positive correlations were observed between EC and Na+ (r = 0.66), EC and CO32- (r = 0.71), EC and Cl- (r = 0.75), EC and B (r = 0.52), Na+ and Cl- (r = 0.74), CO32- and Cl- (r = 0.55), CO32- and B (r = 0.57), Cl- and B (r = 0.64) at P<0.01 level of significant during the dry season (Table 5). Strong negative correlation coefficients were found between pH and Mg2+ (r = −0.71), Na+ and Ca2+ (r = −0.59) and Mg2+ and PO43- (r = -0.61). The result also outlined that the irrigation water quality parameters in the dry season could be correlated to a certain extent with each other.
As shown in Table 5, the EC and Ca2+ were positively correlated with most of the irrigation water quality parameters in the area during the wet season. High positive correlation were observed between pH and CO32- (r = 0.65), EC and HCO3- (r = 0.58), EC and Cl- (r = 0.70), Na+ and Cl- (r = 0.51), HCO3- and K+ (r = 0.66), HCO3- and B (r = 0.59), K+ and B (r = 0.58), NO3- and PO43- (r = 0.42), PO43- and B (r = 0.53) at P<0.01 level during the wet season (Table 5). The pH and NO3- were negatively correlated with most of the irrigation water quality parameters during the wet season in the area. The existence of strong positive correlation (r = 0.42) between NO3- and PO43- in wet season might be associated with poor fertilizer management practices. Because they did not shows such strong relationship in dry season (Table 5). Strong negative correlation coefficient were found between pH and Mg2+ (r = −0.42), pH and B (r = −0.42), Ca2+ and CO32- (r = −0.50), CO32- and B (r = −0.53), HCO3- and NO3- (r = −0.51), and K+ and NO3- (r = −0.75). Our results further illustrated that the physicochemical properties of irrigation water in the study area were independent of various quality parameters.