Full Length Research Paper

ABSTRACT
This paper explores the effects of climate variability on local communities living within and around Queen Elizabeth National Park (QENP), their coping mechanisms, and challenges encountered. Data was collected from 250 respondents through questionnaires administered to small holder farmers, salt miners, and fisher folks, as well as in-depth interviews and focus group discussions (FGDs) held with selected households in Katunguru, Lake Katwe, Kasenyi, and Kahokya parishes in and around the park. The results indicated that climate variability affects all households through long dry spells (drought), increased intensity of rain and occurrence of water related diseases. This resulted in decline in economic output in the context of reduced food availability, household incomes, and poor health of the household members. The results further showed that although diversification of livelihood activities was uniform, the coping mechanisms were heterogeneous across the three economic sectors. While the agricultural households engaged in agricultural intensification, fisher folks changed their fishing technologies, and salt miners drained their flooded saltpans. According to the findings of this study, the effects of climate variability were widespread across all households in and around the park. The study recommends that rural households be supported in a variety of activities in order to build capacity.
Key words: Climate variability, effects, coping strategies, challenges, rural households, Queen Elizabeth National Park, Uganda.
INTRODUCTION
Climate variability and change, as a major environmental threat, have become more severe as global warming continues to rise by 0.2°C per decade, especially over the next two decades (Niang et al., 2014; CDKN, 2014; IPCC, 2014). These extremes have had a global impact on crop and livestock production, food and water security, human health and safety, and thus the undisputed international recognition of our time (Harrington et al., 2018; FAO, 2016b). Climate change is evident in both developing and developed countries, for example, through changes in precipitation patterns and an unprecedented increase in temperature, all of which jeopardize livelihoods and overall socioeconomic development (Mbuli et al., 2021; Mthembu and Hlophe, 2020; Taye, 2019). These effects have been unevenly distributed around the world, with countries in the global south suffering the most in a variety of complex ways (Islam and Winkel, 2017; Acheampong et al., 2014; Chikulo, 2014). Climate-related effects on national parks, for example, are increasing due to observable changes in temperature and rainfall, as well as a continuously degrading natural environment, according to van Wilgen et al. (2016), Tadesse and Dereje (2018), and Dube and Nhamo (2020). The presence of extreme weather events such as droughts and floods means that livelihood activities are disrupted and the community is more vulnerable to further climate conditions (Kilimani et al., 2016). As a result, in order to avoid a global food crisis, there is need to actively respond to these effects.
Furthermore, some scholars argue that there are differences in the effects of climate change even within the global south, with Sub-Saharan Africa bearing the brunt of these processes (Mihiretu et al., 2019; Zougmoré et al. 2018; Arndt et al., 2015). However, the literature highlighting these processes is skewed in that much of it focuses on dry-land areas (Thalheimer et al., 2021; Marengo et al., 2020; Jellason et al., 2019) and the cattle corridor (Nimusiima et al., 2018; Mulinde et al., 2016; Majaliwa et al., 2015), despite the fact that other communities living within and on the fringes of the parks are more vulnerable due to the land use restrictions accorded to national parks (Hoogendoorn and Fitchett, 2018; Bruno et al., 2018; Malakoutikhah et al., 2020). This study fills a scholarly gap in this context by focusing on the often overlooked but critical aspect of climate variability on local communities within and around conservation areas.
Climate change dynamics in Uganda
Uganda experiences climate variability and change, with noticeable monthly temperatures ranging from a minimum of 15°C in July to a maximum of 30°C in February (Mukasa et al., 2020; Nsubuga et al., 2014a). Furthermore, there have been significant changes in heavy rainfall events (Ongoma et al., 2015; Müller et al., 2014; Mayega et al., 2015; Mugagga et al., 2019), particularly during the March to May (MAM) season (Fuller et al., 2018; Ngoma et al., 2021; Egeru et al., 2019). As a result, frequent disasters such as floods, landslides, and droughts have been observed in and around the country, negatively impacting the economy (Akampumuza and Matsuda, 2017; Müller et al., 2014; Bagonza, 2014). This raises concerns about the need to sustain communities as well as the country's ability to meet both national development goals and global obligations. Uganda is highly vulnerable to the effects of climate change due to its reliance on natural resources, with rain-fed agriculture accounting for only 22% of total GDP and limited adaptive capacity (UBOS, 2020; 2018; Cooper and Wheeler, 2017; Adhikari et al., 2015). According to the Climate and Development Knowledge Network (CDKN), Uganda loses USD 2 billion due to climate and related impacts (CDKN, 2014). As a result, communities pursuing agro-based livelihood strategies have become vulnerable to climate change. This is especially important for local communities living in and around protected areas like Queen Elizabeth National
Park (QENP), where resources are scarce.
While protected areas provide numerous benefits to local communities [regulate climate, provide cultural services such as social health, tourism, support biodiversity, and income diversification] (Mcneely, 2020; Jiricka-Pürrer et al., 2019; Jones et al., 2020), the livelihoods and well-being of rural poor who live within and on the fringes of the conservancies remain vulnerable to climate changes due to restrictions imposed by regulatory regimes that govern access to natural resources in the park. This has contributed to a decline in ecosystem diversity, productivity, and constant conflict between humans and wildlife as they compete for limited resources (Amin et al., 2015; Zwiener et al., 2017). Raids from wildlife seeking to expand their range into community-built lands frequently destroy their food crops, while enclave communities seek to explore protected areas for alternative livelihood sources exacerbates the situation (Nwe et al., 2020; Crawhall, 2015). Access to natural resources to support livelihoods becomes increasingly difficult. Policies to protect wildlife in Queen Elizabeth National Park (QENP) prevent communities from easily accessing national park resources, further limiting their livelihoods.
The current study was conducted in Western Uganda against this backdrop due to the frequent occurrence of disasters that have caused physical, environmental, and socioeconomic impacts (NEMA, 2019, 2016). The study thus sought to investigate the effects of climate variability and change on the local communities living in and around QENP, as well as how they cope with the effects and challenges they face, by seeking answers to the following questions: What are the spatial distribution and temporal trends of drought in Kasese district for the period 1981-2016? What are the effects of climate variability and change on the economic activities of the local communities living in and around QENP? In what ways do the local communities cope with the effects of climate variability? What challenges are encountered by the local communities?
Theoretical framework
The DFID Sustainable Rural Livelihoods Framework (SRLF) is used in this study to better understand how climate variability affects the local communities living in and around Queen Elizabeth National Park (QENP), how they cope with the effects, and the challenges they face. “A livelihood comprises the capabilities, assets, and activities required for a means of living. A livelihood is sustainable when it can cope with and recover from stresses and shocks, and maintain or enhance its capabilities and assets both now and in the future, while not undermining the natural resource base” (DFID, 1999). The SRLF's main argument is that access to and use of various forms of capital, including natural, social, physical, financial, and human capital, translates into better or worse livelihood outcomes for rural communities (Krantz, 2001).
However, improved livelihood outcomes are dependent on people's abilities to use one or a combination of capitals and successfully navigate government policies, institutional rigidities, and societal cultures. Policies, institutions, and cultures are significant because they influence access to capital; 'mediate' the terms of capital exchange, and determine the gains from the livelihood strategies employed (DFID, 1999). The ability or inability to negotiate the numerous obstacles creates either ‘winners’ with better or ‘losers’ with worse off livelihood outcomes (Chambers, 1983).
In the context of this study, the local communities living in and around Queen Elizabeth National Park (QENP) are gifted with ‘natural capital’ (land, wildlife resources and lakes (Edward, George and Katwe), where salt is mined). The park contributes to maintenance of the ecosystem and provides biodiversity from which the local communities derive economic and health benefits (Atiqul Haq, 2016). The local communities have social capital in form of relations and networks. UWA gives the local communities 20% of the money collected from tourists as financial capital. Regarding human capital, the local communities use their inherent knowledge and skills to exploit the natural resources/capital. These in totality, when well utilized, should translate better livelihood outcomes for the communities within and around the park, more incomes, increased well-being, reduced vulnerability, and improved food security. Those who are unable to fully exploit the resources (natural, financial, physical, social, and human) live in poverty. This means that better or worse livelihood outcomes are determined by how local communities use the capitals at their disposal, as well as how they navigate structural rigidities imposed by the government or societal structures. As a result, the SRLF can aid in the holistic analysis and explanation of the environmental and socioeconomic dynamics of climate variability in the context of conservation, particularly within and around Queen Elizabeth National Park (QENP).
MATERIALS AND METHODS
Study area
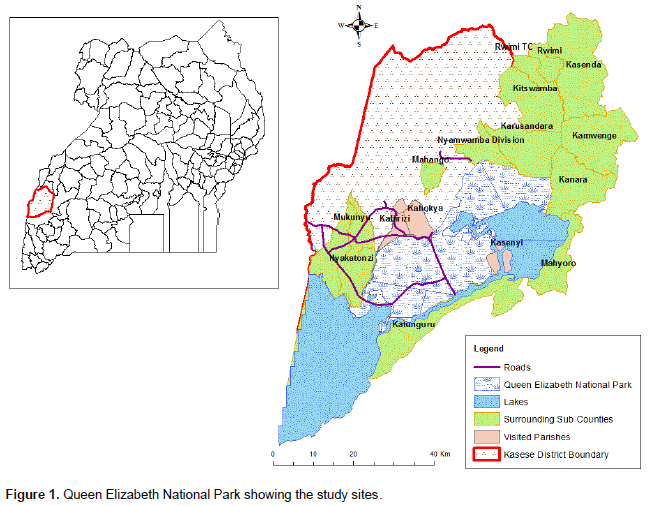
Queen Elizabeth National Park (0° 12’S and 0° 26N Latitudes and 29° 42’E and 30° 18’E Longitudes) is located in Kasese district in Western Uganda (Figure 1). The park has a diverse ecosystem that includes savanna and grassland, wetland, lake, and riverine systems (NEMA, 2019, 2016). There are two rainy seasons experienced in the area; the first rainy season occurs during March, April, and May (MAM) while the second rainy season occurs during September, October, and November (SON), with mean annual temperature between 22 and 25°C and total annual rainfall of 1250 mm (Mugume et al., 2016). Variation in rainfall is due to its location along the equator and annual migration of the Inter Tropical Convergence Zone (ITZC) (NEMA, 2019; Mugume et al., 2016). The human population around the park is estimated to be 107 persons per km2, with a district population of 702,029 people (UBOS, 2014). The major social-economic activities include subsistence farming involving crop production, livestock rearing, fish farming (in Lakes George and Edward and Kazinga channel), as well as bee keeping, tree growing, petty trade and salt mining around Lake Katwe and Kasenyi (UBOS, 2020).
Selection of study sites and respondents: Household surveys
The information from the Kasese District Local Government and Community Development Officer (CDO) indicates that specific places conduct specific activities. In light of this discovery, the study purposefully chose three study sites involved in farming, salt mining, and fishing (Table 1). Several key government reports sought do not provide information on the number of households engaged in the three dominant activities across the study area. Therefore, to obtain an appropriate sample, this paper uses the guidance provided by Mensah (2014). Since the number of participants in each of this activity was unknown, the sample size was derived by computing the minimum sample size required for accuracy in estimating proportions by considering the standard deviation set at 95 confidence level (1.96), percentage picking a choice or response (50%=0.5), and the confidence interval (0.05= ±5) (Mensah, 2014). The equation is:

Where z= standard deviation set at 95% confidence level, p=percentage picking a choice of response, and c=confidence interval.
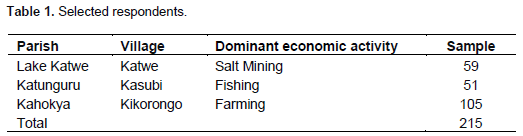
Although a total of 250 respondents were randomly selected from communities in and around Lake Katwe, Katunguru, and Kahokya parishes, 215 copies of the questionnaires were filled out and returned, representing 86% response rate.
Data collection
This study used both primary and secondary data sources to better understand the effects of climate variability on local communities, their coping strategies, and the challenges they face.
Primary data
The study was undertaken from June, 2017 to January, 2019, and data was collected from the local communities living in Kasenyi, Katunguru, Lake Katwe, and Kahokya. The study period [2017-2019] was chosen in light of the numerous processes that occurred during this time period, including severe reports of communities affected by drought episodes, land conflicts and violence, and reprisals (Reuss and Titeca, 2017; US Bureau of Demography Human Rights and Labour, 2017). Based on the nature of the research, multiple data collection methods and tools were used for data collection. The mixed approach was well-suited for providing critical insights into multiple view points of the research problem (McKim, 2017; Molina-Azorin, 2016a; Norma and Ngulube, 2015). These included household survey, semi-structured interviews and focus group discussions (FGDS) to solicit information on effects of climate variability, coping mechanisms, and challenges faced by the local communities. The pretesting of the survey questions and interview guide was intended to confirm the questionnaire's reliability and validity before distributing it to the communities. Purposive sampling was used to select the key informants such as local village and parish leaders (3), Sub County Community Development Officers (1), officials from Katwe Information Centre (KIC), and District Environmental and Fisheries Officers (2). The information collected included effects of climate change, coping strategies, challenges faced by the local communities and any observed changes in the community as well as cross validating the information provided by respondents during the household survey and focus group discussions. Similarly, FDGs were used to elicit experiences that may not have been revealed during the administration of questionnaire interviews. Specifically, six focused group discussions (FGDs) comprising an average of 16 persons (an almost equal representation of male and female) of different age categories were conducted in the selected communities to validate the information from the questionnaire survey. The respondents to the focus groups, who were chosen with the help of the local council chairpersons, discussed the effects of climate variability, coping strategies, adaptive options, and challenges encountered.
Secondary data
Historical daily rainfall and temperature data for the period 1981-2016 were obtained from the Uganda National Meteorology Authority (UNMA) in the Ministry of Water and Environment and quality controlled using World Meteorological Organization (WMO) guidelines to understand both seasonal and annual trends. Furthermore, published articles were obtained from the internet (Google scholar) to support the study findings.
Data analyses
The household survey questionnaire responses were coded, and the results were entered into the Statistical Package for Social Scientists (SPSS) to generate a data file that generated descriptive statistics in the form of graphs, tables, and the Chi-square test for significance, which were then presented.
Qualitative data from focus group discussions and interviews responses was transcribed on a daily basis to ensure that all the data was well captured. A critical synthesis of the transcribed data was carried out and this permitted the assignment of codes to the data. Considering that the research was guided by four research questions (RQ), the codes assigned to the data took the form of RQ1, RQ2, RQ3 and RQ4. Whenever a section of the transcribed data was applicable to a specific research question, that specific transcript was assigned a relevant code, copied, and pasted under the related research question. After coding all the data, another round that entailed familiarization with the coded and categorized data was undertaken. Coding and categorization of data based on research questions made it possible to generate themes which, in turn, formed the basis for deriving the meanings from the data, what Silverman (1998, 2021) termed as content analysis. The transcribed responses were then presented in the form of analytical discussions and quoted verbatim where appropriate.
To perform seasonal and annual rainfall and temperature trends, the daily rainfall and temperature data were analyzed using Mann Kendall and simple linear regression analysis with graphical methods (that is, a line graph) to illustrate the temporal trends of the time series of rainfall and temperature accordingly. Regression method was used because only weather data at weather station level (point data) was available. Furthermore, linear regression is a popular parametric method for analyzing the trend of climate variables. Other formats, such as gridded data, were not available for the study area, where other methods, such as spatial maps, would have been used. Drought indices were generated using climpack2 and temporal trends using R software. This study considers the simple linear model equation:
yˆ i = a + bx i
i = 1, 2,..., n
Where X is the precision independent variable, a is the y-intercept, and b is the slope of the line.
RESULTS
Demographic characteristics of the respondents
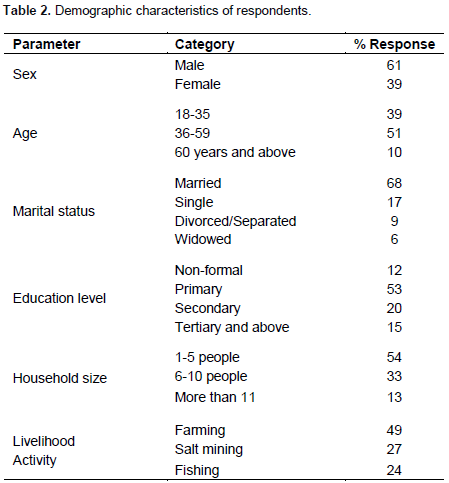
Table 2 presents the demographic characteristics of the 215 households surveyed. According to the study findings, 61% of respondents were males, while 39% were females. The majority of respondents (49%) engaged in farming (crop production and livestock rearing), salt mining (27%), and fishing (24%). This finding is consistent with the traditional nature of rural livelihoods (Verner et al., 2018; Food and Agriculture Organization of the United Nations (FAO), 2018). The age distribution of the respondents revealed that a significant proportion (39 and 51%, respectively) fell within the categories of youth (18-35) and adult (36-59), which is within the productive employment age of active service. Only 10% were old people of 60 years and above. The average household size was 6 persons with majority (54%) having 1 to 5 persons. According to the population census, 2014, the total mean household size for Uganda is 5 persons which is the same for Kasese district. The reason behind the large house size is that it has a significant influence on household adaptation to climate change as proved by several researches (Molina-Azorin, 2016b; Opiyo et al., 2015; Opiyo, 2016). Findings also indicated that the levels of education were unevenly distributed with 53% of the household heads having received primary education. This means that they are in position to understand the study problem. While 20% had received secondary and 15% tertiary level, 12% had not received any form of education or qualification. According to UBOS, while primary education has increased from 8.5 million in 2013 to 8.8 in 2017 million, secondary school enrolment has reduced. Poverty was ranked highest by the respondents in the focus group discussions as the greatest causal factor for the variations in education attainment which led to early marriages and its resultant effects.
Primary sources of data
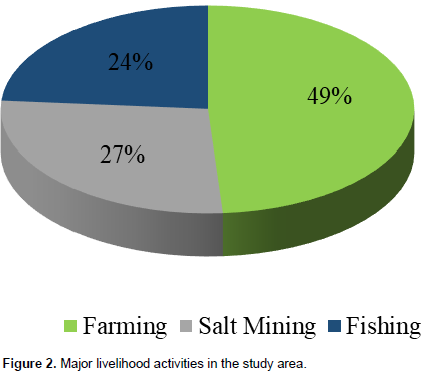
Livelihood activities
In the study area, the most common livelihood activities in order of importance are as shown in Figure 2. Farming (49%) shaped and informed by natural (land) and human (knowledge and skills) capital was primarily practiced in Kahokya parish. Moreover, salt mining (27%), which is heavily dependent on inherent skills and knowledge, was carried out at Lake Katwe as well as Kasenyi, and fishing (24%) was carried out in Katunguru parish on Lakes Albert, George, and the Kazinga channel. Traditionally, rural livelihoods are based on crop production and rearing of livestock as the dominant sources of livelihoods though supported by other economic activities such as trade and casual labour (UBOS Statistical Abstract, 2017).
Drought characteristics in Kasese district
Spatial patterns of drought
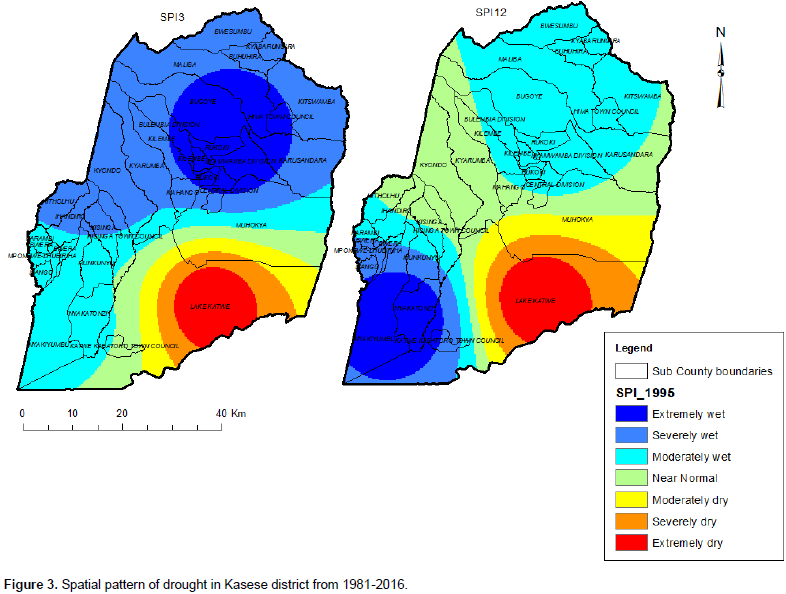
Spatial results indicated that the district suffered extreme drought conditions in 1995 mainly under SPI12 compared to SPI3 (Figure 3). During key informant interviews (KII) and focus group discussions FGDs), it was confirmed that salt miners experienced high salt production in 1995 due to the long dry spells that occurred. It was discovered that the South Eastern part of the district (areas around Lake Katwe) experienced more drought conditions than other parts of the district. This implied that the drought was both a boon for salt miners and a burden for farmers
and fishermen. For salt miners, it meant less water in the lagoons where the salt is mined, which resulted in higher household incomes due to the sale of more salt. Meanwhile, farmers and fishermen paid a price in lower household income as a result of the drought, which reduced available water for farming and fishing.
Temporal trends of drought
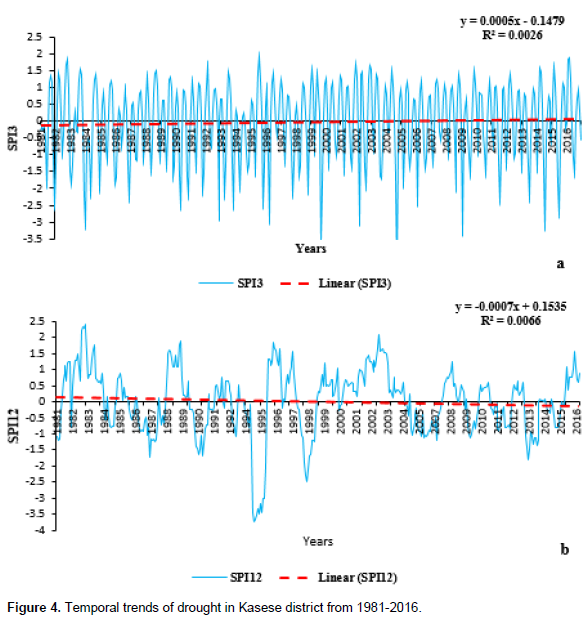
Results on temporal patterns indicated that there was a general increasing positive trend under SPI3 with extreme dry conditions observed under 1984, 2000, 2004, 2009 and 2014 (Figure 4a). This implied a reduction in dry spells under SPI3, although the trend is not significant. On the other hand, a decreasing trend was observed under SPI12 though the trend is not statistically significant (Figure 4b). Generally, the trends in drought occurrences are not significant which implies that the district still experiences drought conditions.
Drought magnitude
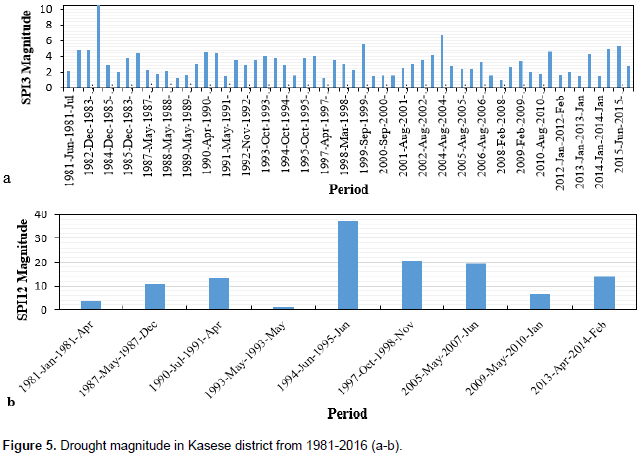
The study went on to look into the severity of the drought in terms of magnitude. According to SPI3, the highest drought magnitude of about (-10.5) occurred around (1983-December to 1984-June) and lasted seven months, followed by the drought event of 2004-August to 2004-October with magnitude (-6.7) and lasted about three months (Figure 5a). However, the drought event of 2004-August to 2004-October had the highest intensity of about -2.2 implying a much negative impact on the livelihood activities. For SPI12, it was observed that the highest drought magnitude of about (-37.4) happened at 1994-June to 1995-June and had a duration of thirteen months, followed by the drought event of 1997-October to 1998-November with magnitude (-20.5) with duration of about fourteen months (Figure 5b). For the entire study period, SPI12 (-2.9) had the highest drought magnitude, duration, and intensity, implying a greater impact on water resources.
Rainfall variability
Monthly rainfall variations
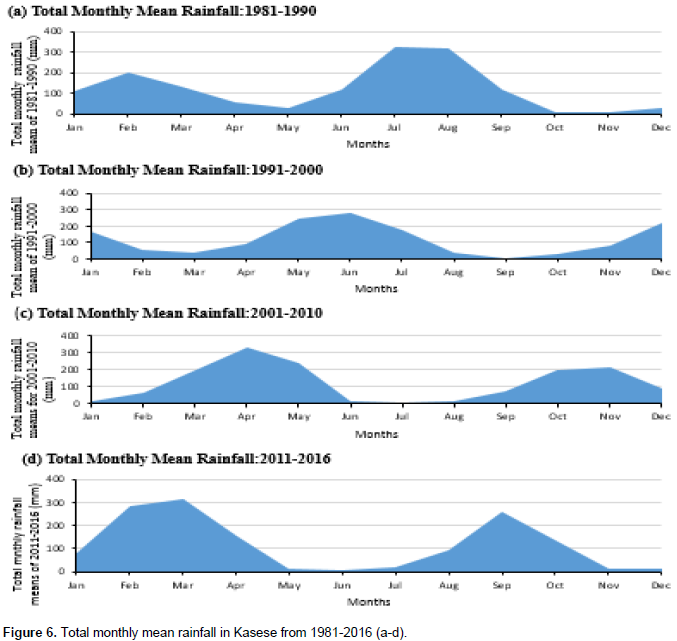
Monthly averages were calculated from 1981-2016 per decade (Figure 6). Results indicated a shift of the two rainy seasons from the known wet months to the known dry months in the first two decades 1981/1990 and 1991/2000 (Figure 6a-b). In the study area, however, there was a clear distinction between the wet and dry seasons (Figure 6c-d), resulting in a known bimodal rainfall pattern.
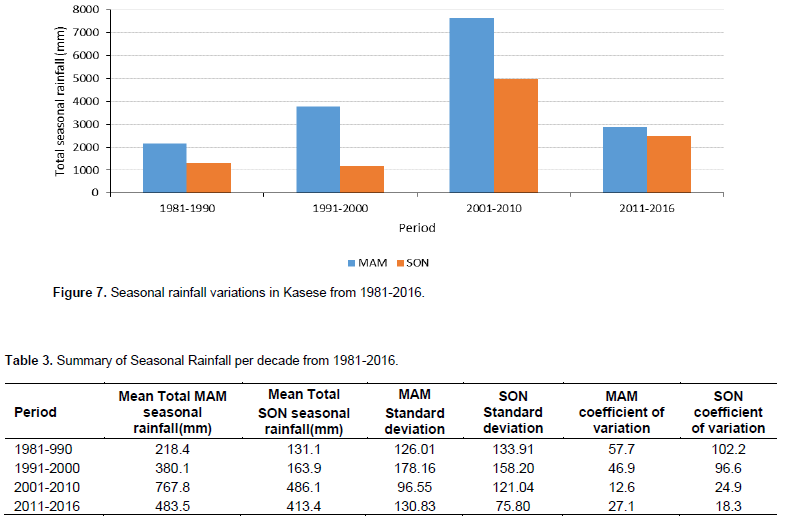
Seasonal rainfall variations
On a decade basis, it was revealed that the MAM total seasonal rainfall throughout the study period registered the highest amount of rainfall compared to the SON seasonal rainfall (Figure 7). Overall, seasonal rainfall has been increasing, with the period 2001-2010 recording the highest score. The coefficient of variation values calculated per decade from 1981 to 2016 (Table 3) revealed that SON seasonal rainfall was less predictable than MAM seasonal rainfall. This was due to the high variability in rainfall amounts during the SON period.
Climatic shocks faced by the local communities
Changes in the biophysical environment were considered shocks in this study because they impacted agriculture, salt mining, and fishing, despite the fact that there are six major weather variables (temperature, precipitation, cloudy (type and cover), wind (speed and direction), humidity, and air pressure).Government agencies such as Uganda National Meteorological Authority (UNMA) emphasizes rainfall and temperature and their manifestation as the most important variables in the field of climate sciences to help trace extent and magnitude of climate variability and change (IPCC, 2007). As a result, the study focused on rainfall and temperature because the study area is heavily reliant on rain-fed agriculture, and these variables assisted in explaining various socioeconomic problems. Figure 8 depicts the climatic shocks that the community has experienced.
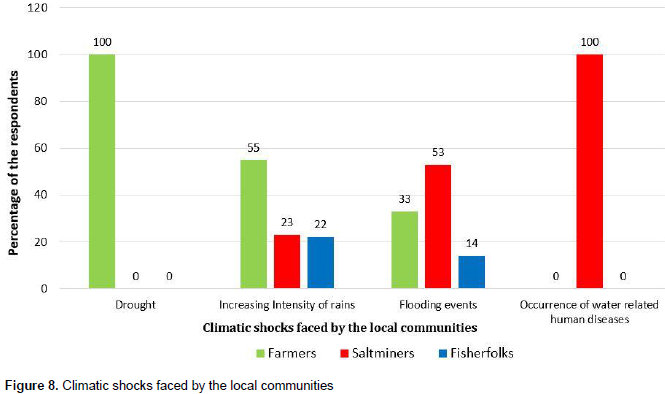
Across the livelihood activities, the study findings revealed that flooding events, occurrence of human diseases, increasing dry spells/drought, and increasing intensity of rains were the most noteworthy climatic shocks across the livelihood activities. However, reduced flooding events (53%) and occurrence of water related human diseases (100%) were outstanding among salt miners while increasing intensity of rains (55%) and dry spells/drought (100%) were outstanding among the farmers. Likewise, increasing intensity of rains (22%) and reduced flooding events (14%) were outstanding among fisher folks.
The aforementioned responses were confirmed by the focused group discussions and key informant interviews conducted. For instance, salt miners observed that 1995 as the year where salt production was highest due to reduced flooding events and intense rainfall. Furthermore, outbreak of water borne diseases like cholera and bilharzia were common as well as severe skin irritations due to constant contact with water. On the other hand, farmers revealed that it was common for crops to dry due to the increasing long dry spells and as a result, crop yields harvested were reduced. The fisher folks complained of increasing intensity of rains that swayed their boats away.
Effects of climate variability on economic activities of local communities
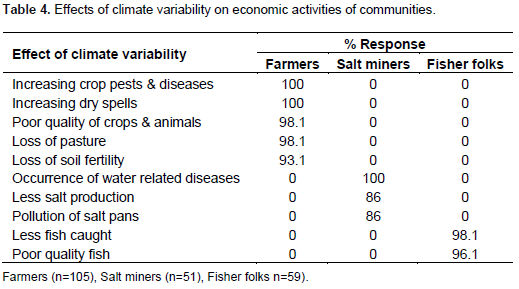
Understanding the effects of climate variability on economic activities of local communities is important because livelihoods in and around Queen Elizabeth National Park are highly dependent on natural resources that are vulnerable to changes in climate. Findings revealed that farming respondents experienced increasing dry spells, crop pests and diseases (100%), respectively, severe loss of pasture (98.1%), poor quality of crops (98.1%) and loss of soil fertility (93.1%). During the focus group discussions (FGDs), farmers noted that the destruction of crops due to longer dry periods coupled with a mere absence of buffer stock to handle demand led to scarcity of food. Loss of pasture meant that some families were compelled to sell off their animals at lowest prices while loss of fertility meant that the outputs from the gardens were minimal and this affected the food consumption patterns of the households. Yet output from the market was central in purchasing the essential inputs which the family lacked.
‘A 35 year old man and father of 8 indicated that climate variability and change has and continues to significantly reduce his household income. In 2006, the respondent noted that, his family often obtained 2,000,000 million shillings (equivalent to 577 USD) from farming. The money was often used to pay school fees for the primary and secondary going children, buy farm input and other basic foods not produced at home. In 2017, however, the respondent explained that due to unpredictability of seasons, his farming was worth 500,000 Uganda shillings (120 USD) which constrained the ability of the household to pay school dues and buy farm inputs’.
The fishing community experienced less fish caught (98.1%) and poor quality of fish (96.1%). The District Fisheries Officer attributed the reduction in the quantity of fish in the lake to a number of factors. Firstly, the reduction of water levels, secondly, continuous movements of fish habitat, and thirdly, encroachment of the breeding zones as result of changing climate. The reduced water levels and poor quality of fish forced fisher folks to encroach on the breeding zones of the fish at the deeper ends of the lake. In the process, the breeding areas were destroyed which reduced the quantity of fish caught.
‘One of the fishermen interviewed said that the quantities of fish had reduced. For him to capture fish, he uses different hooks called “Egyala". As opposed to the period before the reduction in water levels, he claimed that he now catches less than 200 fish yet fifteen years ago he could get 2000 fish per week. The Fisheries Officer confirmed that fish such as “Labeo” was common during the rainy season but had disappeared due to the prolonged dry season and could only be found in deep waters. One police commander also confirmed that some fishermen had been caught fishing in the breeding area and were taken to court and charged’.
Among the salt miners, all the respondents experienced water related human diseases (100%), less salt production (86%) and pollution of salt pans (86%). The effects of climate variability on the socio-economic activities of the local communities living in and around QENP are presented in Table 4.
‘A 39 year old mother of 7 revealed that she has been working in the salt pans for 20 years but has noticed reduction in water levels during the long dry spells. In addition, the key informant at KATIC stated that the area was faced by scarcity of and safe water. He further explained that River Nyamugasani was about 4 km away to the treatment plant which was broken and rusty rendering the water unsafe for human consumption while the asbestos iron sheets used by residents were dangerous for water harvesting’.
Coping strategies by the households
Coping strategies of farmers, salt miners and fisher folks take three forms: on-farm activities, off-farm and non-farm. First, there were various on-farm coping strategies adopted by the respondents as presented in Figure 9. Among the farmers surveyed, about 47.8% said they planted improved crop varieties, changed planting dates, and practiced mixed cropping. 46.3% of respondents practiced rotational grazing in order to cope with the drought conditions, while 43.9% planted cover crops and 42.4% practiced mulching in an attempt to retain soil moisture. 25.9% applied fertilizers, 23.4% used compost manure and 20.5% sold off some of the animals. Those farmers who opted to move to areas outside the park were only 3.9% while those who practiced shifting cultivation and accessed park resources were 3.4%.
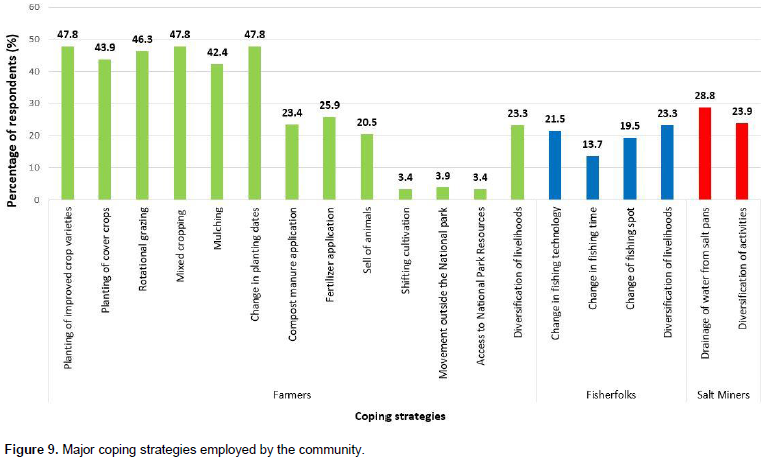
On the other hand, fisher folks had their own coping mechanisms aimed at reducing the impact of poor quality and quantity of fish. 21.5% of the fisher folks had changed fishing technology (gear), 19.5% changed fishing spots while 13.7% changed the fishing time. To reduce the impact of less salt production and pollution in salt pans during the heavy rainy seasons, 28.8% of salt miners reported draining of water from salt pans. 23.9% of respondents across the three livelihood activities diversified into other livelihood activities. During the key informant interviews and focus group discussions, it was confirmed that the aforementioned strategies were being carried out at different levels.
Second, with regard to off-farm, there are often temporary shifts in livelihood activities by households in order to cope with the severity of impacts and economically sustain the households. During focus group discussions, it was stated that salt miners shifted to fishing or farming during the rainy seasons and when mining became a health risk, while salt miners (women) only shifted to agriculture. Among the fishing communities, majority of fisher folks resorted to salt mining with only a few farming far away from their home parishes. Likewise, the agriculturalist ventured into salt mining or fishing.
Third, for non-farm activities, households adopted various informal activities that cut cross the three livelihood activities. The activities included petty trade, saloons, food vending, casual laboring, produce trading and charcoal selling. In respect of specific livelihood activities but not limited to, fisher folks (men) were reported to be engaged in ‘boda-boda’ riding, local drivers for tourists, local mechanics (repairing bicycles, boats, cars, motorcycles, etc.) and car wash while the women fisher folks were into small businesses such as food vending around fishing sites, fish trading, charcoal selling, papyrus harvesting and mat weaving, selling of pancakes and fried fish supported by salt mining to a less extent. Male farmers were said to be involved in community development activities, retail business such as bar pubs and informal savings and credit cooperative organization (SACCOs). Women farmers were particularly more involved into petty trade, casual laboring and fish trading. Whereas male salt miners were said to be tour guides and traders especially in salt trading, women salt miners were into petty trade, fish trade and limited mat weaving. In-depth interviews from Lake Katwe Tourism Information Centre (KATIC) confirmed that local salt miners were often trained as tourist guides and cave farmers.
Challenges faced by the local communities
Price fluctuation
According to the study respondents, fluctuation of prices
was dependent on season across any livelihood activity adopted. For instance, during the dry season, fish prices were higher due to reduced fish catch while salt prices were lower due to higher competitive production. Similarly for farmers, the prices of their farm products were dependent on the outcome of the seasons. Long dry spells or drought reduced productivity and quality thus affecting the prices of final produce.
Market for products
The market for finished goods was a common constraint for farmers and salt miners. According to the findings of the salt miners, the salt factory in the area had collapsed, resulting in competition with neighboring countries. Focused group discussions (FGDs), for example, revealed that Ugandan products were not allowed onto the Kenyan market due to poor quality, paving the way for Kenyan salt on the local market. Due to a lack of storage facilities, salt miners were forced to sell at a discount to traders, particularly those from Kenya and the Democratic Republic of the Congo who paid in advance.
Infrastructure
Most respondents argued that the poor development of the roads had hampered business especially during the rainy seasons. For instance, the access road that led to Kasenyi landing site was small, narrow, and only allowed one vehicle at a time. Most often, during the rainy seasons, the off-loading trucks were stranded for days especially during the rainy seasons. In-depth interviews revealed that Boda boda (motorbike) transport cost Uganda shillings 20,000 (?5 USD) to Lake Katwe while hiring a motorbike was Uganda shillings 80,000 per day (?21 USD). This was so expensive for an ordinary rural person that most people often used off-loading trucks as a means of transport.
Limited start-up capital/funds
Majority of respondents revealed that only a few managed to diversify from their primary livelihood activities due to limited start-up capital. For instance, only 12 of salt miners were able to join fishing or farming. Responses from the focus group discussions showed that there was a specific number of people registered for fishing for each recognized landing site. The activity, operated by law, required a significant amount of start-up capital including license costs of Uganda shillings 200,000 (?50 USD) per boat per year. The fisher folks lamented that the license costs were high and involved a lot of bribery.
The salt miners (women) could only shift to agriculture as fishing was forbidden and expensive for them. The prices for renting land varied with an increment if the proceeds/harvest were good. However, most of the men were not willing to hire out land. Likewise agriculture was a no-go zone for the fishing community due to the land restrictions accorded to national parks and the lack of land itself. Many fisher women could not own land or even access it through their husbands. Shifting to salt mining had its financial constraints as well especially for women who had less or no incomes. The incomes generated from these activities were minimal yet startup capital was high. On average, most respondents resorted to intensification of their primary livelihoods regardless of the expected impacts.
Animal invasion
Invasion by park animals and cattle was reported as a common occurrence to the farmers and confirmed by key informants. Due to shortage of food availability and loss of pasture, park animals as well as cattle wandered for forage and ended up destroying people’s crops both in the dry and rainy seasons. As a result, some people resorted to killing of the animals. This meant that drought resistant crops allergic to the park animals or wandering cattle were required.
Inadequate land and land use issues
The majority of respondents saw the park as an impediment to accessing their agricultural land. Specifically, the salt miners reported that communities were evicted from the park and land confiscated way back in the 1950s. However, according to reports from Uganda Wildlife Authority (UWA), the park was first gazetted in 1952 as Kazinga National Park and then renamed in 1954 to commemorate Queen Elizabeth II’s visit to Uganda. In the selected parishes, respondents agreed that the fisher folks in Katunguru parish were the most affected because they were not permitted to carry out agriculture and also had no available land. Farmers considered land conflict as a serious management threat and complained of sharing the limited land with migrants and displaced persons. Case in point were the Basongora-cattle keepers who previously stayed in Busongora and left in the late 1998s in search of pasture in Democratic Republic Congo but were later evicted from the Viringa National Park in Eastern Democratic Republic Congo and returned home. For survival of their large herds of cattle, the herdsmen have resorted to mobile grazing. The outcome has been conflicts between cattle owners or other land users, farmers, park managers, and competition between humans and animal demands or needs. Likewise, in Nyakatonzi sub-county, pastoralists have turned to the national park as a grazing area since all the pasture in the area has dried up.
Environmental degradation
Respondents across the three livelihoods stated that environmental degradation was a major challenge to coping and adapting to climate variability. This was mainly caused by the increasing population which created excessive pressure on the limited available land. For instance forests were cut down to clear land for agriculture while fragile ecosystems like swamps were reclaimed for unplanned settlements and papyrus harvesting among the fisher folks. Among the salt miners, one key informant at Lake Katwe Tourism Information Centre (KATIC) revealed that numerous materials such as pegs, poles for demarcation of different pans and Apachi’ (tree logs) were required from the park for the salt pans. These tree logs which were smuggled from the national park, once cut were not replaceable yet they were being substituted every six months. Other factors such as extreme climate events like drought and floods contributed to environmental degradation which in turn caused poverty and the reverse.
DISCUSSION
This paper provided an understanding of effects of climate variability on local communities living in and around Queen Elizabeth National Park, Uganda. The paper showed that changes in rainfall amounts and patterns are bound to influence cropping seasons and yields for particular crops further reducing flexibility of existing assets and hence output and consumption irrespective of the activity pursued by a given household (Mudelsee, 2019; Nsubuga and Rautenbach, 2018). This is reflected in the climatic shocks experienced among the farmers, fisher folks, and salt miners including drought, increasing intensity of rains and occurrence of water related human diseases. The observations from the current study imply that protected areas like Queen Elizabeth National Park are affected by changes in climate and that the effects increase the severity of the above listed climatic shocks in the national park (Misrachi and Belle, 2016; Rwenzori Region Agriclture Sector and Profile 2020). For instance, the increasing intensity of rains that usually cuts off trade routes, makes it difficult for the vehicles to navigate through. Equally, other studies too, indicate that the closure of major roads and inaccessible communities, damaged bridges and disrupted mobility and delivery of services are evidence of climate related events such as increased intensity of rains resulting in high transaction costs (Cooper and Wheeler, 2017; CDKN, 2014). Given that the majority of rural communities practice subsistence agriculture and fishing, most farm produce and fish cannot reach the market on time. The results of this are losses arising from spoilt perishable produce and fish, limiting incomes for other basic needs of life like nutritional foods, descent accommodation, education, clothing and medical care of entire households. Therefore, shortage of food and reduction of household incomes has a significant impact on household livelihood security and survival.
In the same way, several studies by Katutu et al. (2019) and Diem et al. (2017), Mulinde et al. (2016) and Bagonza (2014) revealed that drought is a very severe event in Africa that harms food crops and reduces crop yields like maize, sorghum, millet and rice, causes loss of pasture and soil fertility, poor quality of crops and animals; hunger, poverty and increasing incidences of diseases as evidenced in the study area, which all lead to decline in the economy. In addition, warmer climate is known to affect fishing in coastal and aquaculture systems, and causes a decline in crop production, particularly in maize (Adhikari et al., 2015). The reduction in water levels affected multiplication of fish leading to less fish production. This was confirmed by the annual drought timescale (SPI12) that indicated high intensities of drought in the area. According to Dube and Nhamo (2020), the increase in temperature, decline in rainfall and/or fluctuation in water flow levels pose a potential threat to wildlife and may undermine future tourism operations and activities.
On the contrary however, some fisher folks believed that the quality of fish was dependent on the size of the fishing nets and fish tended to migrate to better breeding grounds because of the prolonged dry spells and drought. Those that remained had to compete among themselves for survival resulting into production of poor-quality fish. With the reduction in stock, fisher folks tended to use illegal fishing gear (that which catches fish of a small size) in order to increase the stock in terms of quantity. According to UNMA (2020), Kasese experiences higher temperatures due to the effect of equator and being located in the lee ward side of the mountain which contributes to the severity of droughts. Across the country, a general warming (1–3°C) as well as a decreasing rainfall trend (of 11%) in agreement with other future projections implies long-term droughts and occasional flooding (Acheampong et al., 2014).
Households, like those in other studies, have adopted innovative responses to mitigate the severity of climate variability. These include the use of improved crop varieties, changes in planting dates, migration, and off-farm activities (Zizinga et al., 2015; Rusinga et al., 2014); mulching and mixed cropping (Mubiru et al., 2018); and the application of fertilizer and compost manure (Alemayehu and Bewket, 2017; Fadina and Barjolle, 2018). Others are planting deeper into the soil, increased weeding, and changing the timing of land preparation (Umunakwe et al., 2015); food storage, livestock maintenance and laboring (Cooper and Wheeler, 2017); water conservation (FAO 2016a); rotational grazing and livelihood diversification (Kihila, 2018). Also, crop sales, petty trade, baking saloons, tailoring, formal employment and welding (Bagonza, 2014) are other coping strategies. Additionally, to address climate change effects among fisher folks, majority of the fisher folks had adjusted the fishing time, shifted to new areas, changed the fishing technologies and target species, sell of fishing assets (Raemaekers and Sowman, 2015; Limuwa, 2018; Musinguzi et al., 2016; FAO, 2016a; Mnimbo et al., 2017), all of which were in line with the study findings. While the use of the 41/2 inch fishing net was recommended by government, fishermen claimed that it limited the quantity of fish caught and entangling of nets was common. Change in the fishing spot was a good strategy though not sustainable since it destroyed the breeding grounds for the fish. Therefore, to regulate unnecessary fishing, nets were set in water around 4pm in the evening and got around 5am in the morning. Casual laborers were hired to drain the salt pans once a week during the rainy seasons but the costs were higher compared to the overall cost of packed salt. To demand accountability and lobby for appropriate action to improve their livelihoods, female salt miners, through efforts of National Association of Professional Environmentalist (NAPE) formed the Katwe Women Salt Miners Association in Uganda, a community-based association for the protection of natural resources.
There was a broad consensus that local communities faced multiple challenges. For instance, among the fisher folks and farmers, lack of sufficient storage facilities led to high losses of revenue due to price fluctuations. Similarly, Lam et al. (2016) found that global fisheries revenues fell by 35% as a result of the projected decrease in catches by the 2050s, which increased low-value fish and decreased catches. Climate change scenarios influenced market and price outcomes in agriculture (Masud et al., 2015; Cooper and Wheeler, 2017).
CONCLUSION
The study found that climate variability has a significant impact on livelihood activities, reducing livelihood options. The effects on the dominant activities of the local communities living in and around Queen Elizabeth National Park varied due to the nature of livelihood activities and adaptive capacity. Climate variability causes an increase in dry spells and/or drought, as well as an increase in the intensity of rains, all of which contribute to an increase in crop pests and diseases, as well as a loss of pasture and soil fertility, resulting in poor quality crops and animals, particularly among farmers. The fishing community experienced decreased fish production and poor-quality fish. While the salt miners experienced decreased salt production, pollution of salt pans, and the occurrence of water related human diseases. The resultant severe food shortages, reduction in household incomes, and poor health conditions at the household level, contributed to food and household livelihood insecurity. The most common coping strategies and adaptation options practiced by household members included agricultural intensification, draining of salt pans, and change in fishing technology, time and spot and livelihoods diversification. Regardless of the various forms of capital used to cope, the challenges faced are outside the control of the local communities, which further constrain the local communities.
RECOMMENDATIONS
The recommendations in this chapter are based on the study's findings. Based on farmer complaints about fake fertilizers and drought-resistant seeds, the provision of agricultural officers or extension workers will be critical. Rainwater harvesting should be promoted in communities. To prevent animals from destroying community crops, buffer zones or control methods should be established between the park and the farms. There was a need to build surplus storage facilities and provide necessary equipment. The local community can access a portion of the gate fee through a revenue sharing program for community projects. Formation and revival of cooperative societies or Savings and Credit Cooperative Organizations (Sacco) will help encourage saving and borrowing loans at the lowest interest. The funds can support livelihood activities regardless of the impacts like provision of protective gears such as gum boats, heavy gloves, and life jackets which are expensive for fisher folks. Finally, government should ensure the upgrading and rehabilitation of feeder roads which will ease transportation of products to the markets.
CONFLICT OF INTERESTS
The authors have not declared any conflict of interests.
LIMITATIONS OF THE STUDY
This study was hampered by language barrier and respondents' refusal to be tape recorded. Nonetheless, local research assistants were useful because they spoke the local language and took notes on a daily basis.
ACKNOWLEDGEMENTS
This research was made possible by funding from Climate Impacts Research Capacity Leadership Enhancement (CIRCLE) programme through Makerere University’s strategic framework on capacity development. Special thanks to my team who worked tirelessly in collecting all the useful information and the communities that accepted to participate in the research.
REFERENCES
|
Acheampong EN, Nicholas O, Eric SO (2014). "Vulnerability Assessment of Northern Ghana to Climate Variability" Climatic Change 126(1-2):31-44. |
|
|
Adhikari U, Nejadhashemi AP, Woznicki SA (2015). "Climate Change and Eastern Africa: A Review of Impact on Major Crops." Food and Energy Security 4(2):110-132. |
|
|
Akampumuza P, Hirotaka M (2017). "Weather Shocks and Urban Livelihood Strategies: The Gender Dimension of Household Vulnerability in the Kumi District of Uganda." Journal of Development Studies 53(6):953-970. |
|
|
Alemayehu A, Woldeamlak B (2017). "Smallholder Farmers' Coping and Adaptation Strategies to Climate Change and Variability in the Central Highlands of Ethiopia." Local Environment 22(7):825-839. |
|
|
Amin A, Zaehringer JG, Schwilch G, Koné I (2015). "People, Protected Areas and Ecosystem Services: A Qualitative and Quantitative Analysis of Local People's Perception and Preferences in Côte d'Ivoire." Natural Resources Forum 39(2):97-109. |
|
|
Arndt C, Felix A, James T (2015). "Implications of Climate Change for Ghana's Economy." Sustainability (Switzerland) 7(6):7214-31. |
|
|
Atiqul HSM (2016). "Multi-Benefits of National Parks and Protected Areas: An Integrative Approach for Developing Countries." Environmental and Socio-Economic Studies 4(1):1-11. |
|
|
Bagonza RA (2014). "Gender and Vulnerability to Disasters and Disaster/Climate Risk Management In Uganda: A Participatory Characterisation. |
|
|
Bruno JF, Amanda EB, Chris C, Elizabeth PP, Steven CA, Van Hooidonk R, Stephanie AH, Richard BA (2018). "Climate Change Threatens the World's Marine Protected Areas." Nature Climate Change 8(6):499-503. |
|
|
CDKN (2014). "The IPCC 's Fifth Assessment Report What's in It for Latin America?" Available at: |
|
|
Chambers R (1983). Rural Development: Putting the Last First. International Affairs 60(3):477-478. Available at: https://doi.org/10.2307/2617619. |
|
|
Chikulo BC (2014). "Gender, Climate Change and Energy in South Africa?: A Review." Gender and Behaviour 12(3):5957-70. Available at: |
|
|
Cooper SJ, Wheeler T (2017). "Rural Household Vulnerability to Climate Risk in Uganda." Regional Environmental Change 17(3):649-63. |
|
|
Crawhall N (2015). "Social and Economic Influences Shaping Protected Areas." Protected Area Governance and Management. |
|
|
DFID (1999). "Sustainable Livelihoods Guidance Sheets Introduction: Overview." Sustainable Livelihoods Guidance Sheets, 10. |
|
|
Diem JE, Hartter J, Salerno J, McIntyre E, Stuart GA (2017). Comparison of measured multi-decadal rainfall variability with farmers' perceptions of and responses to seasonal changes in western Uganda. Regional Environmental Change 17(4):1127-1140. |
|
|
Dube K, Nhamo G (2020). "Evidence and Impact of Climate Change on South African National Parks. Potential Implications for Tourism in the Kruger National Park." Environmental Development 33:100485. |
|
|
Egeru A, Bernard B, Josephine N, Aggrey S, Moses TM, Majaliwa MGJ (2019). "Past, Present and Future Climate Trends under Varied Representative Concentration Pathways for a Sub-Humid Region in Uganda." Climate 7(3). |
|
|
Fadina AMR, Dominique B (2018). "Farmers' Adaptation Strategies to Climate Change and Their Implications in the Zou Department of South Benin." Environments - MDPI 5(1):1-17. |
|
|
FAO (2016a). 2015-2016 El Nin?o: Early Action and Response for Agriculture, Food Security and Nutrition. Available at: |
|
|
FAO (2016b). Characterization of the Agricultural Drought Prone Areas on Global a Global Scale at Scale. |
|
|
Food and Agriculture Organisation of the United Nations (FAO) (2018). Resilience Analysis in Karamoja, Uganda. Available at: |
|
|
Fuller TL, Paul RS, Kevin YN, Tróchez A, Morgan K, Demetrio B, Nicola MA (2018). "Science of the Total Environment Climate Warming Causes Declines in Crop Yields and Lowers School Attendance Rates in Central Africa." Science of the Total Environment 610:503-510. |
|
|
Harrington LJ, Dave F, Andrew DK, Friederike ELO (2018). "How Uneven Are Changes to Impact-Relevant Climate Hazards in a 1.5 °C World and Beyond?" Geophysical Research Letters 45(13):6672-6680. |
|
|
Hoogendoorn G, Jennifer MF (2018). "Tourism and Climate Change: A Review of Threats and Adaptation Strategies for Africa." Current Issues in Tourism 21(7):742-759. |
|
|
IPCC (2007). "The IPCC's Fifth Assessment Report: What's in It for Africa?" Change 446 (November): 12-17. |
|
|
IPCC (2014). "IPCC Working Group II Assessment Report 5: Technical Summary. Climate Change 2014: Impacts, Adaptation, and Vulnerability." |
|
|
Islam SN, John W (2017). "Climate Change and Social Inequality." DESA Working Paper No. 152. |
|
|
Jellason NP, Richard NB, John SC, Chukwuma CO (2019). "Climate Change Perceptions and Attitudes to Smallholder Adaptation in Northwestern Nigerian Drylands." Social Sciences 8(2):31. |
|
|
Jiricka-Pürrer A, Tadini V, Salak B, Taczanowska K, Tucki A, Senes G (2019). "Do Protected Areas Contribute to Health and Well-Being? A Cross-Cultural Comparison." International Journal of Environmental Research and Public Health 16(7):1172. |
|
|
Jones N, Malesios C, Kantartzis A, Dimitrakopoulos PG (2020). "The Role of Location and Social Impacts of Protected Areas on Subjective Wellbeing." Environmental Research Letters 15(11). |
|
|
Katutu R, Nyamweha BR, Kabaseke C, Koojo MS, Kervyn M (2019). "Study of Natural Disasters and of Their Impact on the Environmental Condition Rwenzori Mountain Region." Technogenic and Ecological Safety 5:31-37. |
|
|
Kihila JM (2018). "Indigenous Coping and Adaptation Strategies to Climate Change of Local Communities in Tanzania: A Review." Climate and Development 10(5):406-416. |
|
|
Kilimani N, van Heerden J, Bohlmann H, Roos L (2016). "Counting the Cost of Drought Induced Productivity Losses in an Agro-Based Economy: The Case of Uganda," No. 201649. Available at: |
|
|
Krantz L (2001). "Sustainable Livelihood Approach to Poverty Reduction." pp. 93-100. |
|
|
Lam VW, Cheung WW, Reygondeau G, Sumaila UR (2016). "Projected Change in Global Fisheries Revenues under Climate Change." Scientific Reports 6(1):1-8. |
|
|
Limuwa MM (2018). "Evaluation of Small-Scale Fishers ' Perceptions on Climate Change and Their Coping Strategies?: Insights from Lake Malawi". |
|
|
Majaliwa JGM, Tenywa MM, Bamanya D, Majugu W, Isabirye P, Nandozi C, Nampijja J (2015). "Characterization of Historical Seasonal and Annual Rainfall and Temperature Trends in Selected Climatological Homogenous Rainfall Zones of Uganda." Global Journal of Science Frontier Research 15(4). |
|
|
Malakoutikhah Shima, Fakheran S, Hemami MR, Tarkesh M, Senn J (2020). "Assessing Future Distribution, Suitability of Corridors and Efficiency of Protected Areas to Conserve Vulnerable Ungulates under Climate Change." Diversity and Distributions 26(10):1383-96. |
|
|
Marengo JA, Cunha AP, Nobre CA, Ribeiro Neto GG, Magalhaes AR, Torres RR, Sampaio G (2020). "Assessing Drought in the Drylands of Northeast Brazil under Regional Warming Exceeding 4 °C." Natural Hazards 103(2):2589-2611. |
|
|
Masud MB, Khaliq MN, Wheater HS (2015). "Analysis of Meteorological Droughts for the Saskatchewan River Basin Using Univariate and Bivariate Approaches." Journal of Hydrology 522:452-466. |
|
|
Mayega RW, Tumuhamye N, Atuyambe L, Bua G, Ssentongo J, Bazeyo W (2015). "Qualitative Assessment of Resilience to the Effects of Climate Variability in the Three Communities in Uganda," no. July: 58. |
|
|
Mbuli CS, Fonjong LN, Fletcher AJ (2021). "Climate Change and Small Farmers' Vulnerability to Food Insecurity in Cameroon." Sustainability (Switzerland) 13(3):1-17. |
|
|
McKim CA (2017). "The Value of Mixed Methods Research: A Mixed Methods Study." Journal of Mixed Methods Research 11(2):202-222. |
|
|
Mcneely JA (2020). "Today's Protected Areas: Supporting a More Sustainable Future for Humanity." Integrative Zoology 15(6):603-616. |
|
|
Mihiretu A, Okoyo EN, Lemma T (2019). "Determinants of Adaptation Choices to Climate Change in Agro-Pastoral Dry Lands of Northeastern Amhara, Ethiopia." Cogent Environmental Science 5(1). |
|
|
Misrachi M, Belle E (2016). "Protected Areas Resilient to Climate Change, Guidelines for Protected Area Managers in the Face of Climate Change pp. 1-28. |
|
|
Mnimbo TS, Lyimo-Macha J, Urassa JK, Mahoo HF, Tumbo SD, Graef F (2017). "Influence of Gender on Roles, Choices of Crop Types and Value Chain Upgrading Strategies in Semi-Arid and Sub-Humid Tanzania." Food Security 9(6):1173-1187. |
|
|
Molina-Azorin JF (2016a). "Mixed Methods Research: An Opportunity to Improve Our Studies and Our Research Skills." European Journal of Management and Business Economics 25(2):37-38. |
|
|
Molina-Azorin JF (2016b). "Mixed Methods Research: An Opportunity to Improve Our Studies and Our Research Skills." European Journal of Management and Business Economics 25(2):37-38. |
|
|
Mthembu A, Hlophe S (2020). "Building Resilience to Climate Change in Vulnerable Communities: A Case Study of UMkhanyakude District Municipality." Town and Regional Planning 77:42-56. |
|
|
Mubiru DN, Radeny M, Kyazze FB, Zziwa A, Lwasa J, Kinyangi J, Mungai C (2018). "Climate Trends, Risks and Coping Strategies in Smallholder Farming Systems in Uganda." Climate Risk Management 22:4-21. |
|
|
Mudelsee M (2019). "Trend Analysis of Climate Time Series: A Review of Methods." Earth-Science Reviews 190:310-22. |
|
|
Mugagga F, Elepu J, Nimusiima A, Bamutaze Y (2019). "Institutional Determinants to Climate Variability Adaptation by Smallholder Irish Potato Farmers in Rubanda District, South Western Uganda." American Journal of Climate Change 8(1):77-93. |
|
|
Mugume I, Mesquita MDS, Basalirwa C, Bamutaze Y, Reuder J, Nimusiima A, Waiswa D, Mujuni G, Tao S, Ngailo TJ (2016). "Patterns of Dekadal Rainfall Variation over a Selected Region in Lake Victoria Basin, Uganda." Atmosphere 7(11):1-23. |
|
|
Mulinde C, Majaliwa JGM, Twesigomwe E, Egeru A (2016). "Meteorological Drought Occurrence and Severity in Uganda. Disasters and Climate Resilience in Uganda: Processes, Knowledge and Practices," pp. 185-215. |
|
|
Müller C, Waha K, Bondeau A, Heinke J (2014). "Hotspots of Climate Change Impacts in Sub-Saharan Africa and Implications for Adaptation and Development." Global Change Biology 20(8):2505-2517. |
|
|
Musinguzi L, Efitre J, Odongkara K, Ogutu-Ohwayo R, Muyodi F, Natugonza V, Olokotum M, Namboowa S, Naigaga S (2016). "Fishers' Perceptions of Climate Change, Impacts on Their Livelihoods and Adaptation Strategies in Environmental Change Hotspots: A Case of Lake Wamala, Uganda." Environment, Development and Sustainability 18(4):1255-1273. |
|
|
National Environment Management Authority (NEMA) (2016). "National State of the Environment Report for Uganda 2014; Harnessing Our Environment as Infrastructure for Sustainable Livelihood & Development. Available at: |
|
|
National Environment Management Authority (NEMA) (2019). "The National State of the Environment Report 2018-2019: Managing the Environment for Climate Resilient Livelihoods and Sustainable Economic Development." Kampala, Uganda. |
|
|
Ngoma H, Wen W, Ojara M, Ayugi B (2021). "Assessing Current and Future Spatiotemporal Precipitation Variability and Trends over Uganda, East Africa, Based on CHIRPS and Regional Climate Model Datasets." Meteorology and Atmospheric Physics 133(3):823-843. |
|
|
Niang I, Ruppel OC, Abdrabo MA, Essel A, Lennard C, Padgham J, Urquhart P (2014). "Chapter 22 - Africa." Climate Change 2014: Impacts, Adaptation and Vulnerability - Contributions of the Working Group II to the Fifth Assessment Report of the Intergovernmental Panel on Climate Change pp. 1199-1265. |
|
|
Nimusiima A, Basalirwa CPK, Majaliwa JGM, Kirya D, Twinomuhangi R (2018). "Predicting the Impacts of Climate Change Scenarios on Maize Yield in The Cattle Corridor of Central Uganda." Journal of Environmental and Agricultural Sciences 14:63-78. |
|
|
Norma RAR, Ngulube P (2015). "Mixed Method Research." In Addressing Research Challenges: Making Headway for Developing Researchers pp. 157-175. |
|
|
Nsubuga FW, Rautenbach H (2018). "Climate Change and Variability: A Review of What Is Known and Ought to Be Known for Uganda." International Journal of Climate Change Strategies and Management 10(5):752-771. |
|
|
Nwe T, Zomer RJ, Corlett RT (2020). "Projected Impacts of Climate Change on the Protected Areas of Myanmar." Climate 8(9):1-15. |
|
|
Ongoma V, Guirong T, Ogwang BA, Ngarukiyimana JP (2015). "Diagnosis of Seasonal Rainfall Variability over East Africa: A Case Study of 2010-2011 Drought over Kenya." Pakistan Journal of Meteorology 11(22):13-21. |
|
|
Opiyo F (2016). "An Indicator Framework for Measuring Pastoralists ' Resilience to Drought in the Horn of Africa," no. February 2017. |
|
|
Opiyo F, Wasonga O, Nyangito M, Schilling J, Munang R (2015). "Drought Adaptation and Coping Strategies Among the Turkana Pastoralists of Northern Kenya." International Journal of Disaster Risk Science 6(3):295-309. |
|
|
Raemaekers S, Sowman M (2015). "Community-Level Socio-Ecological Vulnerability Assessments in the Benguela Current Large Marine Ecosystem." Available at: |
|
|
Reuss A, Titeca K (2017). "Beyond Ethnicity: The Violence in Western Uganda and Rwenzori's 99 Problems." Review of African Political Economy 44(151):131-141. |
|
|
Rusinga O, Chapungu L, Moyo P, Stigter K (2014). "Perceptions of Climate Change and Adaptation to Microclimate Change and Variability among Smallholder Farmers in Mhakwe Communal Area, Manicaland Province, Zimbabwe." Ethiopian Journal of Environmental Studies and Management 7(3):310. |
|
|
Rwenzori Region Agriculture Sector, and Profile, Investment. 2020. "Rwenzori Region Agriculture Sector and Profile." Available at: |
|
|
Silverman D (1998). "Qualitative Research: Meanings or Practices?" Information Systems Journal 8(1):3-20. |
|
|
Silverman D (2021). "Collecting Qualitative Data during a Pandemic" 17(1):76-84. Available at: |
|
|
Tadesse G, Dereje M (2018). "Impact of Climate Change on Smallholder Dairy Production and Coping Mechanism in Sub-Saharan Africa - Review." Advances in Life Science and Technology 65(4):41-54. |
|
|
Taye D (2019). "Livelihoods Vulnerability of Climate Variability and Coping Mechanism: The Case Study of Bale Lowlands South Eastern, Ethiopia." International Journal of Agricultural Research, Innovation and Technology 9(1):23-34. |
|
|
Thalheimer L, Williams DS, van der Geest K, Otto FEL |(2021). "Advancing the Evidence Base of Future Warming Impacts on Human Mobility in African Drylands." Earth's Future 9(10). |
|
|
Uganda Bureau of Statistics (UBOS) (2014). "2014 Statistical Abstract." Uganda Government Ministry of Finance and Economic Development pp. 52-60. |
|
|
Uganda Bureau of Statistics (UBOS) (2017). Statistical Abstract." Uganda Bureau of Statistics pp. 1-341. |
|
|
Uganda Bureau of Statistics (UBOS) (2018). "Uganda National Household Survey 2016/17. Kampala, Uganda. Available at: |
|
|
Uganda Bureau of Statistics (UBOS) (2020). "Statistical Abstract 2020." Uganda Bureau of Statistics 1:303. Available at: |
|
|
Umunakwe P, Ani A, Ozor N, Nnadi F (2015). "Indigenous Practices for Climate Change Adaptation among Rural Households in Imo State, Nigeria." British Journal of Applied Science and Technology 8(1):67-79. |
|
|
UNMA (2020). "March to May 2020 Seasonal Rainfall Outlook over Uganda," Available at: |
|
|
US Bureau of Demography Human Rights and Labour (2017). "Country Reports on Human Rights Practices for 2017 - UGANDA." Available at: |
|
|
Verner D, Treguer D, Redwood J, Christensen J, McDonnell R, Elbert C, Konishi Y (2018). "Climate Variability, Drought, and Drought Management in Tunisia's Agricultural Sector." Climate Variability, Drought, and Drought Management in Tunisia's Agricultural Sector. Available at: |
|
|
van Wilgen NJ, Goodall V, Holness S, Chown SL, Mcgeoch MA (2016). "Rising Temperatures and Changing Rainfall Patterns in South Africa's National Parks." International Journal of Climatology 36(2):706-721. |
|
|
Zizinga A, Tenywa M, Majaliwa J, Mugarura M, Ababo P, Achom A, Gabiri G, Bamutaze Y, Kizza L, Adipala E (2015). "Potential Climate Change Adaptation and Coping Practices for Agricultural Productivity in the Mountain Areas of South Western Uganda." Journal of Scientific Research and Reports 7(1):23-41. |
|
|
Zougmoré RB, Partey ST, Ouédraogo M, Torquebiau E, Campbell BM (2018). "Facing Climate Variability in Sub-Saharan Africa: Analysis of Climate-Smart Agriculture Opportunities to Manage Climate-Related Risks." Cahiers Agricultures 27(3). |
|
|
Zwiener VP, Padial AA, Marques MC, Peterson AT, Faleiro FV, Loyola R, Peterson AT (2017). "Planning for Conservation and Restoration under Climate and Land Use Change in the Brazilian Atlantic Forest." Diversity and Distributions 23(8):955-966. |
|
Copyright © 2024 Author(s) retain the copyright of this article.
This article is published under the terms of the Creative Commons Attribution License 4.0


