ABSTRACT
Rivers Wouri and Meme are surrounded by streams and wells and serve for irrigation, fishing, domestic purposes and transportation. Water samples were collected from the rivers in February (dry season) and August (wet season) of 2012 at different sites and at different depths and analyzed for some physicochemical properties. This was to study the effect of seasonal changes on the properties and also infer the possible sources of pollution. Water from the other sources was also analyzed. All analyses were done using standard methods. The properties were generally higher during the dry season. Both rivers were acidic. The Electrical conductivities (E.Cs) of River Wouri were generally much lower than those of River Meme with mean values of 2943.0 and 5703.0 μS/cm respectively during the dry season. Ca2+/Mg2+ ratios for upstream in River Meme were greater than 3 during the dry season. During the dry season, in Wouri at site WO1, Cations and anions decreased with depth, while at site WO7, the same properties increased with depth. For River Meme at site ME1, there was no significant (p<0.01) variation of cations and anions with depth. On the contrary, at site ME8, the anions increased with depth while the cations decreased significantly (p<0.01) with depth. The streams were weakly basic with average pH of 8.3 for those of Wouri and 9.0 for those around River Meme. The streams around River Wouri generally had higher physicochemical properties. Physicochemical properties of the wells of Wouri were generally higher than those of the streams during both seasons. There was a very significant correlation (p < 0.01) between nitrate and choride ions in both rivers during the dry season. Most of the properties were within the levels set by World Health Organization and Environmental Protection Agency (EPA). The water sources are exposed to increases in anthropogenic activities, such as industrial and municipal waste disposal and farming practices. A more stringent legislation about water management, as well as studies about the biological content of the water sources is recommended.
Key words: Physicochemical, properties, Meme, Wouri, rivers, dry season, wet season.
Water is primordial among the needs of living things and man’s most urgent need is good water. The former could not survive in a few days if deprived of it but could do so in as many days without food (Faniran, 1991). Its importance cannot be overemphasized in industries, agriculture, economic activities, health etc. Unfortunately, water scarcity is a global problem affecting close to 2.8 billion people (Mbua, 2013). According to the latter, the situation is alarming in developing countries. While improved water sources were accessible to more than 2 billion people from 1990 to 2010, Sub-Saharan Africa had the lowest drinking-water coverage compared to the other regions of the world (UNICEF/WHO, 2012). The role of good water as engine of socioeconomic development makes its management of pivotal importance. Cameroon’s record in this respect falls below expectation. Statistics on the number of persons with access to quality water in the country vary. The figure is estimated to be between 42 and 74% (Otto, 2014) of the population. In Sub-Saharan Africa, including Cameroon about 58% of the population has no access to portable water (Fonjong and Fokum, 2017). There is therefore an increasing need for greater access to portable water.
There is an increased dependence on ground water along the coast of the Gulf of Guinea (Eneke et al., 2011) and Cameroon in particular. This dependence is prominent in agriculture, domestic activities, health etc. The Geology and anthropogenic activities of a region influence the water quality (Eneke et al., 2011). It is evident that although water is highly important, it is often impaired by human and natural activities. Many water diseases are abound; cholera, typhoid, dysentery etc. Water safety is necessary (Nwankwoala and Udom, 2011). Cameroon is endowed with many water sources, which could contribute to the economy of the country. The country has as a long-term plan to emerge by 2035. Water quality is one of the indicators of developed/ emerging countries. Hence, the need for more studies on water quality.
One of the reasons associated to scarcity of drinking water is contamination or pollution. Among the various types of pollution, water pollution is second undesirable only after air pollution, in terms of effects (Milani et al. 1992). Pollution is either natural or anthropogenic. In sub-Saharan Africa, almost all communities in coastal areas depend on groundwater for drinking and domestic purposes (Edet, 2008). This is because it is readily available and is relatively cleaner than surface water sources, which are exposed to pollution from domestic wastes and runoff especially during the rainy season. Groundwater does not need extensive treatment before use (Yidana, 2010). Water quality is therefore an environmental and health issue that needs urgent attention. One of the technologies to monitor water quality is the determination of some of its physicochemical properties. Some of the physicochemical properties of water of great concern are cations, anions and pH. They affect the health of both plants animals. Heavy metals are soluble at low pH and can easily find themselves into waterways. Calcium and magnesium, although necessary for health, cause great health disorders when in excess or when they are not in appropriate ratios.
Douala harbours most of the industries in Cameroon. In the area, there are numerous water bodies of diverse uses by the 2.943 million inhabitants (CDP, 2018). Some of the water bodies are streams, wells and rivers. Conspicuous on the list of rivers is River Wouri lined by the Wouri mangroves. It is hypothesized that the diversity of industrial activities in the area and their effluents constitute a potential threat to water and the mangroves. Many towns in Meme harbour major agricultural establishments. The Meme River is prominent in these towns. It is the largest river in Meme Division. Many other water bodies drain into this river that in turn, empties into the Atlantic Ocean. Agricultural runoffs into these water bodies could carry or contain chemical substances, which would be dangerous at high concentrations. The inhabitants use these water bodies for various purposes. Whereas River Wouri feeds the Wouri Mangrove, River Meme feeds the Rio del Rey Mangrove. The probability that they could be contaminated from the human activities that take place around them could therefore be high. Hence, the dire need to study the quality of the water sources in the area.
There is a great need for good portable and clean water for sustainability, survival of industries and above all, good health of the inhabitants. The increasing indiscriminate disposal of domestic, industrial and agricultural wastes on water and soil is a cause for concern as the latter are exposed to contamination or pollution. Seasonal variations could also affect the quality of the water sources. Water pollution is therefore receiving great attention as an area of research. This work is therefore, aimed at investigating some physicochemical properties water sources that feed certain mangroves of Cameroon and relating them to natural and/or anthropogenic activities within this sub-region. It is also aimed at comparing the effect of seasonal changes and the relative threats on the mangroves from the quality of the water sources and make concrete recommendations.
Description of sites
Location
One of the areas of study is around River Wouri. The river takes its rise from River Nkam and empties at the Wouri estuary. The region lies between latitudes 3 38 30N and 04 09 34 N and longitudes 9 35 0E and 9 45 30 E (Figure 1). In this area are found the Bassa and the Bonaberi Industrial Zones of Douala. The zones are located within the Douala Basin. The two industrial zones account for the bulk of industrial activities in the country, but depict contrasting features in terms of physical landscape (Dumont, 1968; Regnoult, 1986).The other site is around River Meme. The region lies in the Rio del Rey Basin. It lies between latitudes 04° 29.000 N and 04° 37.019N and longitudes 009° 02.000E and 009° 08.000E (Figure 2).
Topography, geology and drainage
The Bonaberi Industrial Zone evolved almost entirely on the aquatic terrain located on lagoon marginal depressions. This necessitated extensive land reclamation to obtain space on which industrial activities had to be built. The Bassa Industrial Zone terminates into estuarine creek formation of the Dibamba River to the East of the city. The Bonaberi Industrial Zone complex has encroached into the Wouri River and this most likely provokes increased discharge of effluents into it (Tening et al., 2013). The river is fed by streams and passes through the Wouri Mangrove and terminates at the Atlantic Ocean with the formation of the Wouri Estuary (Figure 1).
The basin around River Meme is part of the Douala sedimentary basin. From south to north the sedimentary basin is symmetrically divided by the Cameroon volcanic line (CVL) in two geomorphological settings: the Douala basin (7,000 km2) to the South and the Rio del Rey basin to the North (2,500 km2). Within the Rio del Rey basin, isobaths lie up to 80 km from the beach (Tening et al., 2014). Figure 2 is a map of sampling points and drainage around River Meme.
Rock type and soils
The Douala basin consists mainly of sandstone with a few intercalations of limestone and shale. The Mpundu Formation consists of poorly consolidated grits and sandstones that occasionally display bedding (Tening et al., 2013). However, the Douala metropolis lies on the Wouri member of the Mpundu Formation, which is dominantly made up of gravely sandstone with clay matrix. The soils of this area are alluvial resulting from the decomposition of sedimentary rocks. They are essentially sandy and commonly rich in quartz and clay minerals. These soils are very permeable in some areas. However, in other areas, the soils are very rich in clays to the extent that percolation of rainwater takes quite a long time (Tening et al., 2013). The soils around River Meme are ferallitic (Gavaud and Muller, 1980), yellowish in colour and varying from clayey, silty, sandy to lateritic clay sub soils (Tening et al., 2014).
Human activities
The human activities in the Douala city are presented in Table 1. The main activities around River Meme are agricultural with two agro-industrial complexes: the CDC Rubber Plantation and the PAMOL Plantation. Few farmers also cultivate crops like plantains, cocoyams, Cassava etc. Both the Agro-industrial complexes and the local farmers use fertilizers and other agrochemicals that are likely to impact the water quality in the area.
Sampling
Water samples were collected in the areas from rivers, wells and streams. This was done during the month of February (peak of dry season) and August (peak of rainy season). In the rivers, the sampling points were located at the tributaries. In rivers and wells, the samples were collected at the surface, 1m, 3m and 5m respectively using a 1litre depth sampler (The Science Source: WIFFLE BALL KING, Reg. No. 1149044, USA) (Figure 3). The collection points were geo-referenced. The sampler was placed into the water after assemblage and water collected (Figure 4).The water samples were filtered using Whatman 40 filter papers placed across a funnel. They were filtered into 250ml plastic bottles to the brim and corked. It is worth noting that before filling, the bottles were rinsed several times with water from the point to be collected.
Prior to filtration, temperature, pH and EC were measured using a CE108380 TRACER Pocket TesterTM field meter. The collected samples were rapidly put into a cooler containing ice blocks to restrict microbial activity. They were then transported to the laboratory where they were stored at temperature of -4 0c before laboratory analysis. Water from wells and streams were collected using small buckets and filtered into 250 ml bottles.
Water analysis
Analysis for ions was done using ion chromatography. This was done at the Biogeochemistry Laboratory, University of Bristol, United Kingdom. Water samples were analysed for the cations (Na+, K+, Mg2+, Ca2+ and NH4+) and anions (Cl-, SO42- and NO3-) by ion chromatography. Cation analysis was performed by suppressed conductivity ion chromatography using a Dionex ICS-90 equipped with an Ion Pac CS16 column (5 x 250 mm) and an AS40 Autosampler. The eluant was 0.04 N methanosulfonic acid at a flow rate of 0.5 ml/min. The sample injection volume was 25 μl. The cation standards used for calibration were purchased from Fisher Scientific, UK. Saline samples were diluted 10- and 100- fold with de-ionized water. Suppressed conductivity detection ion chromatography using a Dionex IC25 equipped with an ASR Ultra II 4 mm column and AS3500 autosampler performed anion analysis. The eluent was NaOH at 1 ml/min and the sample injection volume was 25 μl. Anion standards used for calibration were purchased from Fisher Scientific, UK. Saline samples were diluted 10- and 100-fold when required with de-ionised water. The relative precisions of both the cation and anion analyses methods were typically better than 5% once samples were corrected for instrument drift. Experimental data was analysed with the statistical package SPSS11.0 and EXCEL 2010 for Windows. Correlation and regression analyses were performed on the various data to evaluate the relationships.
Physicochemical properties of Rivers Wouri and Meme during the seasons
During the dry season, there were variations in physicochemical properties from upstream to downstream (Table 2 and Figure 5). This may have been caused by changes in quantity and/or composition of freshwater discharges. This can alter the Chemistry of the environment, such as hydrogeology and temperature not suitable for the mangrove ecosystem as was reported by Tening et al. (2013). Nutrients from fresh water inflow not only affect water quality but equally species diversity as was reported by Doering (1996). All the mean values of River Meme were higher than those of River Wouri (Table 3). The degree of acidity of water is inferred from its pH. The mean pH of 7.7 for Wouri and 8.0 for Meme respectively were within the permissible range of 6.5-8.5 (WHO, 2008; EPA, 2018). pH of a water body is very important in determination of water quality since it affects other chemical reactions such as solubility and metal toxicity as was reported by Fakayode (2005). They indicated that the rivers were slightly alkaline and not polluted (Fakayode, 2005). In a similar study, Tening et al. (2013) found the pH of River Wouri to be 7.4.

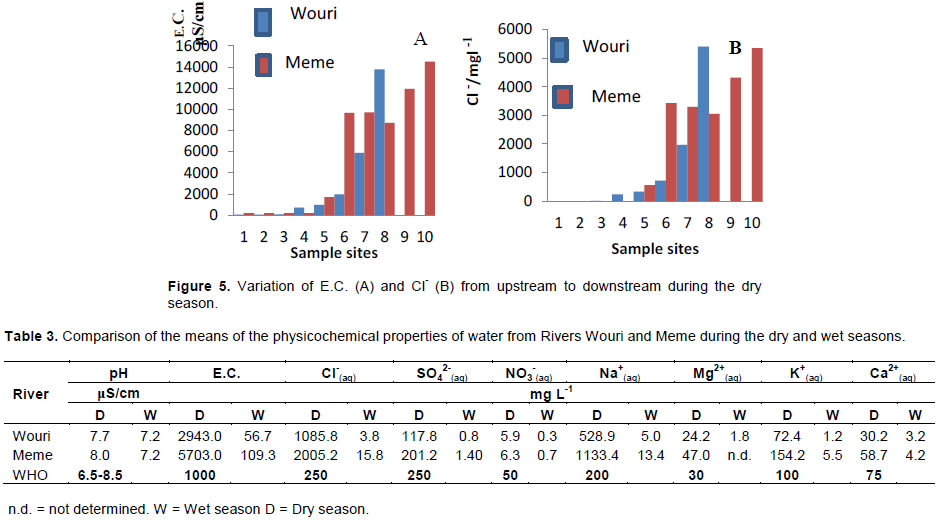
Electrical conductivity is a measure of the amount of ions in solution. The Electrical conductivities (E.Cs) of River Wouri were generally much lower than those of River Meme with mean values of 2943.0 and 5703.0 μS/cm respectively. These values were much higher than the maximum allowable value of 1000 μS/cm set by WHO (2008). Mean concentrations of the cations stood at Na+(aq) >K+(aq) > Ca2+(aq) > Mg2+(aq) for both rivers. Anions showed a trend of Cl-(aq) > SO42-(aq) > NO3-(aq). There was a significant difference (p<0.01) between the means of both rivers. This could be an indication that from River Wouri the sampling scenario had no effect on the statistical detection of temporal trends in physicochemical properties of water samples as was reported by Tening et al. (2013) and that the higher values of River Meme could be attributed to the nature of activities and the soils of the area.
The concentration of most ions in water is measured in mg/L. It is a measure of the amount of the respective ions present in water one litre of solution. The means for Ca2+ for River Wouri and River Meme, 30.2 and 58.7 mg L-1 respectively were below the WHO limit for domestic and industrial use. Too much calcium prevents the uptake of magnesium, and hence the optimum balance of these two minerals in the water which we drink is vital to our health as was reported by Rosborg (2015). Magnesium concentrations were generally higher in Meme than in Wouri. Clay minerals have low concentration of Mg2+ according to Todd (1980). If the concentration of Mg2+ were from clay mineral alone, it would have been low. Hence the high concentration could be attributed to natural and anthropogenic sources. Potassium had an average concentration of 72.4 in Wouri and 154.2 mg L-1 in Meme. The high concentrations of potassium in these rivers could partly be from industrial sources in the area such as the salt producing industry, Sel camerounaise (SELCAM)) in Douala for Wouri and the CDC for Meme.
The mean concentration of Sodium in River Wouri was 528.9 while in River Meme; it was 1133.4 mg L-1. These values are much greater than the maximum allowable limit of 200 mg L-1 set by WHO (2008). High Na levels may contribute to elevated blood pressure according to Rosborg (2015). Long term discharge of these ions which function as dispersants into the mangrove environment can change the structural properties of the swamp land and lead to stress events. This could lead to regression of the mangrove land surface and species that grow on them.
During the wet season, the composition of anions and cations varied at different sites of both rivers (Table 2). Unlike during the dry season where the differences were significant (p<0.05), the differences during the wet season were not very significant. Both rivers were acidic (Table 3). The physicochemical properties of River Meme were much higher than those of River Wouri. Similar results were obtained during the dry season. However, these properties were far below the acceptable limits formulated by WHO (2008).
The normal Ca2+/Mg2+ ratio is 2-3/1 as set by Rosborg (2015). Ca2+/Mg2+ ratios for upstream in River Meme were greater than 3 during the dry season. This is an indication that inhabitants of this region are exposed to the effects of excess Calcium. Excess calcium is associated with prostate cancer and also inhibits production of Vitamin D3 according to Treadwell (2011).
Variation of physicochemical properties of water from the Rivers Wouri and Meme with depth during the seasons
During the dry season, in Wouri at site WO1, located at upsteam, Cations and anions decreased with depth, while at site WO7, located at downstream, the same properties increased with depth (Table 4). Where the cations increased with depth could be an indication that one of the major sources of cations is the breakdown of bedrock materials and where they decreased with depth could be an indication that one of the major sources of the cations was anthropogenic. The increase in cations and anions were reflected in the corresponding increase in conductivity with depth (Table 4). This increase in conductivity with depth was prominent at site WO7 (Table 4).
For River Meme at site ME1, there was no significant (p<0.01) variation of cations and anions with depth (Table 4). This is shown in the conductivity which remained the same (190.0 μS/cm) with depth (Table 4). On the contrary, at site ME8, the anions increased with depth while the cations decreased significantly (p<0.01) with depth. This could be an indication that at this site, the cations had anthropogenic sources. It is also an indication that downstream, the anions had as source weathering of bedrocks. It can be seen that in both rivers, one of the major sources of cations was anthropogenic probably from the industries around the Wouri River and the CDC and agricultural establishments around River Meme.
During the wet season, for Wouri at site WO1, there were no significant (p<0.05) changes in pH and electrical conductivity with depth (Table 4). This could be an indication that natural and anthropogenic factors did not influence these parameters as depth increases. At site WO1, nitrate was only present (0.4 mg L-1) at depth of 5 m. The anions did not show any trend with depth. Generally, sodium increased with depth implying a natural source (bedrock) while the rest of the cations decreased with depth implying anthropogenic contamination from runoffs or discharges into the river. At site WO7, pH and electrical conductivity again remained virtually the same. The anions decreased with depth. This could be an indication that they may have had anthropogenic sources of origin. This was evidenced from nitrate which was found only at the top (0.7 mg L-1) (Table 4) of the river at this site. Generally potassium and calcium did not show any trend with depth. Magnesium increased very slightly with depth while sodium decreased with depth. The properties were almost the same at both sites.
For Meme at site ME1, pH and electrical conductivity were about the same with depth with average of 7.2 and 76.0 μS/cm respectively (Table 4). Generally, chloride decreased while sulphate increased with depth implying anthropogenic and natural sources respectively. Sodium increased significantly, potassium decreased while there was a fluctuation in calcium with depth (Table 4). At site ME8, pH increased, while electrical conductivity decreased slightly with depth (Table 4). This is an indication of the influence of anthropogenic activities at this site. Chloride, sodium and potassium decreased slightly with depth thus confirming the influence of anthropogenic activities on the water quality of the river. Unlike at site ME1 where only ammonium and potassium were completely absent, at site ME8 sulphate, nitrate, ammonium and potassium were absent. The chloride, sodium and electrical conductivity of site ME8 were much higher than those of site ME1.

Physicochemical properties of streams during the seasons
The streams (Table 5) showed concentrations, which varied with locations during the dry season. This was very pronounced among the streams that feed Wouri. For example, the EC of site WOS1 was 410.0 while that of site WOS2 was <10.0 μS/cm. This could be an indication that Stream WOS1 suffered from anthropogenic incidence than stream WOS2. The streams that feed River Meme had same ECs of 60 μS/cm (Table 5). This may be an indication they had less anthropogenic disturbances than those that feed River Wouri, The streams feeding both rivers were weakly basic with average pH of 8.3 for those of Wouri and 9.0 for those around River Meme. The streams around River Meme had pH> 8.5 (Table 5). This was out of the allowable range of 6.5- 8.5 set by WHO (2008) and EPA (2018).
Streams WOS1 in Wouri and MES2 in Meme had Ca2+/Mg2+ greater than the ideal value proposed by Rosborg (2015) during the dry season. These streams are located upstream. This could be an indication that the inhabitants of these localities who use the streams for various purposes could be exposed to the risks associated with excess calcium or magnesium deficiency.
During the wet season like in dry season, the streams showed concentrations which varied with locations (Table 5). This was very pronounced in stream WOS1 that feeds Wouri where the electrical conductivity of the site was 179.3 μS/cm while that of site WOS2 was 30.0 μS/cm. WOS1 was situated at Akwa Nord, at the heart of the city where there was much habitation. While WO2 was situated at Bikoko where there was no habitation at the moment. The streams that feed River Meme had different electrical conductivities of 49.1 and 66.3 μS/cm respectively (Table 5). The streams around River Wouri generally had higher physicochemical properties.
Physicochemical properties of wells during the seasons
Physicochemical properties of the wells of Wouri were generally higher than those of the streams during the dry season (Table 6). On the contrary, the physicochemical properties of the wells of Meme were generally lower than those of the streams (Tables 5 and 6). This could be an indication that ground water contamination is minimal and that anthropogenic activities were responsible for the higher levels in streams. The wells feeding both rivers were acidic with average pH of 6.7 for the wells in around Meme and 7.2 for wells around River Wouri. The wells MEW3 and MEW4 had very high Ca/Mg ratios during the dry season. This exposes the population who use these wells to the deleterious effects of excess Calcium or magnesium deficiency.
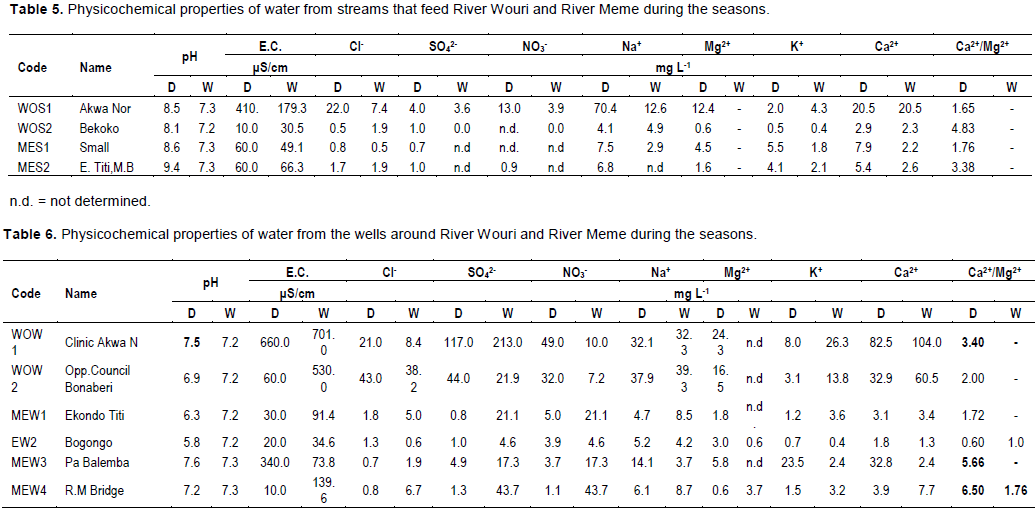
Physicochemical properties of the wells of Wouri were generally higher than those of the streams (Tables 5 and 6) in the wet season. This was same in the dry season. Just like Wouri, the physicochemical properties of the wells of Meme were generally higher than those of the streams (Tables 5 and 6). The wells feeding both rivers were acidic with same average pH of 7.2. The streams feeding both rivers were also acidic with similar pH, which ranged from 7.20 to 7.30. This was within the allowable range of 6.5 – 8.5 set by WHO (2008) and EPA (2018).
Comparison of the influence of seasonal changes on the physicochemical properties of the water sources
A comparison was done in order to find out if seasonal changes between the dry and wet seasons affected the concentration or magnitude of the properties as well as source of the properties.
Rivers
All the properties decreased drastically on moving from the dry season to the wet season (Table 7) in both rivers. Similar results of strong seasonal variation had been reported by Agbaire and Obi (2009), Ladipo et al. (2011) and Vaishali and Punita (2013). The variation in E.C. was significant (p<0.05) along the rivers. This was an indication that the dissolved salts were not evenly distributed.
There was a very significant correlation (p<0.01) between EC and the ions except nitrate and calcium ions in the wet season in Wouri (Table 8). However, during the dry season there was a similar significant correlation (p<0.01) between the ions and EC except nitrate ion (Table 9).
For River Meme, there was a very significant correlation (p<0.01) between EC and chloride, potassium and sodium ions during the wet season (Table 10). In the dry season, there was a very significant correlation between EC and all the ions (Table 11). This is an indication that in Meme chloride, potassium and sodium ions had natural origins while the rest of the ions had natural and anthropogenic sources. There was also a very significant correlation (p < 0.01) between nitrate and choride ions in both rivers during the dry season (Tables 9 and 11). Demlie et al. (2007) indicated that a positive correlation of NO3− and Cl− was a diagnostic indicator of anthropogenic activity. This suggests an anthropogenic source of nitrate ions from the use of agrochemicals in the nearby plantations, other farms and inputs from domestic waste as was reported by Wotany et al. (2013). The nitrates leach into ground water sources and eventually into the river. The source of nitrate in River Wouri could be from the intense habitation and/or the industrialization.


Streams around Rivers Wouri and Meme
Acidity, sulphate, nitrate, potassium and calcium concentrations were higher in the dry season than in the rainy season (Table 5). Stream WOS1 was located at Akwa Nord and Stream WOS2 was located at Bikoko junction. Stream MES1 was located at Small Nganjo while stream MES2 was located at Ekondo Titi where the main activity is agricultural. Akwa Nord is located at the heart of the city where there is human habitation. The activity around Bikoko junction is mostly industrial. The water properties of River Meme were generally higher than those of River Wouri.
Wells around Rivers Wouri and Meme
Electrical conductivity (E.C.), K, Na and Ca concentrations were generally lower in the dry season when compared to the wet season (Table 6). Nitrates were higher during the dry season than during the wet season among the Wouri wells. Among the Meme wells, they were higher during the wet season (Table 6). The higher concentrations during the wet season could be attributed to runoffs or increased dissolution from fertilizers, hence anthropogenic source of pollution.
During both seasons and in both rivers, there were variations in physico-chemical properties from upstream to downstream. The pH of the rivers and most other physico-chemical properties of the rivers were within the acceptable limits of WHO except in the upstream of River Meme where the pH > 9.00 was high. Some of the sources of pollution were anthropogenic. The properties during the dry season were generally higher for the rivers and streams and were lower for the wells. A stream at Meme had pH > 8.50 while the stream at Bikoko had a very high Ca/Mg ratio (4.83). The well in Akwa Nord had a comparatively high (49 mg/L) nitrate, Ca and Ca:Mg ratio (3.4). River Meme is more threatened. Proper and safer means of waste management such as reducing, re-using and recycling are recommended. The use of less acid forming fertilizers and more compost is also highly recommended.
The authors have not declared any conflict of interests.
The authors are grateful to the Biogeochemistry Laboratory, University of Bristol, United Kingdom, where the analyses were carried out. The authors are also heavily indebted to Mr. Fomenky Ngunkeng of the University of Buea for conducting the data analyses.
REFERENCES
|
Agbaire PO, Obi CG (2009). Seasonal Variations of Some Physico-Chemical Properties of River Ethiope Water in Abraka, Nigeria. Journal of Applied Science and Environmental Management 13(1):55-57.
Crossref
|
|
|
|
Cameroon Demographics Profile (CDP) (2018). Cameroon Demographics Profile.
View
|
|
|
|
|
Demlie M, Wohnlich S, Wisotzky F, Gizaw B (2007). Groundwater recharge, flow and hydrogeochemical evolution in a complex volcanic aquifer system, central Ethiopia. Journal of Hydrogeology 15:1169-1181.
Crossref
|
|
|
|
|
Doering PH (1996). Temporal variability of water quality in St. Lucie Estuary Southern Florida. Water Resource Bulletin 32:1293-1306.
Crossref
|
|
|
|
|
Dumont JC (1968). Carte Geologique de reconnaissance avec notice explicative feuille Douala-Ouest. Bureau des Recherches Geologiques et Minieres. Yaounde.
|
|
|
|
|
Edet AE (2008). The hydro geochemical characteristics of coastal aquifers in the West Coast of Africa: A review. Trans boundary Aquifer Conference, Tripoli, Libya.
|
|
|
|
|
Eneke GT, Ayonghe SN, Chandrasekharam D, Ntchancho R, Ako AA, Mouncherou OF, Thambidurai P (2011). Controls on groundwater chemistry in a highly urbanised coastal area. International Journal of Environmental Research 5(2):475-490.
|
|
|
|
|
Environmental Protection Agency (EPA) (2018). Drinking Water Standards and Health Advisories U.S. Environmental Protection Agency. EPA.
|
|
|
|
|
Fakayode SO (2005). Impact Assessment of Industrial Effluent on Water Quality of the Receiving ALaro River in Ibadan, Nigeria. Ajeam-Ragee 10:1-13.
|
|
|
|
|
Faniran A (1991). Water Resources Development in Nigeria. University of Ibadan, Ibadan.
|
|
|
|
|
Fonjong L, Fokum V (2017). Water Crisis and Options for Effective Water Provision in Urban and Peri-Urban Areas in Cameroon. Society and natural resources 30(4):488-505.
Crossref
|
|
|
|
|
Gavaud M, Muller JP (1980). Soils. In: Laclavere G, Loung J.-F. (eds). Atlas of the United Republic of Cameroon. Editions Jeune Afrique 51, avenues des Terres 75017.
|
|
|
|
|
Horan NJ (1990). Biological waste water treatment systems: Theory and operation. John Wiley and Sons, New York, USA. 215p.
|
|
|
|
|
Ladipo MK, Ajibola VO, Oniye SJ (2011). Seasonal variations in physicochemical properties of water in some selected locations of the lagos lagoon. Science World Journal 6(4):5-11.
|
|
|
|
|
Mbua RL (2013). Water supply in Buea, Cameroon: analysis and the possibility of rainwater harvesting to stabilize the water demand. Doctoral Thesis.
|
|
|
|
|
Milani JP, Manney RT, Uno EG (1992). Science, An Ecological Approach. (7thEd.) Kendull/Hunt Pub. Company, Dubugue pp. 659-664.
|
|
|
|
|
Montgomery CW (1992). Environmental Geology. Brown Publishers, New York 465 p.
|
|
|
|
|
Nwankwoala HO, Udom GJ (2011). Patterns of groundwater chemistry and ionic ratios in the aquifer systems of Port Harcourt, Nigeria: Implications for saline water intrusion. International Journal of Scientific & Technology Research 10(1):55-62.
|
|
|
|
|
Otto W (2014). Access to drinking water and stakeholder action-Drinking water governance in Cameroon from a political-ecological perspective case study. Upper Mefou Watershed, Cameroon. Department for Geographical Development Studies Freie Universität Berlin, Berlin, Germany.
|
|
|
|
|
Regnoult JM (1986). Synthese Geologiques du Cameroun. Ministere des Mines et de l'Energie. Yaounde. SODEXIC. Cameroun. 119p.
|
|
|
|
|
Rosborg I (2015). Drinking water minerals and Mineral Balance.
View
Crossref
|
|
|
|
|
Tening AS, Chuyong GB, Asongwe GA, Fonge BA, Lifongo LL, Mvondo-Ze AD, Suh EC (2013). Contribution of some water bodies and the role of soils in the physicochemical enrichment of the Douala-Edea mangrove ecosystem. African Journal of Environmental Science and Technology 7(5):336-349.
|
|
|
|
|
Tening AS, Asongwe GA, Chuyong GB, Fonge BA, Mvondo-Ze AD (2014). Heavy metal status in the Rio del Rey mangroves of Cameroon. International Journal of Current Microbiology and Applied Sciences 3(12): 701-717.
|
|
|
|
|
Todd DK (1980). Groundwater Hydrology. John Willey and Sons, (2nd Ed) New York, USA. 535p.
|
|
|
|
|
Treadwell BV (2011). Calcium to Magnesium: How the ratio affects your health. Juven on Health Journal 10(5)-May 2011.
|
|
|
|
|
UNICEF/WHO (2012). A Snapshot Progress towards the MDG Drinking water and Sanitation Target. WHO/UNICEF Joint Monitoring Programme for Water Supply and Sanitation from Progress on Drinking Water and Sanitation. 2012.
|
|
|
|
|
World Health Organization (WHO) (2008). Guidelines for Drinking-Water Quality (3rd ed.) 664 p.
|
|
|
|
|
Vaishali P, Punita P (2013). Assessment of seasonal variation in water quality of River Mini, at Sindhrot, Vadodara. International Journal of Environmental Sciences 3(5):1424-1436.
|
|
|
|
|
Wotany ER, Ayonghe SN, Fantong WY, Wirmvem MJ, Ohba T (2013). Hydrogeochemical and anthropogenic influence on the quality of water sources in the Rio del Rey Basin, South Western, Cameroon, Gulf of Guinea. African Journal of Environmental Science and Technology 7(12):1053-1069.
|
|
|
|
|
Yidana SM (2010). Groundwater classification using Multivariate Statistical Methods: Southern Ghana. Journal of African Earth Sciences 57:455-469.
Crossref
|
|


