As result of compounding factors related to environmental, social, economic and political pressures, it is feared that the impacts of climate change and variability may overwhelm resilience of urban systems in developing countries if adaptation and mitigation strategies are not strengthened. Understanding how the urban residents perceive and respond to climate change is necessary for the purpose of formulating informed adaptation and mitigation strategies. This study was designed to assess the level of awareness, knowledge, attitude and mitigation preferences among residents of Nairobi City County. A cross-sectional survey design was adopted where 404 households were selected through random sampling from different administrative villages in Nairobi city. Though majority of the respondents had heard about climate change before, a knowledge gap in understanding specific issues of climate change in cities was evident. Study respondents had a greater understanding of climate change signs and effects that are directly related to weather patterns such as changes in temperatures and rainfall patterns compared to the more complex and indirect environmental issues related to climate change in cities. A similar behavior was observed in the choice and preference for long term climate management strategies. Educational status emerged as top social demographic attribute that influenced respondents’ level of awareness, knowledge, worry and concern towards climate change in cities. In order to build resilience to climate change effects for urban communities, these critical factors must be considered when developing or reviewing policies and programs, and the study suggests for more public awareness programs to boost understanding of these factors among residents of Nairobi.
The debate on climate change has been surrounded by a lot of controversies though the evidence presented in the Fourth Assessment Report of IPCC suggest that climate change is experienced all over the world and the
influence of anthropogenic activities are very significant (IPCC, 2001; Sheppard, 2005; IPCC, 2007; OECD, 2010; Grover, 2011; Falaye and Okwilagwe, 2016).
Climate change may potentially damage every natural and human resource on earth (Garnaut et al., 2008) and the third world countries are most affected by the climate change as they have low-level response strategies to climate change (Ashraf and Wahaband, 2006; Feiden, 2011). Gleeson (2008) and Govindarajulu (2014) argued that urban systems are a constantly evolving spatial product of the flow of the social-economic, infrastructural and ecosystem systems and as a result they are seen as the key drivers of climate change and; while being principle emitters of greenhouse gases (GHGs), cities are the most vulnerable to the impacts of climate change (Dreyfus, 2013; Govindarajulu, 2014). The poor in developing nations will be more vulnerable as they tend to live in informal settlements that are more exposed to the ravages of extreme weather patterns (Feiden, 2011).
Mitigation and adaptation strategists are the only solutions to build resilience to climate change impacts in cities (Sheppard, 2005; IPCC, 2007; Semenza et al., 2008; OECD, 2010; Sheppard, 2005 and Mathews, 2011). Perception is the process by which individuals receive stimuli or information from the environment and modify it into psychological awareness (Vedwan and Rhoades, 2001). Notably, people often act based on their perception and as so studying people’s perception is critical component of socio-political contexts within which policymakers in cities operate (Leiserowitz, 2006; Yu et al., 2013; Crona et al., 2013). Public support or opposition of climate change policies and strategies that include treaties, regulations, taxes, subsidies among others will be influenced significantly by how people perceive the dangers and risks of climate change (Leiserowitz and Pidgeon, 2006).
Climate change awareness in African is poor as many people are poorly informed about climate change (Godfrey et al., 2009; Tadera, 2010; Barimah, Kwadwo and David, 2015) compared to developed countries where studies have shown that people in these countries are likely to perceive climate change as a threat compared to people living the developing nations despite people living in these nations been more vulnerable to climate change impacts (Otieno et al., 2009). While the principles of public inclusion in Kenya are supported by various policies, legislation and initiatives such as the National Constitution of 2010, Environmental Management Coordination Act (EMCA)1999/2015, the National Climate Change Response Strategy (NCCRS) 2010, National Climate Change Action Plan (NCCAP) 2013 to 2017, and National Adaptation Plan (NAP) 2015 to 2030, which describe the actions to be taken by all players to adapt, mitigate and build climate change resilience, the status of climate change awareness among city resident’s in Kenya is largely unknown (Otieno et al., 2009). On the contrary, many studies in Kenya have focused on assessing climate change perception of farmers and pastoral communities in various parts of the country (Adimo et al., 2012, 2016 Silvestri et al., 2012; Ndambiri et al., 2013). Additionally, With the rapid urbanization currently taking place in most African cities (Hope, 1999; Chirisa, 2008), such as Nairobi city, it is important for city managers and policymakers to understand how urban residents experience climate change impacts and their responses in order help them provide informed strategies for building resilience to climate change in cities. This paper has therefore, examined household awareness, perception, and preference to long-term adaptation and mitigation strategies of climate change through cross-sectional approach among Nairobi city residents towards building policy framework and management options of climate change. Lastly, the paper has examined how different socio-demographic attributes such as gender, age, educational status and number of years lived in Nairobi could have influenced perception towards different climate issues in the city.
Study area
The study was carried out in Nairobi the capital city of Kenya. Geographically, Nairobi extends between longitudes 36° 40’ and 37° 10’ E and latitudes 1° 09’ and 1° 28’ S, covering an area of about 689 km2. The average altitude is approximately 1795 m above sea-level with a mean biannual rainfall of about 900 mm. The vegetation varies from grassland to scattered acacia trees in the east to remnants of hardwood forests in the higher areas to the west. Land use within the study area is divided roughly into urban use, agriculture, rangeland and remnants of tropical forests. Large areas of the forests, however, have been deforested as a result of both the agricultural and urban expansions. Nairobi City has a population of about four million people with population densities varying widely within the city. On average, Nairobi has a population density of 4, 515 people/km2, though, population distribution differs significantly with low- income areas having high population density compared to high-income areas (Kenya National Bureau of Statistics, 2015).
Sampling and data collection procedures
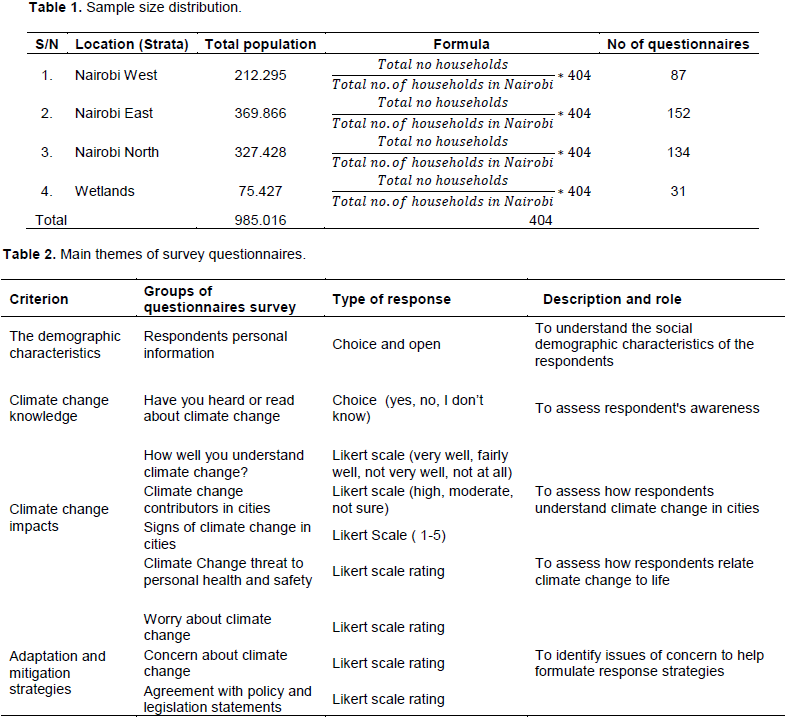
The study targeted all the households in Nairobi City County. According to the 2009 population census, there were 985,016 households within a population of 3.5 million people in Nairobi (KNBS, 2009). According to 2009 KNBS population data, Nairobi city was stratified into four districts (strata); namely Nairobi West, Nairobi East, Nairobi North and Westland. From each stratum, systematic sampling was done to select administrative units (villages) where data was collected. Within the villages, simple random sampling was done to select households for questionnaires. The sample size was determined using Krejcie and Morgan formula and table (Krejcie and Morgan, 1970) and 404 participants were considered for the study while later 397 questionnaires considered for analysis as presented in Table 1. A response rate of 98.26% was considered adequate for this study as it fell above the 75% response rate recommended by Kelley et al. (2003).
Initially, enumerators were trained on contents of the questionnaires tool including how to select households, how to approach the respondents and inform them the purpose of the survey and ethical issues related to the study including the provision of true information as well as seeking the consent of respondents before administering questionnaires to them. The data collection exercise started on July 15, 2018, to July 28, 2018, with pretesting of questionnaires with the enumerators after which arising issues were addressed. During the data collection exercise, the principal researcher ensured quality control of data collected by monitoring performance of data collectors and regular checks of data collected to evaluate completeness. These checks helped ensuring that no data was missing and to detect errors. It took five to seven minutes for the participants to answer the questionnaire and ensure that it truly reflected their immediate experience on climate change. The surveys were conducted on weekdays between 9 a.m. and 5 p.m. (Table 1).
The response format is as outlined in Table 2 with 8 detailed questions that gauged the respondents' awareness, knowledge and attitude on climate change in cities as well as their preference on different adaptation and mitigation plans The socio-demographic information about the respondents was also collected including their names, gender, age, educational status, number of years lived in Nairobi, location as well as their occupations. A set of questions assessed climate change awareness among respondents, sources of climate information, perceived causes of climate change, signs of climate change in their environment, concerns of respondents on climate change as well as perception on different policy statements drawn from different urban sectors (Table 2).
Statistical analysis
The researcher used computer-aided statistical packages to analyze data obtained from the study. Particularly, Statistical Package for Social Scientists (SPSS) series 24 was used for data analysis. Firstly, all completed questionnaire were investigated for completeness and consistency, then a numerical coding of qualitative responses was done for ease of storage and analysis. The numerical codes were entered into SPSS and analysis commands ran to test hypothesis on climate awareness, perception and preference to long-term mitigation strategies for climate change impacts. Data analysis involved both simple descriptive such as frequency counts, percentages, means and standard deviations to summarize the data and inferential statistics such as correlation analysis, chi- square, Kruskal and Mann-Whitney tests to determine statistical significance of respondents’ social-demographic characteristics to major issues that were investigated in this study. The hypotheses were tested at statistical confidence level of 95%.
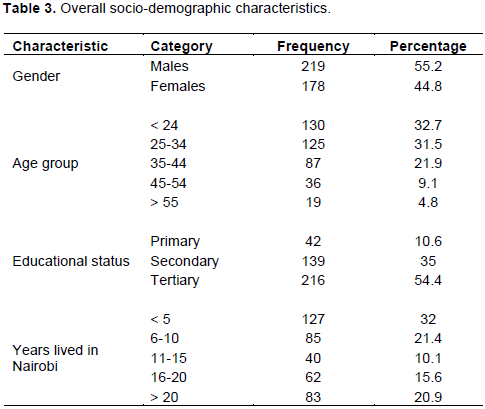
Table 3 presents a result summary of the socio- demographic characteristics of respondent households. The sampled population consisted of 55.2% (n = 291) males and 44.8% (n= 178) female. Gender is a good predictor of climate change because different genders are affected by climate change differently and hence both groups could have different perspective on climate change issues (McCright, 2010). Majority of the respondents were below 24 years (32.7%) and between 25 to 34 years (31.5%) of age. Age is a critical predictor of respondent’s familiarity with weather events and studies have shown a positive correlation between age and climate change familiarity (Saroar and Routray, 2010; Ochieng and Koske, 2013). Majority of the respondents (54.4%) had attained tertiary education (colleges and universities) followed by 35% of those had achieved secondary education. Educational status is seen as another major predictor of public knowledge and attitude. Studies on climate change have shown that people with high level of education were likely to be informed on climate change issues (Aquah, 2011; Adebayo et al., 2013). Majority (32%) of the residents had lived in Nairobi for less than 5 years followed by 21.4% for about 6 to 10 years. The number of year lived in a certain area could probably reflects individual’s experience with climate change events in that area.
Level of awareness about climate change among respondents
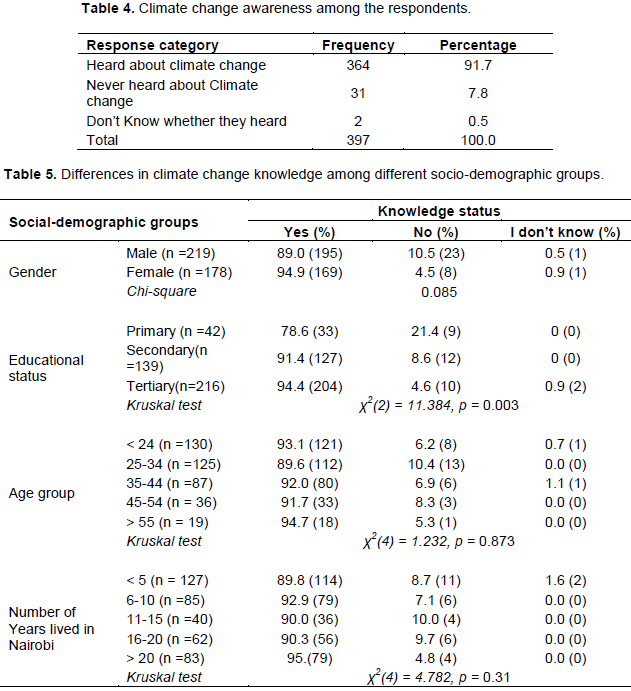
As a guiding question on respondent’s awareness, the first question sought to determine whether the respondent had heard about climate change previously. Results of this analysis revealed that majority (91.7%; n =364) of the respondents had heard about climate change while 7.8% (n= 31) had not heard about it as presented in Table 4.
The findings of this study support numerous studies that have been done in the past decades. For instance, a study conducted by Lorenzoni and Pidgeon (2006) to collect public views on climate change in Europe and USA found that public awareness had increased tremendously from 65% in early 1990’s to over 72% in early 2000’s. Thus, 91.7% awareness level among Nairobi residents could mean that the both international and local climate change awareness is on rise and more people are becoming aware of climate change (Table 4). Table 5 presents a statistical summary showing the differences in climate change knowledge between different demographic groups.

A positive climate change awareness was found across all groups outlined in Table 5. There was no statistical differences in age group (χ2 (4) = 1.232, p = 0.873) and the number of years some had lived in Nairobi (χ2 (4) = 4.782, p = 0.31) and level of climate change awareness. However, a statistical difference (χ2 (2) = 11.384, p = 0.003) was found between the level of awareness and the educational status of the respondents. These results can be supported by study conducted by Oruonye (2011) which found that students in tertiary levels of education were more aware of climate change based on the question that asked whether the respondents had heard about climate change before. The results of this study also support other studies by Aquah (2011) and Adebayo et al. (2013) which singled out educational status as main predictor of climate change awareness.
While results of this study may be taken to mean that majority of Nairobi’s residents are extremely aware of climate change such as conclusion might be misleading because hearing about climate change does not translate to understanding deep issues related to it. This can be attested by a study done by Oruonye (2011) which revealed that majority of college/university students were aware of climate change based on the survey question whether they heard of it before. A further probe of same respondents revealed that majority (89%) them did not understand deep issues of climate change thus arriving into a conclusion that majority of students in high levels of education in Jalingo Metropolis had low awareness on climate change. To overcome this challenge, respondents of this study were subjected to more focused and objective questions in order to reveal their level of awareness and perception on climate change in order to make a more informed decision about their perception and understanding of climate change in cities.
Understanding climate change
The assumption of this study was that the respondents who heard about climate change previously should be able to understand deep issues of climate change compared to those who had not heard about it. Therefore, to test consistency of climate awareness, survey participants were requested to provide their feedback on a likert-scale tool ranging from 1 to 4, where 1 represented very well, and 4 denoted not at all indicating their level of understanding of climate change in cities.
Table 6 presents the descriptive statistics of the responses obtained. An overwhelming majority of 28.5 and 51.9% felt that they understood climate change very well and fairly well respectively. While a minority of 8.85% felt that they did not understand at all (Table 6). To understand how different demographic attributes affected level of understanding of climate change, a cross- tabulation was done and the statistics are as shown in Table 6 (Table 7).
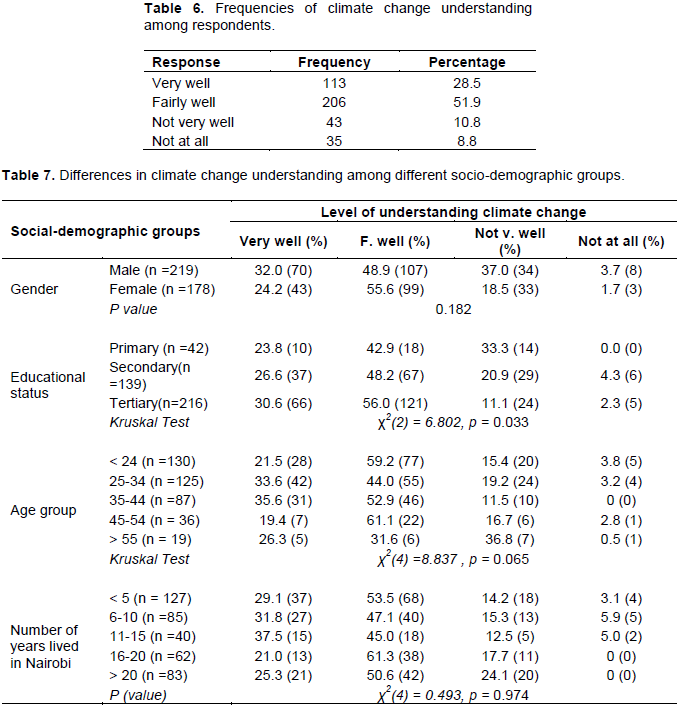
The results of this analysis show that there was statistical difference (χ2 (2) = 6.802, p = 0.033) between the educational status of the respondents and level of understanding climate change. This could be translated to mean that educational status improved individual’s understanding of climate change compared to other social demographic attributes where no statistical differences were found between age of the respondent (χ2 (4) =8.837, p = 0.065) and number of years the respondent had lived in Nairobi ( χ2 (4) = 0.493, p = 0.974) and their level of understanding climate change in the city.
The findings of this study support the studies done by Aquah (2011) and Adebayo et al. (2013) which attributed education as a major predictor of level of awareness and knowledge on climate change. Thus, according to this study, it highly probable that someone who had achieved high level of education was more likely to have some deep understanding of climate change issues as well as management practices that can be used to control climate change in urban setting. Additionally, these group are more likely going to embrace and support any mitigation strategies and policy framework that sought to find short and long-term solution to climate change.
Perception on causes of climate change
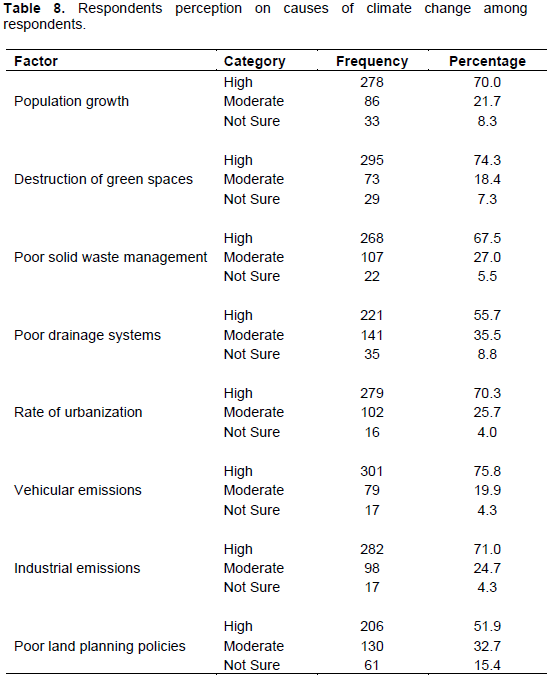
Apart from knowing how well respondents understood climate change in cities, knowledge on specific factors that are responsible for climate change in cities is another measure of public awareness on urban climate change. This was achieved by presenting respondents with a list of factors that majorly contribute to climate change in cities for them to indicate their level of agreement with each factor. Results of the analysis of the responses are presented in Table 8.

Results of this study revealed that respondents were unaware of the causes of climate change in urban areas though knowledge gaps between different causes were evident. Vehicular emission emerged as the most significant cause of climate change supported by 75% (n= 301) of the respondents followed closely by destruction of green spaces and forests that was supported by 74% (n = 295) of the respondents. Industrial emission received an approval of 71% followed by population growth and urbanization rates received an approval of 70% from the respondents.
On global context, a study by Lorenzoni and Pidgeon (2006) revealed that most citizens in the US and Europe had no clear understanding of various causes of climate change as many respondents indicated deforestation and air pollution as main causes despite them being secondary to burning of fossil fuels. However, this study indicated that majority of residents in Nairobi were aware of the contribution of fossil fuel burning and deforestation in driving climate change.
Locally, these results reaffirm the results of Otieno Pauker and Maina (2009) and Ochieng and Koske, (2013) which showed that majority of Kenyans viewed destruction of forests and pollution as major drivers of climate change. The authors further opined that Kenyans understood climate change based on their daily environmental experiences and thus global aspects of climate change like GHG emissions remain abstract in their understanding.
Evidently, respondents expressed limited knowledge on the role of land use and zoning policies, and drainage control with an approval rating of 51.5 and 55.7% respectfully in relation to climate change in cities indicating that respondents were unware of the role of these factors in driving climate change in cities. These result could be interpreted to mean that most Nairobi residents are only aware of climate change drivers which are directly linked with pollution (industrial and vehicular emissions), population and urbanization growth. Also, these result show limitation in knowledge about different causes of climate change because, for instance, land policies stand at the heart of climate change in cities as they influence all other critical sectors linked with climate change in cities such transport orientation and resource management.
In addition, poor land use policies could mean unprioritised land allocation including green spaces, poor transport networks meaning more traffic problem and as result more emissions among others (OECD, 2010). On the other side, poor drainage systems may also lead to flooding in cities due to blocked drainage channels and result more casualties and spread of waterborne diseases such cholera.
Perception on signs and effects of climate change
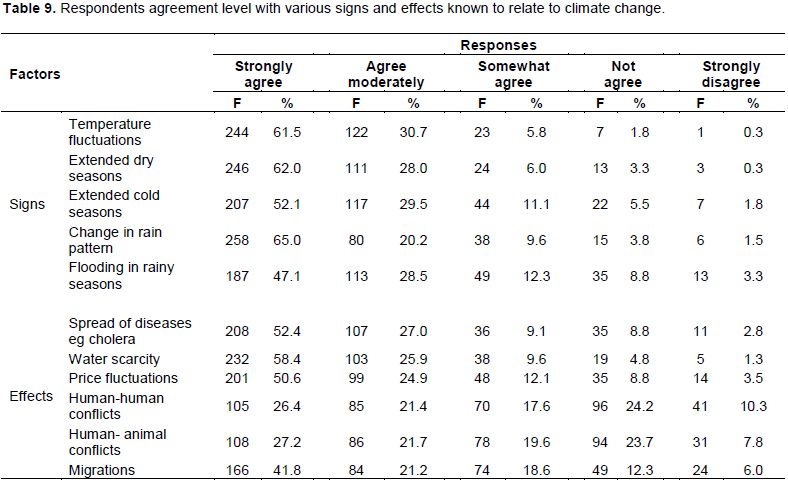
A study by Lorenzoni and Pidgeon (2006), revealed that most studies on climate change perception have indicated some shared views across the world. In particular, the study found that there is a widespread awareness and concern about climate issues; limited understanding of causes of and solution to climate change, perceived psychological, temporal and spatial distant threats on climate change and some willingness to address the perceived threats through defined measures as well as ascription of individual responsibility to take measures against climate change. To test these factors, residents’ awareness and perception was examined through their knowledge of specific signs and of climate change. It was assumed that residents who were more familiar with various contributing factors should know at least little about signs of climate change. Results of this analysis are presented in Table 9.

The outcome of these results show that majority of the residents perceived temperature fluctuations 92.2% (strongly agree and agree moderately) as the main sign of climate change. This was followed by 90 and 85.2 % of residents who perceived extended dry seasons and change of rain patterns as the key signs respectively. Similar to the results of the causes of climate change, it was confirmed that residents perceived signs that seemingly interfered with their day-to-day activities as major signs of climate change. A study by Hares, Dickinson and Wilkes (2010) support this observation as it found that the most dominant understanding of climate change was linked to changes in weather patterns that survey participants had personally observed in their lifetime
Perception and understanding on effects of climate change revealed that majority of the residents perceived water scarcity as the major effect of climate change with an approval rating of 84.3% (strongly agree and agree moderately) followed by 79.4 and 75.4% spread of diseases and price fluctuations of agricultural commodities. On the lower end, human-human conflict, human-animal conflicts and migrations from one area to another due to limited resources received an approval rating of 47.8, 48.9 and 63.0% respectively. Again, these results revealed the constant knowledge gap and low interpretation of deep issues related to climate change among residents of Nairobi.
In essence, respondents seem to constantly rate issues that affected them on daily basis high compared to those which affected them based on the season of the year. For instance, due to water scarcity in 2017 many cholera cases were reported in Nairobi (GoK, 2017; Daily Nation, 2017a,b; WHO, 2017) implicating spread of infectious waterborne diseases. Also, there has been significant fluctuations in prices of basic agricultural food commodities (Agricultural and Food Authority, 2018; Daily Nation, 2017a,b; The Star News, 2017) due to poor rains that have been experienced in the country. Although climate change factors could have played a significant contribution to varied pricing, other pressing issues such as unemployment and political situation could have masked this influence.
Individual attitude towards on climate change among Nairobi’s residents
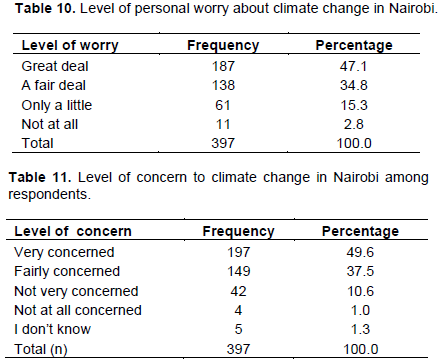
Over the past decades, studies undertaken to examine the trend in worry and concern about climate change have served to provide a general indication of how people view matters of climate change. Notably, studies conducted in 1988 in the 12 EC member states showed that 76% of the respondents were very/somewhat worried about climate change. Similar studies within the same area showed an increase in concern to 89% 1992 though a decline to 84% in 1992 and 39% in 2002 (Lorenzoni and Pidgeon, 2006). Another study in 2002 showed that Europeans were worried about future changes in climate change though despite the high level of concern detected in these studies, the importance of climate change remained a secondary compared other environmental, personal and social issues (Lorenzoni and Pidgeon, 2006). This study noted some consistency with these studies as 47.1% of respondents were worried to great deal and 34.8% to a fair deal.
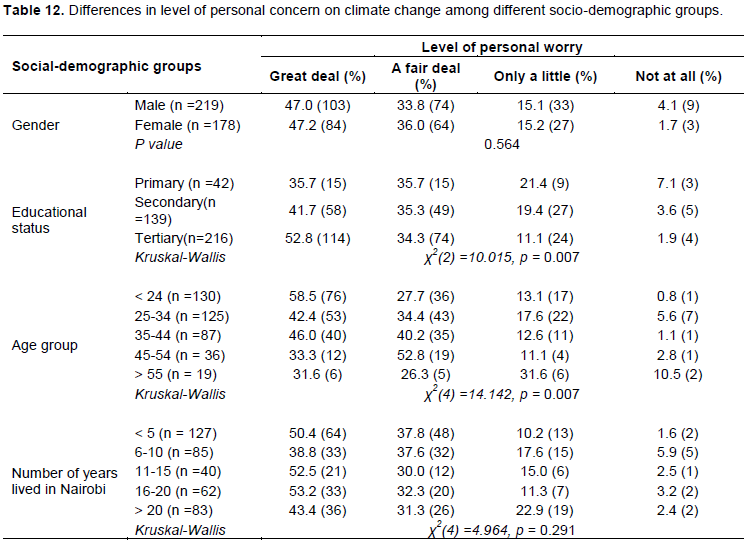
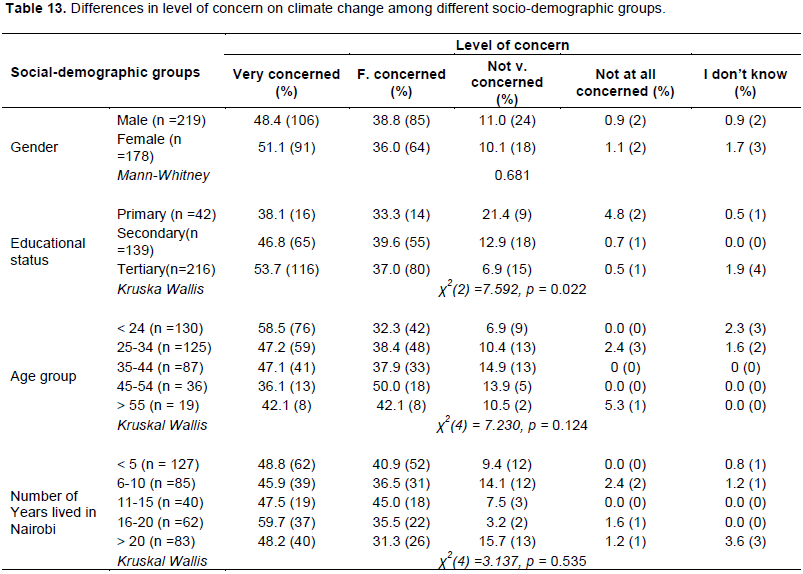
Similarly, 49.6% were very concerned and 37.5% were fairly concerned about climate change. Both the results for level of worry and concern showed some consistency meaning that both factors influenced the respondent’s response to some extent. Descriptive statistics for these analyses are provided in Tables 10 and 11. To further understand how demographic characteristics influenced individuals’ worry and concern towards climate change a cross-tabulation was done and statistical summaries are presented in Tables 12 and 13.
Results of personal worry analysis revealed that both educational status (χ2 (2) =10.015, p = 0.007) and age group (χ2 (4) =14.142, p = 0.007) of the respondents were statistically significant. Similarly, results of level of concern versus educational status were statistically significant (χ2 (2) =7.592, p = 0.022), thus, supporting findings of other studies that have singled out level of education as key predictor of climate change awareness. Even though age did not influence one’s level of concern (χ2 (4) =7.230, p = 0.124) as some studies have previously indicated, the findings of this study are consistent the findings of Owolabi et al. (2012) and Saroar and Routray (2010) indicating that age group influenced personal worry and concern on climate change on the respondents. Also, studies have shown that age influences personal experience with different climatic conditions and as such old people are likely going to view climate change differently from young inexperienced people.


On the contrary to a study by McCright (2010) which compared different studies that had been done previously on public views on climate change indicating that women were more worried and concerned about climate change compared to males; this study did not find any statistical difference among its respondents (p = 0.564 and > 0.05) and (p = 0.681 and > 0.05) respectively. Similarly, contrary to studies that have indicated that the amount of time one has lived in an area could probable influence their level of worry and concern, this study found no statistical difference (χ2 (4) =4.964, p = 0.291) and (χ2 (4) =3.137, p = 0.535) between number of years the respondents had stayed in Nairobi and their level of worryand concern respectively.
Preferences to long-term mitigation climate change management strategies
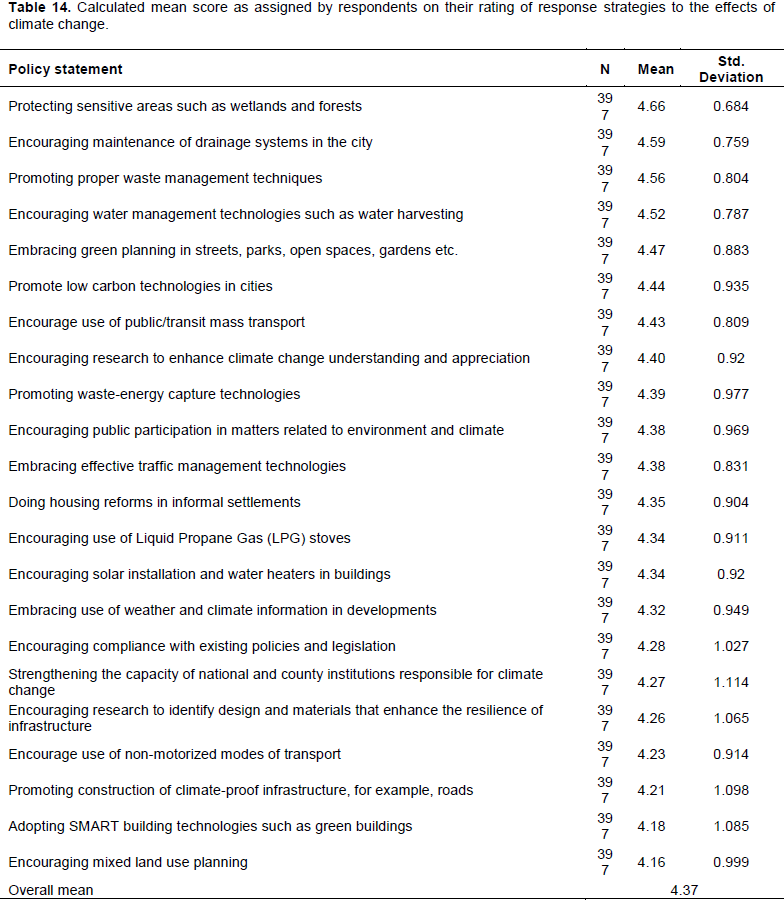
To examine the level of policy awareness among respondents, a set of mitigation and adaptation strategies were put together cutting across different sectors concerned with climate change management in cities. Participants were then asked to indicate their level of agreement or support to each strategy statement and rank based on a Likert-scale tool ranging from 1 to 5, where 5 represented strongly agree and 1 denoted I don’t know. Table 14 shows the calculated mean scores per tested strategy. A mean of 1 to 2.5 indicates that the element in intervention has been adapted to a small extent while a mean of 2.6 to 5 shows that the factor has been employed to a large extent.
The results of this study show that Nairobi residents are aware of different adaptation and mitigation strategies though gaps on their knowledge are evident. The respondents recorded an overall mean score of 4.37 meaning that they were aware of different mitigation strategies. Most of the study respondents had a tendency to agree or strongly agree with the strategies presented in the questionnaire, but still, there some substantial minority who disagreed or said “don’t know” with various strategies, thus, indicating limited knowledge on climate change issues in cities.
Comparing the nature of strategies presented to respondents, majority of them seemed to agree with strategies that directly linked with their daily environmental issues such as, protection of sensitive areas such as Nairobi's river bank, forests, watersheds and other reserved areas from encroachment" which received their highest approval with a mean of 4.66 (SD= 0.684. This was followed closely by “Encouraging proper maintenance of drainage systems to manage flooding in rainy seasons” (M= 4.59, SD=0.759) and “Promoting proper waste management techniques to reduce drainage blockages and emissions from wastes” (M=4.56, SD= 0.804). “Encouraging water management technologies among city residents such as water harvesting, good water usage in households” was represented with a mean of 4.52 (SD= 0.787). Evidently, waste management, drainage issues after light rain showers, water scarcity, and destruction of protected areas have been affecting Nairobi residents more often the reason as to why manage strategies related to them could have received high approval from the residents. The study established a knowledge gap in among mitigation management strategies majorly because their action plans could be indirect and thus difficult for an average person to interpret. For instance, “Mixed land use development” with a mean of 4.16 (SD 0.999) was the least preferred management strategy despite its immense role in climate change intervention in cities. For example, effective land use and zoning policies and strategies would ensure effectiveness of the transport sector by encouraging mixed developments plans thus reduced trips translating to reduced vehicular emissions and general reduction in GHG emission.

Also, these management strategies would ensure adaptation strategies are affected including preserving of land resources such as forests, providing for more open spaces and green spaces within the cities (OECD, 2010). Other mitigation management strategies such as use of green building technologies, construction of climate-proof infrastructure, use of non-motorized modes of transport among other indirect management strategies also reviewed a low rating thus attesting low understanding of the immeasurable role these strategies can play in climate management in cities.