ABSTRACT
This study investigated the influence of variety, processing methods and their possible interactions on the biochemical composition of green coffee beans. The results revealed that the biochemical composition was significantly affected by the interaction effect of variety and processing methods. As compared to coffees processed in semi-washed and dry method, the highest total chlorogenic acid (TCGA) content was obtained in coffee varieties 74-112, 74-110 and 74-165, processed by washed method. The washed processing method also enhanced the caffeine content of the coffee beans. The highest value was observed in the coffee varieties 74-4, 74-112 and 74-165. The dry method, on the other hand, increased the sucrose content and the highest value was obtained in the varieties 74-110, 74-140 and 74-148. In general, the present study indicated the existence of variation in biochemical composition of Ethiopian Arabica coffee varieties and is influenced by the different processing methods. This study, however, was carried out with coffee varieties grown under same growing conditions and did not consider season variation. Therefore, it is advisable to further evaluate with more number of coffee varieties grown in different growing environments and seasons.
Key words: Processing methods, green beans, caffeine, chlorogenic acid, sucrose.
Coffee is one of the most consumed beverage by more than one-third of the world’s population
(DaMatta et al., 2018;
Samper et al., 2017). Awareness of quality and health benefits of coffee among consumers is increasing the demand for coffee consumption in both developed and developing countries (
Cheng et al., 2016;
Ryota, 2018). Coffee is grown in more than 80 countries in tropical and subtropical regions of the world and is exported in green or roasted beans to more than 165 countries (
Abreu et al., 2012). The crop accounts for 75% of export revenue and provides livelihoods for smallholder coffee producers around the world (
WIPR, 2017). According to the statistical report of
ICO (2018), 158.9 million bags of green coffee beans have been produced in 2017/2018.
Ethiopia is the largest coffee producer in Africa and is the 10th exporter in the world
(ICO, 2018). Arabica coffee is known as backbone of the country's economy, accounting for 22% of the export (
Bart, 2018). The country is naturally gifted with a suitable climate and has the potential to produce single origin specialty Arabica coffee beans with a wide range of flavours (Coste et al., 1992; Labouisse et al., 2008). On global markets, Ethiopia’s Arabica coffee is valued for its unique taste and aroma. For the country itself, this makes Arabica coffee one of the most traded commodities with a significant social and economic impact for more than 25 million farmers (
WIPR, 2017). Furthermore, premium price (ca. $7-8 per kg of coffee beans) is being paid for specialty coffee of some specific origin such as Harar, Yirgacheffe and Sidama. Thus, an increased specialty coffee market is beneficial for Ethiopia to remain competitive on the international market, provided that the country produces high quality coffee and the supply remains stable.
The inherent quality and compositional characteristics of coffee beans are, however, among others, controlled by interacting effects of genetic trait
(Bertrand et al., 2006;
Leroy et al., 2006), growing altitude (
Avelino et al., 2005;
Tolessa et al., 2017;
Worku et al., 2018), shade management (
Avelino et al., 2007;
Tolessa et al., 2017;
Worku et al., 2018), harvest periods (
Guyot et al., 1995;
Guyot et al., 1996;
Tolessa et al., 2017) and postharvest processing technique (
Duarte et al., 2010;
Joët et al., 2010;
Selmar et al., 2002;
Tolessa et al., 2018).
The chemistry of coffee quality is highly complex with a wide range of compounds that are found in green coffee beans. Caffeine (0.9 to 3%), chlorogenic acids (CGA, 5 to 8%) and sucrose (7 to 11%) are the key compounds found in coffee beans
(De Castro and Marraccini, 2006;
Ky et al., 2001). These chemical constitutes are considered as precursors for coffee cup quality attributes e.g. aroma and flavour
(Cheng et al., 2016;
Joët et al., 2010). For example, sucrose and trigonelline give rise to a very good flavour. Sucrose also acts as aroma precursor, originating several substances (e.g. furans, aldehydes and carboxylic acids) affecting both flavour and aroma of the beverage (
Farah et al., 2006b). It reacts with amino acids to produce pyrazines and carbonyl compounds, which are involved in flavour formation (
Feldman et al., 1969). Furthermore, sucrose to amino acids ratio in green beans determines also profile of volatile compounds, explaining coffee quality attributes (
Tressl et al., 1982).
The species and genotype of the coffee plant can also play an important role in the biochemical compositional content of green coffee beans
(Ky et al., 2001;
Leroy et al., 2006). In the past four decades, Jimma Agricultural Research Center has developed and distributed improved Ethiopian Arabica coffee varieties which are high yielding, with disease resistance and adaptability to different agro-ecological zones (
Tirfe et al., 2015). The existence of a wide diversity for quality trait has also been reported elsewhere (
Abeyot et al., 2011;
Kitila et al., 2011).
Van der Vossen (1985) also reported significant differences in cup quality attributes among different Arabica coffee cultivars and their crosses.
However, studies exploring the combination of biochemical compounds present in these varieties still lack more detailed analysis. The metabolic reactions in coffee seeds occurring during different processing methods also affect the chemical composition of the green beans. Thus, the changes in chemical composition of coffee beans in response to different postharvest processing methods are also not fully understood. Therefore, the present study has been initiated to determine the biochemical composition of ten coffee berry disease (CBD) resistant Ethiopian Arabica coffee varieties in relation to different postharvest processing methods.
Study site
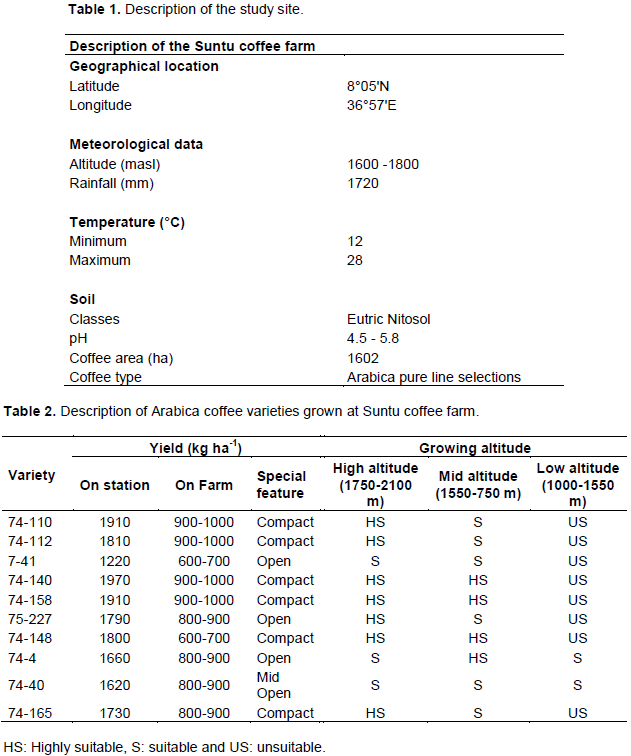
The experiment was conducted at Suntu coffee farm, under Limu coffee plantation, Oromia, Ethiopia, during the 2012/2013 cropping season. It is located in the Oromia regional state, Jimma Zone, Limmu Kossa district, at 410 km distance from Addis Ababa and 75 km from Jimma town. The total area coverage of the farm was 1602 ha and the coffee was produced for both the local and international market. This study area was selected based on the availability of the top ten leading CBD coffee varieties. The description of the study site is shown in Table 1.
Study material and experimental design
Ten coffee berry diseases (CBD) resistant Arabica coffee varieties (Table 2) were used for the study. These varieties were the top ten leading coffee varieties producing a large number seeds. They were supplied to the farmer by the Jimma Agriculture Research Center over the last four decades (1979-2010) (Kufa et al., 2011). Some differences were observed among these coffee varieties with regard to their popularity, adaptability, as well as preference and demand by the users (Kufa et al., 2011). Three hundred randomly selected shade grown coffee trees with similar age range (5 to 6 years old after stumped) were used as sources of red ripen cherries for each variety (Table 2).
About 21 kg fully ripen, red coloured coffee cherries were collected per variety and subjected to three (each of 7 kg coffee cherries) processing methods: dry (without washing), semi-washed (partial washing) and washed (fully washed). The experiment was arranged in a split plot design with ten levels of varieties as main plot and three levels of processing methods as sub-plot with three replications (farms). Moreover, the detailed coffee cherry processing procedures are presented in Tolessa et al. (2016).

Analyses of caffeine and chlorogenic acid
Caffeine and chlorogenic acid content were analyzed as described by Alonso-Salces et al. (2009a). Ground green coffee beans (100 mg) were submitted to direct solvent extraction with 10 mL of methanol/water/acetic acid (30:67.5:2.5, v/v/v) containing 2 mg mL-1 ascorbic acid in an ultrasonic bath for 15 min. Then, the solvent extract was filtered through a 0.45 μm PTFE filter prior to injection into the HPLC having a prevail C18 (250 × 4.6 mm, i.d. 5 μm, 25°C) column. The mobile phase composed of 0.2% acetic acid in water (v/v) (solvent A) and methanol (solvent B). The following elution conditions were applied one after the other: the first 0-30 min, linear gradient from 10 to 30% B; 30-40 min, linear gradient from 30 to 40% B; 40-45 min, 40% B isocratic; 45-50 min, linear gradient from 40 to 50% B; 50-55 min, 50% B isocratic; 55-65 min, linear gradient from 50 to 70% B. Flow rate was 1 mL min-1 and the injection volume was 50 μL. Caffeine and chlorogenic acid were detected by a DAD detector at 280 and 320 nm wavelength, respectively.
Quantification and identification of the chlorogenic acids subclasses: caffeoylquinic acid (CQA), feruloylquinic acid (FQA), dicaffeoylquinic acid (diCQA) and feruloyl-caffeoylquinic acid (FCQA) were done using an already established liquid chromatography-time of flight-mass spectrometry (LC-TOF-MS) method (Alonso-Salces et al., 2009b). Total chlorogenic acid concentration is reported as the sum of all the mentioned individual chlorogenic acids. For these variables, data acquisition and processing were done using ChromQuest 4.1 SP2 software.
Sucrose analysis
Sucrose content was determined according to Knapp (1979). First, an internal standard solution was prepared using 600 mg fenyl-beta-D-glucopyranoside and 100 mL distilled water. Ground green coffee beans (0.5 g) were extracted with 25 mL distilled water containing 30 mg of fenyl-beta D-glucopyranoside in a hot water bath at 60°C for 30 min. Carrez I, potassium hexacyanoferrate II K4Fe (CN)6 in water (15 g L-1), and Carrez II, zinc sulfate ZnSO4 in water (30 g L-1), were added to the extract as well as distilled water to obtain a total volume of 50 mL. The extract was filtered over a 0.45 µm PTFE filter and 0.5 mL of the filtrate was dried using nitrogen gas in a HPLC-vial. Then 0.5 mL of “STOX” reagent (hydroxylamine hydrochloride 25 g L-1 in dry pyridine) was added to the dried extract and the vials were placed in an oven at 60°C for 30 min. After cooling the extract to room temperature, 0.5 mL of hexamethyldisilazane (HMDS) and 0.05 mL trifluoroacetic acid (TFA) were added and kept for 60 min to allow phase separation. Finally, 1 µL was taken from the upper layer and injected into a gas chromatograph (GC-3380, Varian, USA) using an automatic injector. The detection was done using a flame ionization detector (FID).
Data analysis
Data were analysed with statistical analysis system software (v. 9.2, SAS Institute Inc., Cary, NC USA), using a mixed model procedure for a split plot design with variety as the main plot and processing methods as sub-plot. Significant differences between treatment means were determined using the Tukey’s honest significant difference (HSD) test.
Biochemical composition of green beans
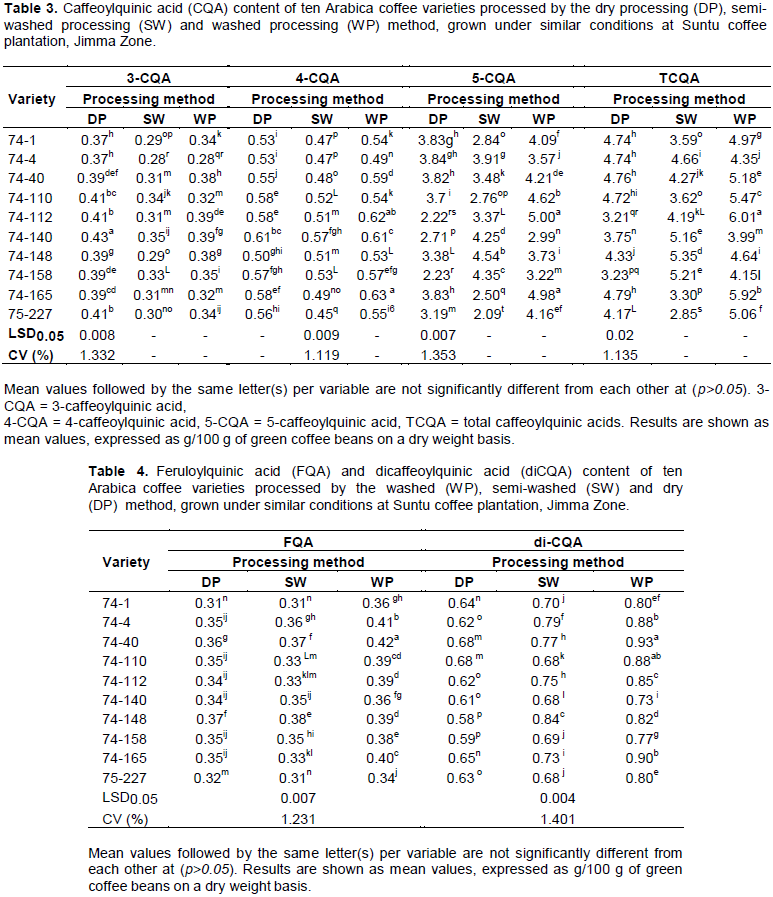
In this study, six sub-classes of chlorogenic acid (CGA): 3-caffeoylquinic acid (3-CQA),4- caffeoylquinic acid (4-CQA), 5-caffeoylquinic acid (5-CQA), total caffeoylquinic acids (TCQA) feruloylquinic acids (FQA),dicaffeoylquinic acids (diCQA) and feruoyl-caffeoylquinic acid (FCQA), caffeine and sucrose were analyzed and compared in ten Ethiopian Arabica coffee varieties, processed by the dry, semi-washed and washed method. The CQA, FQA, diCQA and FCQA content of the ten CBD resistant coffee varieties, processed by dry, semi-washed and washed postharvest processing methods, are presented in Tables 3, 4 and 5.
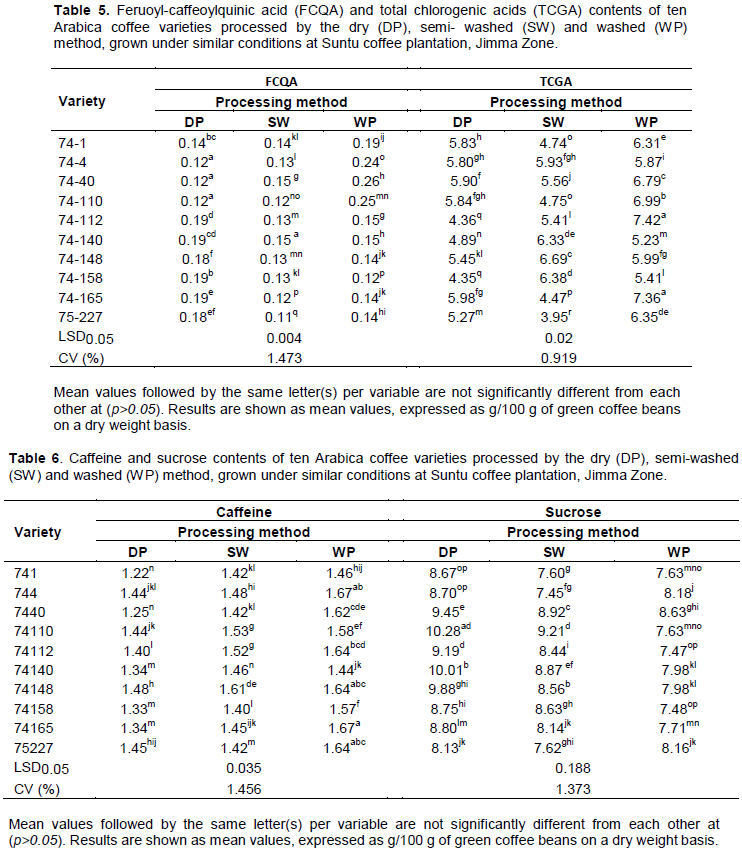
CQA, FQA, diCQA, FCQA and total chlorogenic acid (TCGA) contents were significantly (P < 0.05) affected by the interactions between variety and postharvest processing methods (Tables 3, 4 and 5). TCQA, FQA, diCQA, FCQA and TCGA contents ranged from 2.85 - 6.01, 0.31 - 0.42, 0.58 - 0.93, 0.11- 0.26 and 3.95 - 7.42 g/100 g, respectively. The highest TCQA content was observed in variety 74-112 processed by the washed method (6.1 g/100 g) while the lowest value was observed in variety 75-227 processed by the semi-washed method (Table 3). In addition, the highest FQA (0.42 g/100 g) and diCQA (0.93 g/100 g) were obtained from variety 74-40 processed by the washed method (Table 4). Higher FCQA (0.25 g/100 g) and TCGA (7.42 g/100 g) contents were also observed in variety 74 to 112, processed by the washed method (Table 5).
Caffeine and sucrose contents were also significantly (P < 0.05) influenced by the interaction effects of variety and postharvest processing methods. The highest caffeine content (1.67 g/100 g) was observed in the varieties 74-4 and 74-165, which were processed by the washed method, while the lowest (1.22 g/100 g) content was obtained from variety 74-1 processed via the dry method. Coffee beans of variety 74-110 treated with the dry processing method gave the highest sucrose content (10.28 g/100 g), followed by variety 74-140 (10.01 g/100 g). Coffee beans of variety 74-4 processed by the semi-washed method, on the other hand, gave the lowest sucrose content (7.45 g/100 g) (Table 6).
Biochemical composition of green beans
There are six subclasses of chlorogenic acid (3-CQA, 4-CQA, 5-CQA, FQA, diCQA, FCQA), TCGA, caffeine and sucrose were compared in Ethiopian Arabica coffee varieties processed by washed, semi-washed and dry methods. Several studies have also shown that the mode of coffee processing strongly influences and determines the chemical composition of green coffee beans and thereby the coffee flavour and aroma (Duarte et al., 2010; Joët et al., 2010). The present finding also revealed that variety differences were observed in their chlorogenic acids, caffeine and sucrose contents processed via washed, semi-washed and dry methods. The contents of TCQA, FQA, di-CQA, FCQA and TCGA varied from 2.85-6.01, 0.31-0.42, 0.58-0.93, 0.11-0.26 and 3.95-7.42 g/100 g, respectively. The CGA contents obtained are consistent with previous data for coffee in general (Duarte et al., 2010; Farah and Donangelo, 2006a). Coffee beans processed via the washed method gave a higher CGA and caffeine content than those processed by the semi-washed and dry methods for all varieties. This difference was observed in all subclasses of chlorogenic acids, except for the 3-CQA.
Moreover, the varieties responded differently to different postharvest processing methods. For instance, coffee variety 74-112, 74-165, 74-110 and 74-40 had higher TCGA values (7.42, 7.36, 6.99 and 6.79 g/100 g, respectively) with the washed processing method compared to beans processed with the semi-washed and dry methods. The coffee bean variety 74-227, on the other hand, showed the lowest TCGA content (3.95 g/100 g) when processed with the semi-washed method (Table 5). These results are in agreement with a previous study (Duarte et al., 2010) who reported higher contents of chlorogenic acids for coffee processed by the washed method compared to the semi-washed and dry methods. Balyaya and Clifford (1995) also reported a significant effect of postharvest processing method on total chlorogenic acids and its subclasses. Joët et al. (2010), on the other hand, reported no influence of postharvest processing method on the green coffee beans chlorogenic acid content.
Similar to the CGA content, the washed processing method increased the caffeine content of all coffee varieties. The highest caffeine content, mean value of 1.67 g/100 g, was obtained in varieties 74-165 and 74-4, processed by the washed method followed by the coffee varieties 74-148, 75-227 and 74-112 with mean values of 1.64, 1.64, and 1.64 g/100 g, respectively (Table 6). Compared with the other coffee varieties processed by the semi-washed or washed method, coffee beans harvested from variety 74-1, 74-40, 74-158 and 74-140 and processed via the dry method, respectively, gave a lower 1.22, 1.25, 1.33 and 1.34 g/100 g caffeine content. The differences in caffeine and CGA content between varieties could be attributed to differences in their genetic trait of each variety. A similar finding was also reported by Link et al. (2014). These authors found a significant difference in caffeine content among different genotypes.
In contrast, e.g. Guyot et al. (1995) and others, observed a reduction of caffeine (3%) in coffee beans processed by the washed method as compared to beans processed by the dry method. However, other studies reported that the caffeine content remained unchanged in response to different postharvest processing methods (Duarte et al., 2010; Joët et al., 2010; Leloup et al., 2005). This discrepancy can be explained by differences in growing conditions, varieties, coffee cherry type and postharvest processing conditions (e.g. fermentation time during the washed processing procedure, water quality status and drying conditions). It shows that the biochemical composition of green coffee beans is highly affected and controlled, among others, by interaction effects of growing conditions, genetic traits, harvesting time and postharvest processing techniques. Worku et al. (2018), also recently confirmed the complex interaction effects of growing conditions (e.g. altitude, shade) and postharvest processing on biochemical composition of green Arabica coffee beans.
The relative increase in TCGA and caffeine contents of coffee beans processed by the washed method compared to the semi-washed and dry method could be the loss of other chemical components mainly due to their water solubility nature and effect of thermal degradation (Duarte et al., 2010). Moreover, this might be reinforced by intense metabolic reconversion that occurs during the washing procedure (Joët et al., 2010). Bytof et al. (2005) also reported that various metabolic processes occur inside the coffee seeds leading to changes in chemical composition of green coffee beans e.g. conversion of glutamic acid into γ-aminobutyric acid. These authors also related the metabolic reaction to a physiological stress condition and to the specific type of processing method applied.
Sucrose accounts for up to 11% on dry matter basis of green Arabica beans and acts as aroma precursor (De Castro and Marraccini, 2006; Farah et al., 2006b). The content of sucrose in coffee beans processed by the dry, semi-washed and washed methods ranged from 8.13 to 10.28 g/100 g, 7.45 to 9.21 g/100 g and 7.47 to 8.63 g/100 g, respectively (Table 6). For all Arabica varieties tested in this study, the sucrose content in the beans processed by the dry method was significantly higher than in the beans processed by the other methods. A similar finding was reported earlier for a hybrid coffee variety (Duarte et al., 2010). A higher content of sucrose in dry processed coffee beans was reported compared with washed processed coffees. The reduction of the sucrose content observed in washed processed coffee beans is possibly due to the high water solubility of this compound during washing and soaking. Additionally, sucrose may be depleted as a result of anaerobic fermentation during washed processing methods.
Furthermore, the present study also shows that the sucrose content significantly varied among varieties. A higher concentration was observed for some varieties (74-110, 74-140, 74-148, 74- 40 and 74-112) processed by the dry method (Table 6). The similar response of these varieties might be due to the fact that they have the same genetic background, interacting in the same way in this processing method. In contrast to the present study, a higher sucrose content was found for coffee beans harvested from higher altitude and processed by the semi-washed (Tolessa, 2017) and washed method (Worku et al., 2018) than by dry method. Other studies, on the other hand, demonstrated that sucrose is not significantly affected by the mode of postharvest processing method tested, neither for Arabica nor for Robusta coffee (Bucheli et al., 1996; Knopp et al., 2006; Leloup et al., 2005). Similarly, in our previous study (Tolessa, 2017), the postharvest processing method did not show significant differences in sucrose content at mid and low altitude regions. This implies that there is still no convincing information in the literature with regard to the effect of postharvest processing methods on sucrose content of green coffee beans. The reason for these discrepancies could be due to the variability of factors considered during the studies rather than to processing methods (e.g. varietal differences, growing conditions: altitude and shade).
In general, the present study shows that the bio-chemical composition of green coffee was significantly influenced by the interactions between variety and postharvest processing methods. The coffee varieties 74-112, 74-110 and 74-165, processed by the washed method gave the highest TCGA content compared to the semi-washed and dry methods. The washed processing method also enhanced the caffeine content and the highest value was obtained with the coffee varieties 74-4, 74-112 and 74-165. However, the dry processing method increased the sucrose content of green coffee beans particularly for coffee variety 74-110, 74-140 and 74-148. Therefore, the study highlighted the influence of postharvest processing method on chemical composition of green coffee beans. The chemical composition is also affected by the coffee bean varieties. Moreover, the present study also confirmed that the biochemical composition of green coffee beans is highly variable depending on genetic traits, growing conditions and postharvest processing conditions. However, further study is needed in order to correlate the biochemical composition differences observed among the processing methods with cup quality. Furthermore, this study has been done using limited coffee varieties grown at similar conditions. Therefore, it would be advisable to further evaluate more varieties under different growing environments.
The authors have not declared any conflict of interests.
REFERENCES
|
Abeyot T, Sentayehu A, Taye K, Weyessa G (2011). Genetic diversity analysis for quality attributes of some promising Coffea arabica germplasm collections in southwestern Ethiopia. Journal of Biological Sciences 11(3): 236-244.
Crossref
|
|
|
|
Abreu HM, Nobile PM, Shimizu MM, Yamamoto PY, Silva EA, Colombo CA, Mazzafera P (2012). Influence of air temperature on proteinase activity and beverage quality in Coffea arabica. Brazilian Journal of Botany 35(4):357-376.
Crossref
|
|
|
|
|
Alonso-Salces MR, Guillou C, Berrueta LA (2009b). Liquid chromatography coupled with ultraviolet absorbance detection, electrospray ionization, collision induced dissociation and tandem mass spectrometry on a triple quadrupole for the on line characterization of polyphenols and methylxanthines in green coffee beans. Rapid Communications in Mass Spectrometry 23(3):363-383.
Crossref
|
|
|
|
|
Alonso-Salces RM Serra F, Reniero F, HÉberger K (2009a). Botanical and geographical characterization of green coffee (Coffea arabica and Coffea canephora): chemometric evaluation of phenolic and methylxanthine contents. Journal of Agricultural and Food chemistry 57(10):4224-4235.
Crossref
|
|
|
|
|
Avelino J, Barboza B, Araya JC, Fonseca C, Davrieux F, Guyot B, Cilas C (2005). Effects of slope exposure, altitude and yield on coffee quality in two altitude terroirs of Costa Rica, Orosi and Santa Maria de Dota. Journal of the Science of Food and Agriculture 85(11):1869-1876.
Crossref
|
|
|
|
|
Avelino J, Barboza B, Davrieux F, Guyot B (2007). Shade effect on sensory and chemical characteristics of coffee from very high altitude plantations in Costa Rica. In Second International Symposium on Multi-strata Agroforestry Systems with Perennial Crops, 17–21 September 2007, IUFRO, CIRAD, CATIE, U. Wales, ICRAF, Turrialba, Costa Rica.
|
|
|
|
|
Balyaya K, Clifford MN (1995). Chlorogenic acids and caffeine contents of monsooned Indian Arabica and Robusta coffees compared with wet and dry processed coffees from the same geographic area. In ASIC, 16 Colloque, Kyoto.
|
|
|
|
|
Bart M (2017). Ethiopia's coffee farmers struggle to realize benefits from international markets. International Food Policy Research Institutes.Washington, DC 20005-3915 USA.
|
|
|
|
|
Bertrand B, Vaast P, Alpizar E, Etienne H, Davrieux F, Charmetant P (2006). Comparison of bean biochemical composition and beverage quality of Arabica hybrids involving Sudanese-Ethiopian origins with traditional varieties at various elevations in Central America. Tree physiology 26(9):1239-1248.
Crossref
|
|
|
|
|
Bucheli P, Meyer I, Pasquier M, Locher R (1996). Plant Physiology Biochem Special Issue: 10th FESPP Congress Florence, Italy. pp. 325.
|
|
|
|
|
Bytof G, Knopp S, Schieberle P, Teutsch I, Selmar D (2005). Influence of processing on the generation of γ-aminobutyric acid in green coffee beans. European Food Research and Technology 220(3- 4):245-250.
|
|
|
|
|
Cheng B, Furtado A, Smyth HE, Henry RJ (2016). Influence of genotype and environment on coffee quality. Trends in Food Science & Technology 57:20-30.
Crossref
|
|
|
|
|
DaMatta FM, Avila RT, Cardoso AA, Martins SC, Ramalho JC (2018). Physiological and agronomic performance of the coffee crop in the context of climate change and global warming: A review. Journal of Agricultural and Food Chemistry 66(21):5264-5274.
Crossref
|
|
|
|
|
De Castro RD, Marraccini P (2006). Cytology, biochemistry and molecular changes during coffee fruit development. Brazilian Journal of Plant Physiology 18(1):175-199.
Crossref
|
|
|
|
|
Duarte GS, Pereira AA, Farah A (2010). Chlorogenic acids and other relevant compounds in Brazilian coffees processed by semi-dry and wet post-harvesting methods. Food Chemistry 118(3):85-855.
Crossref
|
|
|
|
|
Farah L, Donangelo CM (2006a). Phenolic compounds in coffee. Brazilian Journal of Plant Physiology 18(1):23-36.
Crossref
|
|
|
|
|
Farah L, Monteiro MC, Calado V, Franca AS, Trugo LC (2006b). Correlation between cup quality and chemical attributes of Brazilian coffee. Food Chemistry 98(2):373-380.
Crossref
|
|
|
|
|
Feldman R, Ryder W, Kung J (1969). Importance of nonvolatile compounds to the flavor of coffee. Journal of Agricultural and Food Chemistry 17(4):733-739.
Crossref
|
|
|
|
|
Guyot B, Guelle D, Assemat S, Tchana E, Pomathios L (1995). Influence du mode de préparation du café vert robusta sur sa composition chimique et ses qualités organoleptiques. In Seizième Colloque Scientifique International sur le Café.
|
|
|
|
|
Guyot B, Gueule D, Manez J, Perriot J, Giron J, Villain L (1996). Influence de l'altitude et de l'ombrage sur la qualité des cafés arabica. Plantations, recherche, développement 3(4):272-280.
|
|
|
|
|
International Coffee Organization (ICO) (2018). Coffee market report Available at
View. Accessedon 1 August 2018.
|
|
|
|
|
Joët LA, Descroix F, Doulbeau S, Bertrand B, Dussert S (2010). Influence of environmental factors, wet processing and their interactions on the biochemical composition of green Arabica coffee beans. Food Chemistry 118(3):693-701.
Crossref
|
|
|
|
|
Kitila O, Alamerew S, Kufa T, Garedew W (2011). Organoleptic Characterization of Some Limu Coffee (Coffea arabica L.) Germplasm at Agaro, Southwestern Ethiopia. International Journal of Agricultural Research 6:537-549.
Crossref
|
|
|
|
|
Knapp DR (1979). Handbook of analytical derivatization reactions: John Wiley and Sons.
|
|
|
|
|
Knopp S, Bytof G, Selmar D (2006). Influence of processing on the content of sugars in green Arabica coffee beans. European Food Research and Technology 223(2):195-201.
Crossref
|
|
|
|
|
Kufa T, Ayano A, Yilma A, Kumela T, Tefera W (2011). The contribution of coffee research for coffee seed development in Ethiopia. Journal of Agricultural Research and Development 1(1):009-016.
|
|
|
|
|
Ky LJ, Dussert S, Guyot B, Hamon S, Noirot M (2001). Caffeine, trigonelline, chlorogenic acids and sucrose diversity in wild Coffea arabica L. and C. canephora P. accessions. Food chemistry 75(2):223-230.
Crossref
|
|
|
|
|
Larsson SC, Virtamo J, Wolk A (2011). Coffee consumption and risk of stroke in women. Stroke 42(4):908-912.
Crossref
|
|
|
|
|
Leloup V, Gancel C, Liardon R, Rytz A, Pithon A (2005). Impact of wet and dry process on green coffee composition and sensory characteristics. In ASIC 2004. 20th International Conference on Coffee Science, Bangalore, India, 11-15 October 2004. Association Scientifique Internationale du Café (ASIC) pp. 93-101.
|
|
|
|
|
Leroy RF, Bertrand B, Charmetant P, Dufour M, Montagnon C, Marraccini P, Pot D (2006). Genetics of coffee quality. Brazilian Journal of Plant Physiology 18(1):229-242.
Crossref
|
|
|
|
|
Leroy RF, Bertrand BCP Montagnon C, Marraccini P (2006). Genetics of coffee quality. Brazilian Journal of Plant Physiology 18:229-242.
Crossref
|
|
|
|
|
Link JV, Lemes ALG, Marquetti I, dos Santos Scholz MB, Bona E (2014). Geographical and genotypic segmentation of arabica coffee using self-organizing maps. Food Research International 59:1-7.
Crossref
|
|
|
|
|
Ryota K (2018). Sub Saharan Report: Ethiopian Coffee Business. Marubeni Research Institute. Nihonbashi, Chuo-ku, Tokyo.
|
|
|
|
|
Samper L, Giovannucci D, Marques-Vieira L (2017). The Powerful Role of Intangibles in the Coffee Value Chain. WIPO Economic Research Working Paper No. 39. Geneva: WIPO.
|
|
|
|
|
Selmar BG, Knopp S (2002). New aspects of coffee processing: the relation between seed germination and coffee quality. In Proceeding of the "19th International Coffee Science Conference ". Paris: ASIC.
|
|
|
|
|
Tirfe E, Kufa T, Mohammed A, Gebremedhin Y (2015). Physical Quality Performance of Some Early Released Coffee. Varieties at three Locations in South-west Ethiopia. Food Science and Quality Management 37:89-82.
|
|
|
|
|
Tolessa K (2017). Biophysical control of coffee quality: the case of southwestern Ethiopia. (PhD thesis), Ghent University, Gent, Belgium.
|
|
|
|
|
Tolessa K, D'heer J, Duchateau L, Boeckx P (2017). Influence of growing altitude, shade and harvest period on quality and biochemical composition of Ethiopian specialty coffee. Journal of the Science of Food and Agriculture 97(9):2849-2857.
Crossref
|
|
|
|
|
Tolessa K, Duchateau L, Boeckx P (2018). Analysis of coffee quality along the coffee value chain in Jimma zone, Ethiopia. African Journal of Agricultural Research 13(29):1468-1475.
Crossref
|
|
|
|
|
Tolessa K, Rademaker M, De Baets B, Boeckx P (2016). Prediction of specialty coffee cup quality based on near infrared spectra of green coffee beans. Talanta 150:367-374.
Crossref
|
|
|
|
|
Tressl R, Holzer M, Kamperschroer H (1982). Buidung von Aromastaffen in Rostkaffee in Abhangigkeit vom Gehalt an Aminosauren und Reduzierenden Zuckern. In 10th International Colloquium on the chemistry of coffee pp. 111-114.
|
|
|
|
|
Van der Vossen HAM (1985). Coffee Selection and B reeding. In: Clifford MN, Willson KC (eds) Coffee. Springer, Boston, MA pp. 48-96.
Crossref
|
|
|
|
|
World Intellectual Property Report (WIPR) (2017). Coffee: how consumer choices are reshaping the global value chain. World Intellectual Property Organization, Geneva, Switzerland.
|
|
|
|
|
Worku M, De Meulenaer B, Duchateau L, Boeckx P (2018). Effect of altitude on biochemical composition and quality of green arabica coffee beans can be affected by shade and postharvest processing method. Food Research International 105:278-285.
Crossref
|
|