Full Length Research Paper

ABSTRACT
Consumers value foam as a key quality feature of coffee and coffee-based beverages. However, perceptions of foam quality vary from country to country and even from consumer to consumer. This study provided measurable parameters which can be used to tailor products to consumers’ foam preferences. The analytical techniques described in this study enable the foam of coffee and coffee-milk beverages to be visualized and quantified in terms of volume and structure. It is intended to serve as a basis to quantify consumers’ subjective expectations of different coffee-based products, in terms of appearance. The aim of the present study was to develop an analytical methodology for the objective assessment of customer-specific requirements. For this purpose, the parameters foamability and foam stability were assessed by means of image analysis, while changes in structure were measured with a Dynamic Foam Analyzer. All measurements were carried out in triplicate with an overall RSD of ≥7%. The proposed procedure allowed normally subjective quality features of a variety of foams in different coffee species and milk types to be objectively characterized. This knowledge will enable further investigation into tailoring the scientifically assessed foam properties to subjective sensory characteristics perceived by the consumer, such as smoothness, fineness, body, thus helping to better satisfy rapidly evolving coffee consumer trends.
Key words: Foamability, foam stability, foam structure, bubble size distribution, coffee crema, coffee-based beverages.
INTRODUCTION
Combined coffee and milk drinks are rarely studied and analysed together, although it is known how different they are (e.g. milk is alkaline and coffee is acidic; pH 4.5-5.0). The interaction between milk and coffee in the formation of milk foam is rarely mentioned in the literature, in contrast to the amount of knowledge on (black) coffee and milk foam. Many studies have already been carried out on the subject of coffee and milk foam (Hatakeyama et al., 2019), but mainly as separate investigations. A comprehensive review on coffee foam was published by Ishwarya and Nisha (2020). Analysis of the mechanism of foamability revealed that Maillard reaction products such as melanoidins, formed during the roasting of coffee beans, are responsible for the foaming of espresso coffee. Furthermore, two additional reactions that occurred in the espresso brewing method can be indicated as a source of carbon dioxide. Both reactions derived from bicarbonate ions contained in the water, the second most important ingredient for brewing coffee. In particular, carbon dioxide is formed from bicarbonate thermal decomposition and from bicarbonate neutralization by natural coffee acids (Illy and Navarini, 2011). Researchers have confirmed that polysaccharides such as galactomannans and protein complexes have surface and rheological characteristics that improve foam stability (Nuñes and Coimbra, 1998). In another study, these authors have reported that the foaming capacity and stability of espresso coffee increases with the degree of roasting, as well as in the presence of galactomannan, arabinogalactan, and proteins. These attributes do not vary according to the origin of the coffee (Nuñes et al., 1997).
Increasingly important in the market for milk-based coffee drinks is the quality of the milk foam. Milk fat and milk proteins are crucial for the production of stable milk foams with the desired texture and stability (Huppertz, 2014). Milk proteins stabilise the air bubbles in milk foams. However, foam stability decreases over time as liquid flows out of the foam, causing air bubbles to come into close contact and fuse together. This leads to ever larger air bubbles which eventually collapse. Milk fat also destabilises the foam, but is desirable for its contribution to taste. The foaming and stability of milk foam depend on the composition of the milk used and are influenced by the physicochemical properties of whey protein (Khezri et al., 2017). The production of stable milk foams therefore involves a complicated process of balancing the desired foaming properties of the milk proteins and the destabilising milk fat required for taste (Borcherding, 2004; Borcherding et al., 2008; Kamath et al., 2008; Borcherding et al., 2009; Marinova et al., 2009; Huppertz, 2010).
A study by Hatakeyama et al. (2019) evaluated the sensory characteristics of foamed milk. These authors have described that in their study foamed milk with small bubble size produced high sensory scores for fineness, smoothness, and elasticity. The stability of foam presented a challenge, particularly due to the fragile nature of gas bubbles. Generally, foams are destabilized by liquid drainage, the coalescence of bubbles, and the disproportionation of bubbles (Silva et al., 2008). Obviously, these properties depend on the composition of the gas and liquid phases. For cappuccino-type beverages, for example, the foam should be stable for the amount of time typically required to consume the drink (Huppertz, 2010). Bubble size is also important for foaming properties in general. Although bubbles are small immediately after foaming, they coalesce and become large with time, and finally burst. A small bubble size in a café latte contributed to the sharp visual contrast between the foamed milk and the coffee (Borcherding et al., 2008).
Chemical methods of foaming have gained importance in recent times. Compared with physical foaming, in chemical foaming, the desired bubble characteristics such as bubble size, bubble size distribution, and bubble generation rate are achieved with considerable ease (Pugh, 2016a). It has been reported that in order to obtain a better foam in cappuccino coffee, foaming creamers such as food-grade acidulants, sodium carbonate, or sodium bicarbonate could be added as chemical foaming agents (Agbo et al., 1998).
Several techniques are available for the measurement and characterization of foams based on the bubble size distribution, foam height, rheological characteristics, interfacial properties, and gas diffusion rate (Pugh, 2016b). Using a Dynamic Foam Analyzer (DFA), bubble count, bubble area, and foam height have been investigated in foamed milk (Hatakeyama et al., 2019). In this investigation foam height was defined as the total height of liquid and foam. Yekeen et al. (2016) employed DFA 100 in 2016 to estimate the effect of silica nanoparticles on sodium dodecyl sulfate (SDS) foam stability in the presence of oil. Apart from bubble size distribution, foam volume, foam height, and coalescence of bubbles were also examined from images captured (Yekeen et al., 2017). Recently, Deotale et al. (2020) used coffee oil as a natural surfactant to stabilize coffee foam. They employed DFA for studying bubble characterization using coffee oil in comparison with non-ionic surfactants. Other approaches to determine bubble size are electroresistivity (Barigou and Greaves, 1991), optic (Ghiassi et al., 2012; Upadhyay et al., 2012; Kulkarni et al., 2004) and acoustic techniques (Prabhukumar et al. 1996; Anguelova 1997; Duraiswami et al. 1998; Wu and Chahine 2010; Czerski, 2012; Leighton, 2012).
In this study, a commercial Dynamic Foam Analyzer using specific image-processing software was employed for the characterization of the volumetric foam properties of the foam produced. This set-up was also applied to determine foam structure as a function of time for different foams produced in coffee extractions, milk only and coffee-milk combinations. Additionally, a relatively inexpensive photographic setup (compared to the cost of the DFA equipment) was used to measure the actual foam decay.
MATERIALS AND METHODS
Coffee machine for milk foam preparation
A fully automatic Schaerer coffee machine of the type Coffee Soul (Schaerer Ltd., Switzerland) was used in this investigation. The following settings were adopted for the foaming of milk (Cup parameter): Duration (s) -40; Temperature (C°) - 65, Air-pump-speed (%) - 45; Air-start-temperature (C°) - 25; Air-stop-temperature (C°) - 40.
Coffee machine for coffee and coffee-milk foam preparation
A Turmix capsule machine, model TX 170 CITIZ NESPRESSO (Nespresso, Switzerland), was used to produce the coffee and coffee-milk samples.
Dynamic foam analyzer DFA 100
A Dynamic Foam Analyzer (DFA) 100 (KRÜSS GmbH, Borsteler Chaussee 85, Hamburg, Germany) was used to measure the foaming structure of the samples. The device consisted of an infrared LED line for improved detection, an external temperature sensor for direct measurement of the sample temperature and a glass column CY4572 (d = 40 mm). The software ADVANCE for DFA Version 1.11-03 combined control of the instrument with data processing functions.
High resolution camera
To measure the foamability and the true foam decay in milk and coffee-milk systems a Thorlabs DCC1645C high resolution USB2.0 CMOS camera (Thorlabs GmbH, Lübeck, Germany) was used, with a full-frame resolution of 1280 × 1024 and a colour sensor with a 50 mm fixed focal length lens.
Volluto coffee capsules
For the preparation of the coffee brews, commercial Volluto Nespresso capsules were used for all systems:
1. Strength 4 on the Nespresso scale
2. Medium roasted
3. Pure Arabicas from Brazil and Colombia
4. Medium grind
Whole milk UHT
Key figures of the EMI UHT milk with a fat content of 3.5% (measurements from Emmen Laboratory):
Pasteurisation temperature/time: 139°C/4 s
Homogenization pressure: 195/40 bar
Precise fat content: 3.45 g/100 g
Protein content: 3.47 g/100 g
Lactose content: 4.2 g/100 g
Viscosity: 28.0 mPas (5°C)
Sample volumes
The volume of the samples was chosen in accordance to Nespresso’s suggestions. https://www.realcoffee.com/cup-size-programming/
1. Double espresso: Approximately 80 ml
2. Latte macchiato: 40 ml coffee and 150 ml milk
3. Foamed milk: 120 ml
Patent blue solution (1 g/L)
100.00 mg patent blue was weighed into a 100 ml volumetric flask and filled up to the mark with deionised water.
Foaming procedures
Procedure for milk foaming
150 g whole milk (145 ml) cooled to approx. 4°C was weighed into a separate milk can and foamed. The foaming time was 30 s. The frothed milk was then poured into the cylindrical glass column of the DFA device for the measurements. The temperature just after foaming T0 was 60° C (+/-2°).
Procedure for foaming coffee only
85 g of coffee extract was brewed directly into the cylindrical glass column of the DFA device. The temperature just after foaming T0 was 65°C (+/-1°).
Procedure for foaming coffee-milk beverages
For the measurements of the coffee-milk samples, 40 g of coffee extract was first brewed directly into the cylindrical glass column of the DFA device, and then all the previously foamed milk was poured onto it for measurement. The temperature T0 was 62° C (+/-1°).
Procedure for enhanced visualisation of visual contrast in samples containing milk
100 g of the cooled milk sample was weighed into a 200 ml beaker and 10 drops of the patent blue solution were added just before the start of the foaming experiment.
Foam characteristics
The measurement time for all analysis was 600 s. The foam in the glass cylinder was characterised at four time intervals (t0, t1 min, t3 min and t5 min). All measurements were in triplicate. The RSD was for all experiments ≥ 7%.
Foamability
The foamability ratio (FR) introduced here was used as a measure of foamability. The foamability was determined by setting the total height (liquid plus crema) at T1 min after foaming in relation to the initial liquid height resulting in the FR. The arbitrary setting of the readout at T1min was chosen as from this point on the phase boundaries are clearly visible. For the sake of simplicity, the liquid mass used was converted into height by assuming a density of 1g/cm3 regardless of the nature of the sample.

Foam stability
The true foam decay (FD) determinations in milk containing samples were carried out with the Thorlabs, high resolution camera. This simplified method measures the differences in foam heights (mm) immediately after foaming and change of foam height after 3 min. These measurements were determined visually from the photos taken.
Foam structure
The structure measurements lead to bubble count and size obtained from the analysis of CCD camera images of a defined area (1280?×?1240 pixels). Their statistical size distribution over time is depicted as histograms.
RESULTS AND DISCUSSION
Foamability
As shown in Table 1, the highest foamability ratio occurred in the milk samples, while the coffee and coffee-milk beverages investigated exhibited slightly lower values but a similar trend. The foamability ranged from 1.34 (+/- 7%) for coffee samples to 1.50 (+/- 3%) and 1.38 (+/- 3%) for whole milk and coffee-milk beverages respectively (Table 1).
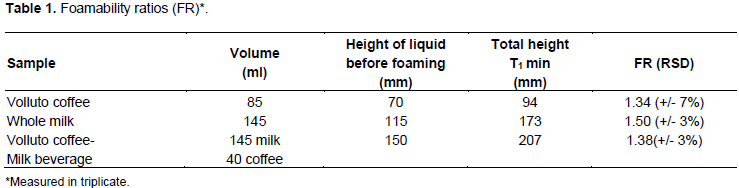
The rather high RSD in the FR of the coffee samples can be explained by the fact that the upper foam threshold showed a very irregular and porous layer, making the determination of the actual height quite subjective (Figure 1, T0). It can be said that the reading of this height strongly depended on the observer and the proposed FR should be taken as a semi-quantitative value. Further studies are needed to determine influences such as grinding, extraction, roasting degree, portion in coffee machine, percolation conditions, coffee species, and milk fat content on the resulting foam volume.
Foam stability measurements with enhanced foam-liquid interface visualisation
A simple method was adopted for testing foam stability without an expensive measuring device. This consisted in measuring the foam height at one minute and at three minutes (Table 2). Since the foam-liquid interface was apparently not yet fully formed or was not visible at T0, the difference between the foam heights at T1 and T3 minutes was chosen to determine the foam stability. The ability to visualize a process within a multiple phase liquid is typically carried out using optical sensory. However, when a displacement study uses untransparent immiscible phases, identification of the phases in a specific location may be a challenge. The visual decrease of the foam as a function of time is shown in Figures 1-3. Although, the foam-liquid interface can be clearly seen by the eye (Figures 1 and 3) no satisfactory phase boundary differentiation between foam, liquid and air could be achieved by optic sensors.
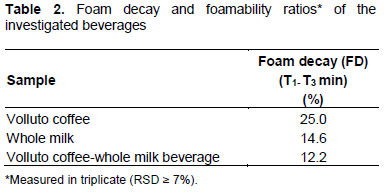
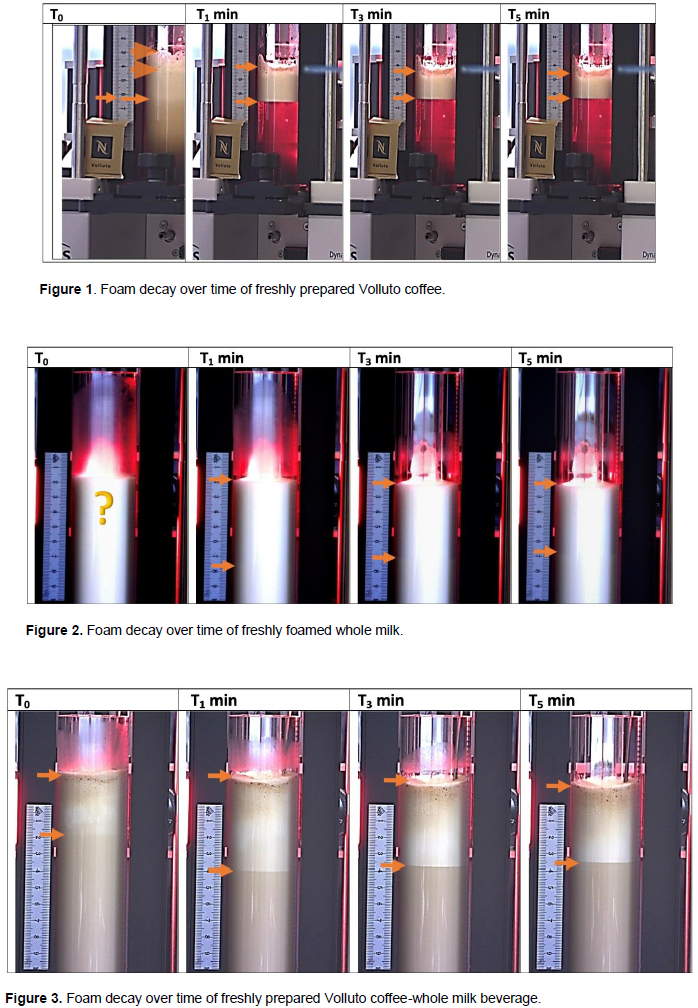
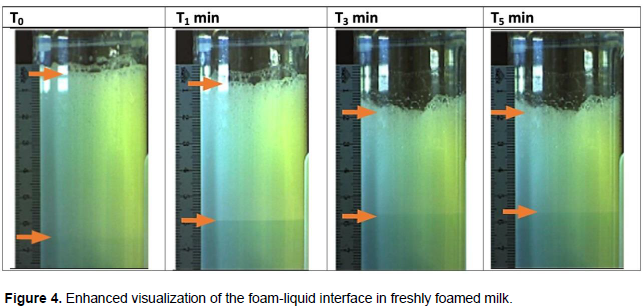
In this investigation, the evaluation of foam stability was determined visually from the photos taken with an external camera over time. The stratification between the foam-air level and the foam-liquid level was measured manually directly from the pictures and provided the foam height in mm at a given time (Figures 1-3). In particular, the detection of the phase interfaces in milk samples caused some difficulty. As seen in Figure 2, shortly after foaming almost no interfaces were recognisable. Even after a time period of 1 and 3 min boundaries were very difficult to detect. To overcome this inconvenience, a methylene-blue solution was selected for the visualization of the two phases. When Figure 4 is compared with Figure 2, it can be seen that the phase interfaces can be differentiated much better using this technique. Without the addition of dye, the first few minutes of the measurements could not be evaluated. The readout of the value at T1 min was arbitrarily chosen, as from this point on the foam-liquid interface was clearly visible, which was not the case immediately after the foaming process. The set-up used was validated and no influence of the colorant was found (n=3, RSD=≥7 %),
It is imperative that the influence of the additives on the foam properties should be re-evaluated after each modification or new configuration of the system. The experiments for enhanced visualization of the foam-liquid interface were performed in a separate glass cylinder in order not to interfere with the foam structure evaluations of the Krüss software. As seen in Table 2 the foam stability expressed in percentage of actual foam decay (FD) resulted in 25% for the coffee samples, 14.6% for the milk samples and 12.2% for the blend (RSD ≥7 %).
Foam structure
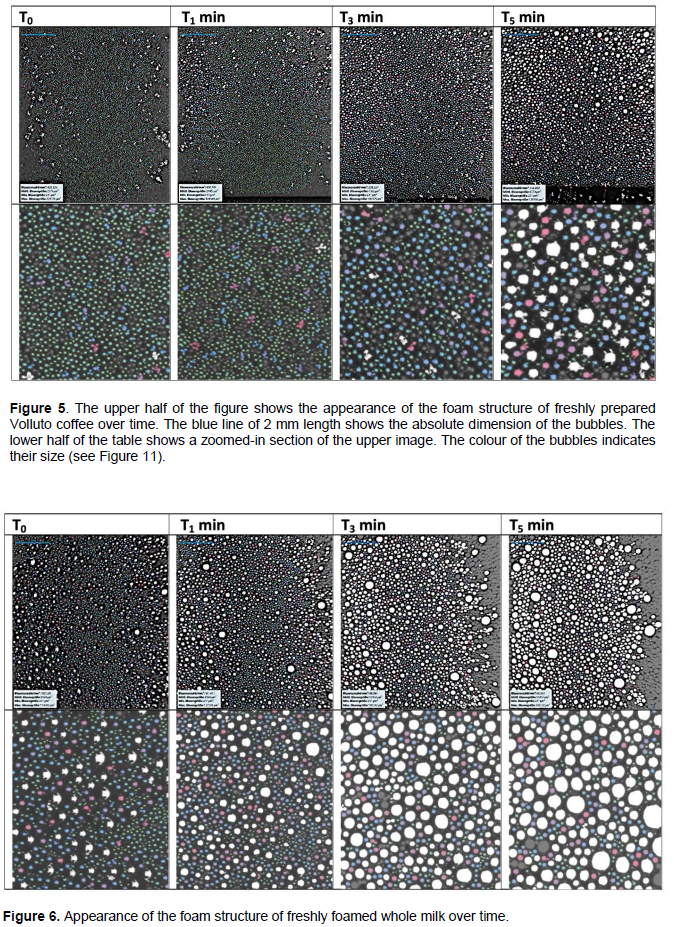
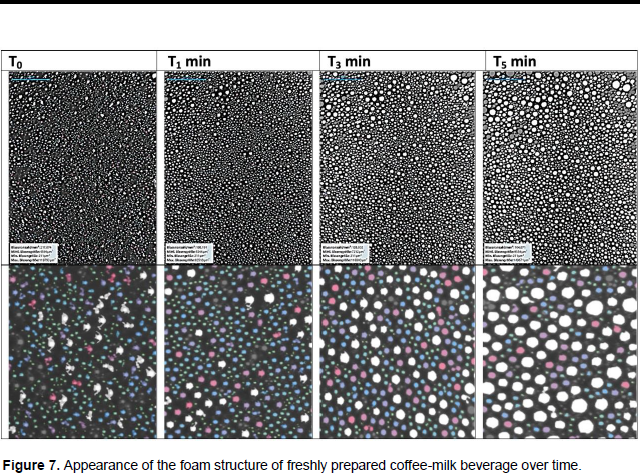
The instability of the foam, induced by drainage, coalescence and disproportionation, led to changes in the foam structure over time. Drainage is the liquid flow from a foam as a result of gravity and capillary forces. Because of drainage a foam becomes dryer and bubbles may become distorted. In that case foams change from spherical foams to polyeder foams. This could be observed for the coffee samples (Figure 5) but not for the coffee-milk beverages. Coalescence is the merging of two bubbles, leading to larger bubbles in the foam and a decrease in the number of bubbles. This process was seen in all the samples investigated. Disproportionation effects the distribution of the liquid and gas phase. Because of gas diffusion, larger bubbles grow at the expense of smaller bubbles and thus alter the appearance of the foam. The visual comparison of the foam structure given by the number and size of bubbles evaluated by the DFA system showed that the foam structure of the coffee samples was the finest (Figure 6). The texture of the whole milk samples was the coarsest, while the coffee-milk blends were in between the structures represented in Figures 5 and 7.
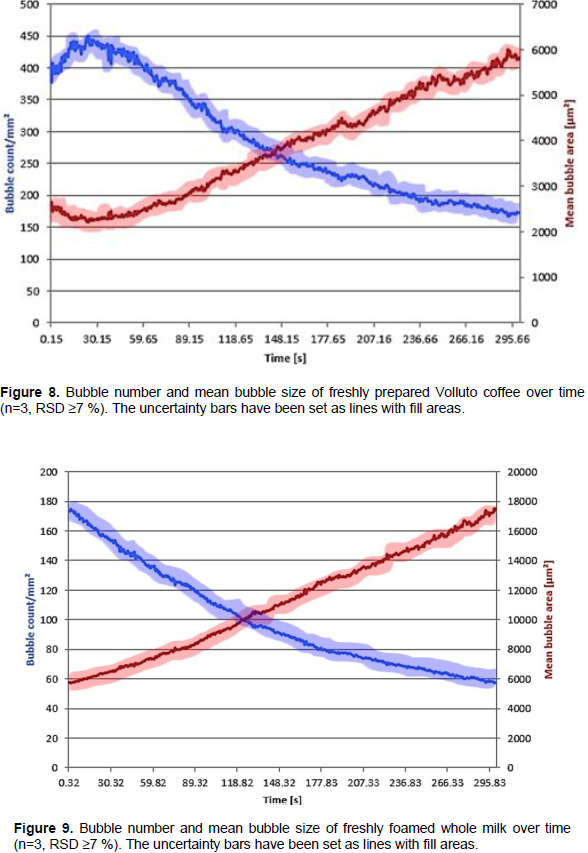
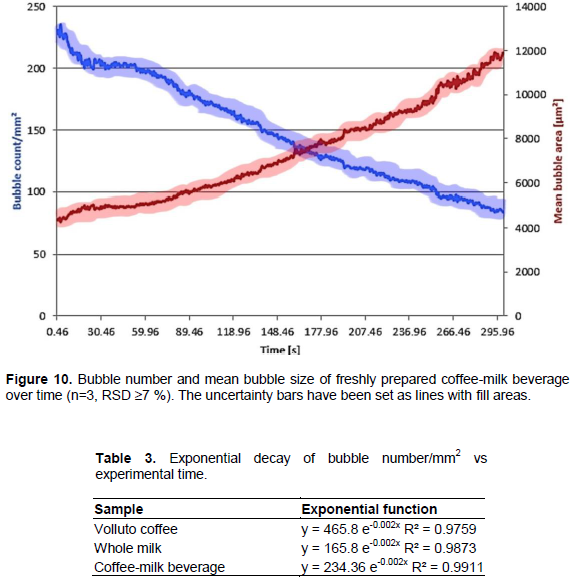
The foams produced with coffee samples (Figure 8) showed values for bubbles/mm2 ranging from 450 shortly after foaming, decreasing to 175 bubbles/mm2 after 5 minutes. In addition, some bubbles became larger, changing their shape from spherical to irregular. The foams produced with pure whole milk (Figure 9) showed initial values of 175 bubbles/mm2 and ended at 60 bubbles/mm2. This indicated that the foams already had coarser bubbles directly after the foam-generating process, with the number of bubbles decreasing significantly by the end of the measurement. This resulted in a coarser texture while the spherical shape was maintained over almost the entire measurement time. The coffee-milk beverage showed initial values of 230 to 175 bubbles/mm2 at the end of the experiment (Figure 10). The initial shape can be defined as irregular, which towards the end of the measurement turns into a circular form. After an initial more or less accentuated stasis period, the bubble number/area decreases with time and follows the expected exponential decay. A high bubble count tended to lead to small bubble size. The exponential function of the bubble count/area versus time of the experiments was used to compare the decay of the foams of the different beverages investigated. The fitted exponential decrease of bubble count/mm 2 vs experimental time showed almost equal exponents, suggesting a similar decay rate for all the beverages investigated (Table 3).
Time-dependent analysis of bubble size distribution
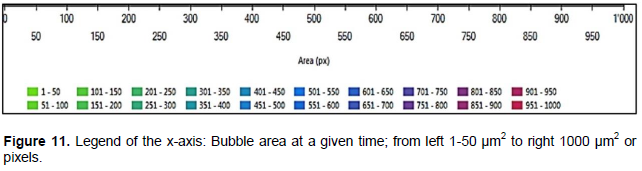
Bubble size distributions were measured by the DFA technique and presented as histograms. The x-axis represents the bubble area in µm2 or pixels divided into classes as a colour-coded bar (Figure 11). The y-axis shows the count of the bubbles. It is automatically adjusted to the highest value by the software and cannot be scaled. For better visualisation, the highest values are shown magnified.
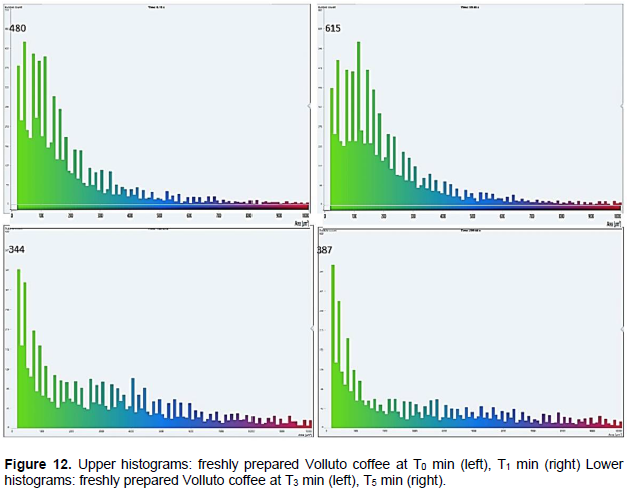
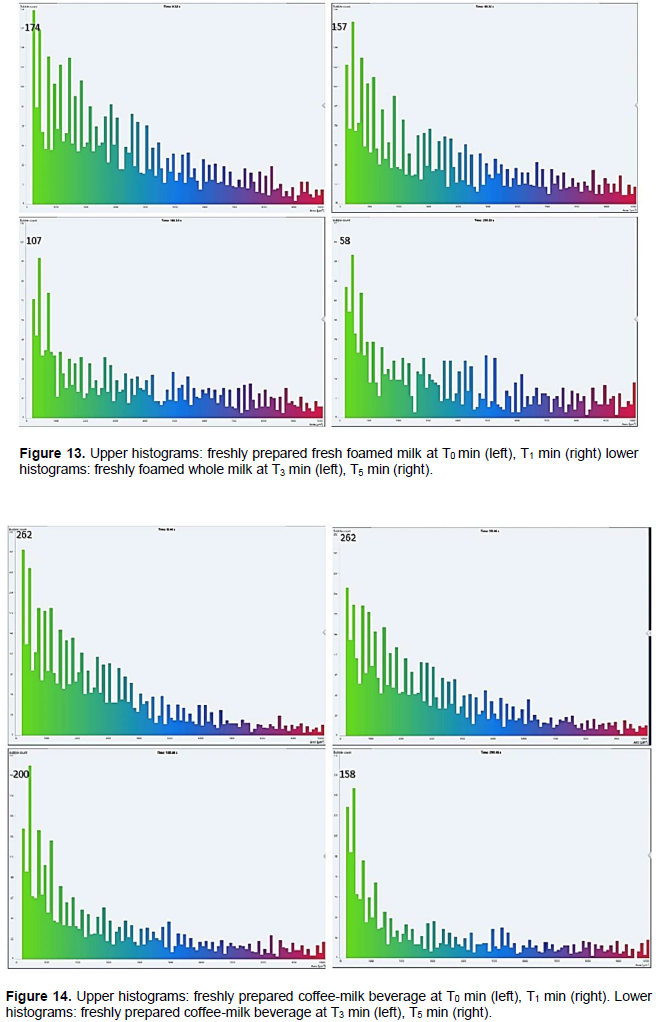
For the coffee samples it can be observed that initially the bubble-size distribution was almost monodispersed, having relatively uniform small bubble sizes. All bubbles had a spherical shape (Figures 6 and 12) reaching moderate polydispersion and changed geometry at time T5 min. A slight increase of bubble count with corresponding diminishing of the bubble size at around T1 min could be observed. For the foam formation of milk samples, shown in Figure 13, the initial distribution was more polydispersed and this polydispersion was observed over the entire measurement period. The coffee-milk beverages showed a behavior between the two other beverages investigated. Moreover, the bubble size become progressively larger over time for all samples, while the bubble number reduced over time (Figure 14).
The foam analyzer used in this investigation played an important role in the time-dependent analysis of bubble size and distribution of bubbles using advanced image processing techniques. Although the apparatus is not that inexpensive, it permits to characterize foam properties easily and precisely. The beverages investigated, although different in total composition, presented almost the same decay profile in bubble count, with a similar increase of bubble size over the time of the experiment.
CONCLUSIONS
The analytical platform developed allows quantitative, and therefore objective determination of foamability, actual foam decay, foam structure and statistical bubble size distribution in coffee alone and in different coffee-based beverages. In this study, only one variety of coffee and one type of milk were selected as examples to show the feasibility of the analytical methods. These methods allow the foam properties to be visualized and quantified in terms of appearance, providing a basis for producing different coffee-based products that consistently satisfy consumer expectations.
It should be emphasized that the aim of the present study was not to investigate the foamability process itself nor to examine the different influences on it, but to develop an analytical methodology for the objective assessment of customer-specific requirements. The personalization of coffee-based products is of great importance against the background of rapid changes in a highly competitive market and a rapidly evolving technological environment. Only after subjective sensorial aspects of foam/crema and consumer preferences for other features, such as optical aspects, have been determined and correlated, using the objective analytical tools presented in this publication, can a desired product be created with a constant and satisfactory quality. This will be the aim of further studies.
ACKNOWLEDGMENT
The author gratefully appreciate Nick Bell for his critical linguistic proofreading. Research reported in this publication was supported by the Innosuisse-Swiss Innovation Agency within the Project-Nr. 36686.1 INNO-LS. The Coffee Excellence Center (CEC) of the Zurich University of Applied Sciences (ZHAW) is appreciated for hosting this study.
CONFLICT OF INTERESTS
The author has not declared any conflict of interests.
REFERENCES
|
Agbo F, Mori K, Goto T, Cale KW, Stubblefield TL, Dal Monte AC (1998). Foaming Coffee Creamer and Instant Cappuccino. U.S. Patent No. 5,780,092. U.S. Patent and Trademark Office, Washington, D.C. |
|
|
Anguelova MD (1997). Laboratory study of bubble clouds characteristics at various conditions. University of Delaware, Newark, DE, Delaware. |
|
|
Barigou M, Greaves M (1991). A capillary suction probe for bubble size measurement. Measurement Science and Technology 2(4):318-326. |
|
|
Borcherding K, Lorenzen PC, Hoffman W, Schrader K (2008). Effect of foaming temperature and varying time/temperature-conditions of pre-heating on the foaming properties of skimmed milk. International Dairy Journal 18(3):49-358. |
|
|
Borcherding K, Lorenzen PC, Hoffman W, Schrader K (2009). Effect of protein content, casein whey protein ratio and pH value of the foaming properties of skimmed milk. International Dairy Journal, (62):161-169. |
|
|
Borcherding K (2004). Untersuchungen zur Charakterisierung der Makro- und Mikrostruktur von Milchschäumen. Ph.D. Thesis, University of Kiel. |
|
|
Czerski H (2012). An inversion of acoustical attenuation measurements to deduce bubble populations. Journal of Atmospheric and Oceanic Technology 29(8):1139-1148. |
|
|
Deotale S, Dutta S, Moses JA, Balasubramaniam VM (2020). Foaming characteristics of beverages and its relevance to food processing. Food Engineering Reviews 12(2):229-250. |
|
|
Duraiswami R, Prabhukumar S, Chahine GL (1998). Bubble counting using an inverse acoustic scattering method. Journal of the Acoustical Society of America 104(5):2699-2717. |
|
|
Ghiassi SH, Safekordi AA, Fatemeh BS (2012). Determination of interfacial area in gas-liquid two phase by light transmission. Iranian Journal of Chemistry and Chemical Engineering 31(61):81-87. |
|
|
Hatakeyama S, Akiyama M, Yoneyama R, Watanabe K, Koizumi R, Miyaji K, Mizota K, Mizota Y, Ikeda M, Wakao S (2019). Effects of manufacturing conditions on the foaming properties of milk and sensory characteristics of foamed milk. LWT Food Science and Technology 99:555-561. |
|
|
Huppertz T (2010). Foaming properties of milk: A review of the influence of composition and processing. International Journal of Dairy Technology 63(4):477-488. |
|
|
Huppertz T (2014). Milk Foam: Creating Texture and Stability. Specialty Coffee Association News, Issue No 4. |
|
|
Illy E, Navarini L (2011). Neglected food bubbles: the espresso coffee foam. Food Biophysics 6(3):335-348. |
|
|
Ishwarya SP, Nisha P (2021). Unravelling the science of coffee foam - A Comprehensive Review. Critical Reviews in Food Science and Nutrition (61):1704-1724. |
|
|
Kamath S, Huppertz T, Houlihan AV, Deeth HC (2008). The influence of temperature on the foaming of milk. International Dairy Journal 18(10-11):994-1002. |
|
|
Khezri M, Shahriari SH, Shahsavani L (2017). The effect of xanthan gum and temperature on foam stability of milk-based espresso coffees. Journal of Food Biosciences and Technology 7(1):15-22. |
|
|
Kulkarni AA, Joshi JB, Ramkrishna D (2004). Determination of bubble size distributions in bubble columns using LDA. AIChE Journal 50(12):3068-3084. |
|
|
Leighton TG, Baik K, Jiang J (2012). The use of acoustic inversion to estimate the bubble size distribution in pipelines. Proceedings of the Royal Society A: Mathematical, Physical and Engineering Sciences. 8:468(2145):2461-2484. |
|
|
Marinova KG, Basheva ES, Nenova B, Temelska M, Mirarefi AY, Campell B, Ivanov B (2009). Physico-chemical factors controlling the foamability and foam stability of milk proteins: Sodium caseinate and whey protein concentrates. Food of Hydrocolloids 23(7):1864-1876. |
|
|
Nuñes FM, Coimbra MA (1998). Influence of polysaccharide composition in foam stability of espresso coffee. Carbohydrate Polymers 37(3):283-285. |
|
|
Nuñes FM, Coimbra MA, Duarte AC, Delgadillo I (1997). Foamability, foam stability, and chemical composition of espresso coffee as affected by the degree of roast. Journal of Agricultural and Food Chemistry 45(8):3238-3243. |
|
|
Prabhukumar S, Duraiswami R, Chahine GL (1996). Acoustic measurement of bubble size distributions: theory and experiments. The American Society of Mechanical Engineers Proceedings, Fluids Engineering Division, Summer Meeting 236:509-514. |
|
|
Pugh RJ (2016a). Bubble size measurements and foam test methods. In Bubble and Foam Chemistry. Cambridge University Press pp. 372-404. |
|
|
Pugh RJ (Ed.) (2016b). Bubble and Foam chemistry. Cambridge University Press, Cambridge. ISBN: 9781107090576. |
|
|
Silva S, Espiga A, Niranjan K, Livings S, Gumy J-C, Sher A (2008). Formation and stability of milk foams. Bubbles in Food 2. Elsevier, Amsterdam 2:153-161. eBook ISBN:9780128104590. |
|
|
Upadhyay R, Ghosal D, Mehra A (2012). Characterization of bread dough: rheological properties and microstructure. Journal of Food Engineering 109(1):104-113. |
|
|
Wu XJ, Chahine GL (2010). Development of an acoustic instrument for bubble size distribution measurement. Journal of Hydrodynamics 22(1):325-331. |
|
|
Yekeen N, Idris AK, Manan MA (2016). Experimental study of influence of silica nanoparticles on the bulk stability of SDS-foam in presence of oil. Journal of Dispersion Science and Technology 38(3):416-424. |
|
|
Yekeen N, Idris AK, Manan MA, Samin AM, Risal AR, Kun TX (2017) . Bulk and bubble-scale experimental studies of influence of nanoparticles on foam stability. Chinese Journal of Chemical Engineering 25(3):347-357. |
|
Copyright © 2024 Author(s) retain the copyright of this article.
This article is published under the terms of the Creative Commons Attribution License 4.0


