Full Length Research Paper

ABSTRACT
Inspection reports reflect daily operations of Food Service Establishments (FSE) with indications on levels of compliance with food safety standards and regulations, thus, making them central to the enforcement processes in food safety control systems. While compliance with food safety standards and regulations in FSEs is often viewed by the number of non-compliances or inspection violations cited during inspections, non-compliance with inspection recommendations may be an indication of continued non-compliance to the food safety standards. Using a cross-sectional study design, we assess the factors that influence compliance of FSE with inspection recommendations in Mansa Municipality, Zambia. This involved extraction of inspection process details from inspection reports for FSEs inspected was analyzed, followed by the administration of a questionnaire to FSE managers or owners on management and socio-economic factors. The data collected was subjected to both descriptive and inferential analysis. Importantly, the study results revealed that administrative enforcement, follow-up inspections, and reasonable time limits to make corrections are necessary factors to be considered in inspection processes for food establishments to comply with inspection recommendations. FSE owners compared to assigned managers exert more influence on the establishment’s compliance to inspection recommendations when actively involved in the daily operations. Well-operated inspecting institutions and FSE owners play key roles in facilitating FSEs' compliance with inspection recommendations as this ultimately facilitates compliance with food safety standards.
Key words: Compliance, Inspection recommendations, Inspection violation, Food Service Establishment, Foodborne illness.
INTRODUCTION
METHODOLOGY
Data collection
Data collected from inspection reports of 148 Food Service Establishments located in the municipal area for Mansa Municipal Council in Luapula Province of Zambia and the interviewed food service managers or owners were analyzed to establish what factors influenced the compliance of Food Service Establishments with inspection recommendations in Mansa Municipality. The review of inspection reports involved reviewing inspection process details and actions taken within the inspection cycle while taking note of the varying number and type of critical and non-critical violations cited in the subsequent inspection reports in the inspection cycle from the initial inspection. The inspection details and action taken included any administrative enforcement measures instituted by the inspecting institution (notices on closure of premises, withdrawal of licenses, or any other enforcement action taken by the inspecting institution), Follow-up inspections, Number of Inspections, Inspection frequency, and time limit given. This data was collected using a checklist. The food service managers or owners of the Food Service Establishments that had their inspection reports reviewed were then interviewed on the social-economic factors using a structured questionnaire. This included the gender, age, level of education knowledge of food safety of the FSE manager or owner. Other factors included the location, type or size of business, premise ownership, income, and the type of FSE (Restaurant, Butchery, or Bakery).
Data analysis
The data analysis methods used in this study included descriptive and inferential statistical analysis. For categorical variables, firstly, the number and percentages were reported by percentage and the actual number obtained, stratified by whether the Food Service Establishment complied or not with inspection recommendations. To test for any differences in the proportions, either the Chi-squared test or Fisher’s exact test was used depending on whether the assumptions of a Chi-squared test are satisfied or not. For continuous variables, the data were tested for normal distribution in a histogram. Then, if the variable follows a normal distribution, the mean and standard deviation were reported stratified by the dependent variable, otherwise, the median and interquartile range were reported, stratified by whether the Food Service Establishment complied or not with inspection recommendations. To check any differences in the continuous variables, either a t-test or Wilcoxon rank-sum test was used depending on whether the assumptions of a t-test were satisfied or not.
For inferential statistical analysis, bivariate logistic analysis was used to determine the strength of association between each independent variable and the food establishment’s compliance to inspection recommendations; and multiple variable logistic regression analysis was used to determine the strength of association between each independent variable and the Food Service Establishment’s compliance to inspection recommendations taking into account all other explanatory variables. Furthermore, the machine-led stepwise logistic regression was applied to check the best fitting model that explains the Food Service Establishment’s compliance to inspection recommendations cited in the inspection reports.
All statistical tests were set at a 95% confidence level, and at the same time, all analyses were performed using STATA software, version 14.2 SE (Stata Corporation, College Station, TX, USA). Additionally, all research ethics protocols were adhered to, including obtaining the necessary permission from the University of Zambia Biomedical and Research Ethics Committee (UNZABREC), the National Health Research Authority (NHRA), Mansa Municipal Council (MCM), and the individual FSEs that participated in the study.
RESULTS
Demographics of food service establishments
The study subjects included 148 food service establishments; restaurants 132/148 (89.19%), butchery 11/148 (7.43%), and bakery 5/148 (3.38%). Of the Food Service Establishments in the study, 43/148 (29.1%) complied with inspection recommendations, while 105/148 (70.9%) of the FSEs did not comply with inspection recommendations. At the same time, of the FSE’s that participated in the study, 24.32% were run by a male manager or owner, and 75.68% of FSE’s were run by a female manager or owner.
Descriptive analysis of common inspection violations cited in the inspection reports
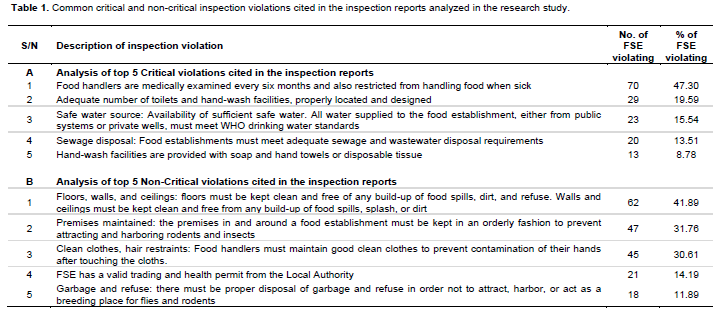
The analysis of the inspection reports indicated
that there were more non-critical inspection violations cited in the inspection reports than critical inspection violations. The average number of inspection violations observed per Food Establishment that was inspected was 2.89 inspection violations per inspection conducted. The average number of critical inspection violations cited in the inspection reports was 1.30 inspection violations per inspection; ranging from 0 to 4 inspection violations per inspection. On the other hand, the average number of non-critical inspection violations cited in the inspection reports analyzed was 1.59 inspection violations per inspection conducted and ranged from 0 to 5 inspection violations (Table 1).
Characteristics of Food Service Establishment’s compliance with inspection recommendations
The baseline factors influencing FSE’s compliance with inspection recommendations are presented as grouped into three including management factors, socio-economic factors, an lastly, inspection processes shown in Tables 2 to 4, respectively.
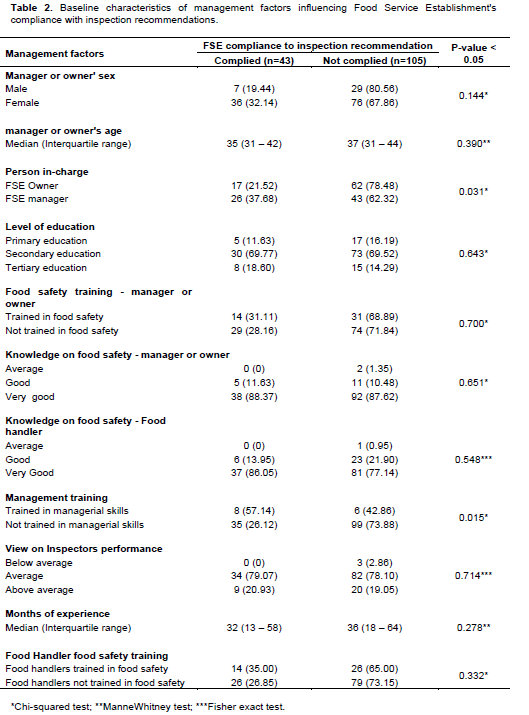
Management factors influencing compliance to inspection recommendations in Mansa district
Only 21.52% (n=17) of the FSE’s whose daily management of the establishment was by the owner of the food establishment complied with inspection recommendations compared to 37.68% (n=26) whose day to day management of the establishment was by a manager; and this difference was statistically significant (17 vs 26; p-value = 0.031). Similarly, there was a significant difference in compliance of FSE’s with inspection recommendations among FSE’s whose managers or owners have undergone management training and those that have not undergone any management training. Of the Food Service Establishments whose manager or owner had undergone management training to run the food establishment, 57.14% (n=8) complied with the inspection recommendations compared to 26.12% (n=35) that did not undergo any management training (8 vs 35; p-value=0.015).
However, there was no significant difference in the median age of manager or owner of the Food Service Establishments that took part in the study; the median age being 35 (interquartile range 31 - 42) in FSE’s that complied with inspection recommendations compared to 37 years (interquartile range 31 - 44) among those FSE’s that did not comply with inspection recommendations (35 years vs 37 years; p-value = 0.390). Additionally, there was no significant difference, statistically, between FSE’s whose managers or owners were male or female. Of the FSE’s that complied with inspection recommendations, 19.44% (n=7) of the FSE’s were managed by male FSE managers or owners compared to 32.14% (n=36) that were being managed by female FSE managers or owners (7 male vs 36 female; p-value 0.144). The level of education of the FSE’s manager or owner was indicated not to be statistically significant. Of the FSE whose managers or owners who have reached tertiary education, 18.60% (n=8) complied with inspection recommendations compared to 11.63% FSE managers or owners that had gone up to primary education or 69.77% of FSE managers or owners that had gone up to secondary education level.
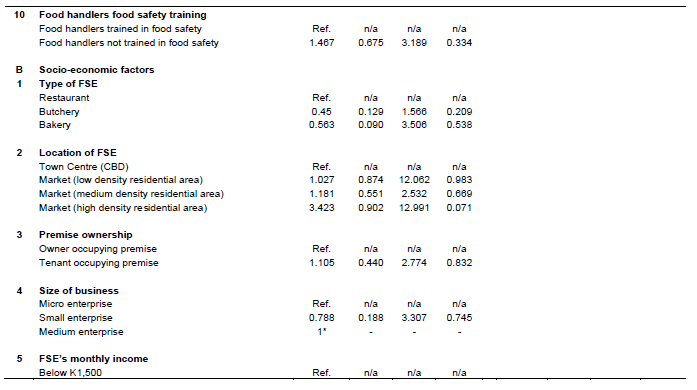
There was no significant difference in percentage between FSE’s that complied with inspection recommendations compared to those that did not comply concerning food handler food safety training.
For instance, of the food handlers that had been trained in food safety handling, 35.0% (n=14) worked for FSE’s that complied with inspection recommendations compared to 65.0% (n=26) that worked for the FSE’s that did not comply with inspection recommendations. However, the percentage difference was not statistically different (14 vs 26; p-value =0.333). Coupling training and knowledge of food handlers on food safety, the study results indicate that both factors had no effect in influencing overall compliance of the FSE with inspection recommendations.
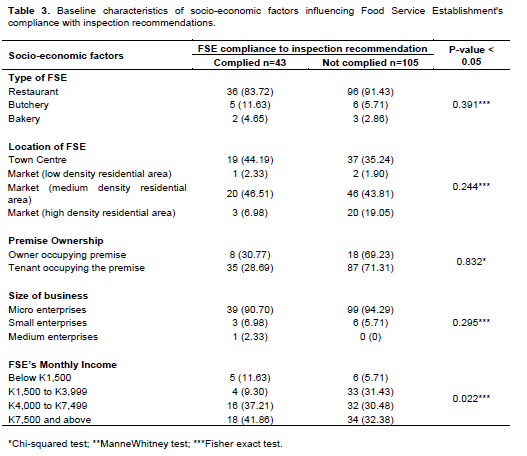
Socio-economic factors influencing compliance to inspection recommendations by FSE in Mansa district
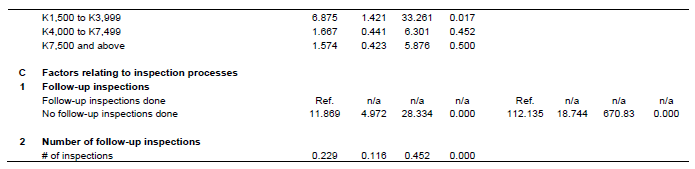
Only 11.63% (n=5) of the FSE’s had a monthly income below K1,500 complied with inspection recommendations compared to 9.30% (n=4) of FSE’s that had a monthly income between K1,500 and K4,000, and also compared to 37.21% (n=16) of FSE’s that had an income of between ≥ K4, 000 and ≤ K7, 500 and 41.86% (n=18) of FSE’s that had a monthly income of K7,500 and above. This difference in the relationship between the FSE’s monthly income and the compliance with inspection recommendations was statistically significant (5 vs 4 vs 16 vs 18; p-value = 0.022). At the same time, among the FSE’s that had a monthly income of K7,500 and above, 41.86% (n=18) complied with inspection recommendations compared to 32.38% (n=34) that did not comply with inspection recommendations.
However, there was no significant difference in the FSE’s that complied with inspection recommendations concerning the type of FSE, location of FSE, premise ownership, or the size of the FSE. Of those FSE’s that complied with inspection recommendations, 83.72% (n=36) of the FSE’s were restaurants compared to 11.63% (n=5) butcheries and 4.65% (n=2) bakeries (36 vs 5 vs 2; p-value = 0.391). Of the FSE’s that were occupied by the owner of the premise (this is where the owner of the premise was running a Food Service Establishment), 30.77% (n=8) complied with the inspection recommendations compared to 28.69% (n=35) that were occupied by a tenant (8 vs 35; p-value = 0.816).
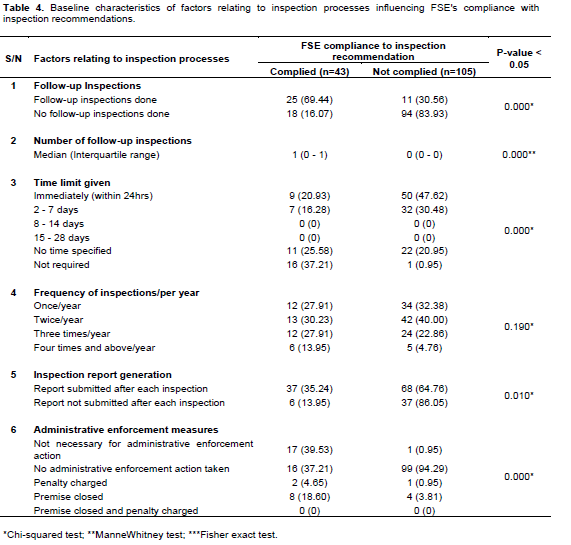
Inspection process factors influencing compliance to inspection recommendations by FSE in Mansa district
It was noted that of the Food Service Establishments that complied with inspection recommendations, 69.44% (n=25) of FSEs had received follow-up inspections to verify if the FSE had made corrective actions on the inspection violations compared to 16.07% (n=18) of the FSE that did not receive follow-up inspections of their premises; and this difference is statistically significant (25 vs 18; p-value <0.000). At the same time, there was a significant difference between those FSE’s that complied with inspection recommendations and those that did not comply with the various variables relating to whether the inspecting institution subjected administrative enforcementmeasures against those FSE’s that did not make correct the inspection violations cited in the initial inspection. For instance, 39.53% (n=17) of FSE’s whose inspecting institution did not institute administrative enforcement measures against complied with inspection recommendations compared to 94.29% (n=99) of the FSE’s that did not comply with the inspection recommendations (17 vs 99; p-value <0.000). Of the FSE’s that were issued with closure notices as an administrative enforcement measure taken by the inspecting institution, 18.60% (n=8) complied with inspection recommendation compared to 3.81% (n=4) that did not comply with the inspection recommendations; and this difference amongst the group was statistically significant (8 vs 4; p-value <0.000). Lastly, of the FSE’s that were given a time frame of 24 h to make corrective actions on the inspection violations sited during the initial inspection, 20.93% (n=9) FSE complied with inspection recommendations compared to 47.62% (n=50) of FSE’s that did not comply with inspection recommendations; and this difference is statistically significant (9 vs 47; p-value <0.000).
Factors influencing the compliance of food service establishment with inspection recommendations cited in the inspection report
Some factors remained statistically significant both as crude and adjusted levels; while others gained their statistical significance while taking into account the other factors (Table 5). Among the management factors assessed to whether they influenced the Food Service Establishment’s compliance with inspection recommendations, only factors including the manager or owner’s gender, the person in charge of the daily operation of the FSE, and management training indicated influencing FSE’s compliance with inspection recommendations after adjusting the odds ratios.
Whilst the majority of socio-economic factors indicated not influencing FSE’s compliance with inspection recommendations after adjusting the odds ratios except for the FSE’s monthly income. Food Service Establishments that earned a monthly income between K1,500 and K4,000, concerning those FSE’s that earned a monthly income below K1,500, indicated to influence the FSE’s compliance with inspection recommendations. Inspection processes that remained influential to the FSE’s compliance with inspection recommendations even after adjusting the odds ratio include that of follow–up inspections and administrative enforcement measures taken by the inspecting institution. While factors whose variables had indicated to influence the FSE’s compliance with inspection recommendations under crude odds ratios such as the number of follow-up inspections conducted by the inspecting institution, time limit given to the FSE to take corrective measures against the inspection recommendations, and inspection report generation indicated not to influence the FSE’s compliance with inspection recommendations after adjusting the odds ratios.
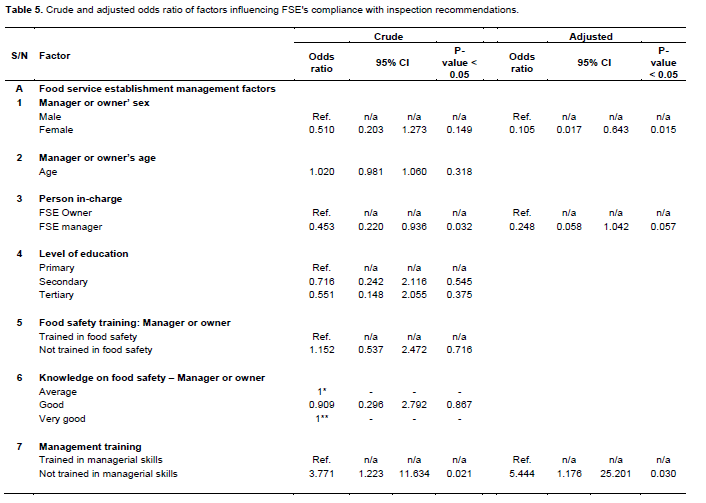
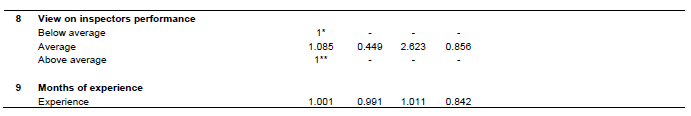
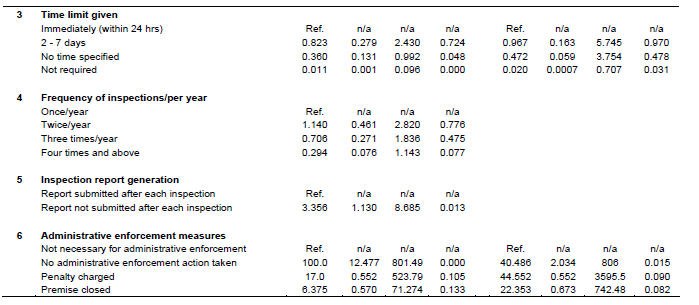
In the final model, the lack of conducting follow-up inspections to verify if the FSE had complied with the inspection recommendation and whether the inspecting institution took administrative enforcement measures against the FSE or not was seen to be associated with non-compliance with inspection recommendations cited in the inspection report by the FSE. Meanwhile, factors such as gender of FSE manager or owner, the person responsible for the daily management of FSE, and the time limit set for the FSE to make corrective actions were associated with enhancing the FSE’s chance of complying with inspection recommendations cited in the inspection report.
The odds of non-compliance of FSE’s with inspection recommendations cited in the inspection report was 112.135 (95% CI = 18.744 - 670.828; p-value > 0.000) times more in FSE that did not receive follow-up inspections to verify if the FSE had made corrective actions on the inspection recommendations cited in initial inspection than in FSE’s that received follow-up inspection. Similarly, the odds of FSE’s non-compliance with inspection recommendations in FSE’s managed or owned by female managers or owners were 0.105 times less than in FSE’s that were managed by male FSE managers or owners (95% CI = 0.017 - 0.643; p-value = 0.015). The odds of FSE’s non-compliance with inspection recommendations in FSE’s that had no necessity to be given time limits (as no inspection violations were cited during the initial inspection) was 0.020 (95% CI = 0.0007 – 0.707; p-value = 0.031) times less than in FSE’s that were given a time limit of 24 h (at most) to make corrective actions. The odds of FSE’s non-compliance with inspection recommendations cited in the inspections report in FSEs who did not receive any administrative enforcement measures by the inspecting institution was 40.846 (95% CI = 2.034 - 805.996; p-value = 0.015) times more than in FSE’s that had no necessity to receive administrative enforcement measures by the inspecting institution, taking into account the other factors. Additionally, the odds of FSE’s non-compliance with inspection recommendations in FSE’s whose daily management was by the manager for FSE was 0.248 (95% CI = 0.058 - 1.042; p-value = 0.057) times less than in FSE’s whose daily management was by the owner of the establishment.
Surprisingly, the association between the closure of a food establishment as an administrative enforcement measure taken by the inspecting institution and the FSE’s compliance with inspection recommendations cited in the inspection report was not statistically significant, with reference being compared with FSE’s that had no necessity for the inspecting institution to take any administrative enforcement measures against the food establishment. The odds of FSE’s non-compliance with inspection recommendations cited in the inspection report in FSE’s whose premises were closed to enhance compliance was 22.353 (95% CI = 0.673 - 742.481; p = 0.082) times more than FSE’s that had no necessity of taking administrative enforcement measures against them. Additionally, there was an insignificant association between compliance of any trading premise with inspection recommendations and closure of premise and having penalty fees charged against the FSE as an administrative measure taken by the inspecting institution.
Similarly, there was no statistical significance in the following: the associations between penalty charges as administrative enforcement measures taken by inspecting institution and the FSE’s compliance with inspection recommendations; the association between the time limit of 2 to 7 days of which the FSE is to make corrective actions and the FSE’s compliance with inspection recommendations; and that of the association between no time limit given or specified in the inspection report when the FSE is required to take corrective measures against the inspection violations cited in the inspection report and the FSE’s compliance with the inspection recommendations.
DISCUSSION
Of the factors reviewed in this study, the factors that influenced compliance of FSE’s with inspection recommendations in Mansa district in the period between 2018 and 2019 include FSE manager or owner’s gender; person responsible for the day-to-day management of the FSE; whether or not FSE received follow-up inspection; time limit set for the FSE to take corrective actions against the inspection recommendations cited in the inspection report; and administrative enforcement measures taken by inspecting institution. Kotsanopoulos and Arvanitoyannis (2017), noted that the mechanism of conducting inspections is meant to verify as to whether the premise being inspected is compliant with food safety principles, national food safety policies, and law. Thus compliance of the inspected Food Service Establishment (FSE) with the inspection recommendations completes the inspection cycle while giving an assurance that the FSE has fully complied with food safety principles and regulations. Our discussion concerning the findings of the study will be focused on the following.
Compliance levels of food service establishment’s with inspection recommendations
The results of the study showed that the prevalence of FSE’s compliance with inspection recommendations was low. The results indicated that the prevalence of FSE’s compliance with inspection recommendations was 29.1%. This finding is consistent but slightly lower than the quarterly environmental health HMIS records of 48.15% compliance of trading premises with inspection reports issued to them (Mansa DHO, 2018); while during the same period, the Provincial Health Office (2018) HMIS record on compliance of trading premises with inspection reports was 28%. In my view, the low prevalence rate for FSE compliance with inspection recommendations may have reflective implications such as having continued unhygienic conditions and standards in the FSEs that do not comply, loss of economic value of FSEs, unreliable inspection systems, and low expectations from the general public.
Inspection reports
The study results showed that the inspection violations cited in the inspection reports analyzed indicated that health inspectors had no structured inspection template that had a risk-based approach in which a wide range of food safety principles would be checked during the inspection. The approach of inspection reporting being used is where the inspector listed the findings and recommendations and this would result in the inspector not checking on compliance of the FSE on of the key food safety standards as the inspector is not properly guided on what to check for when conducting the inspection. While acknowledging the fact that there could be several factors that may influence the likelihood of writing down the inspection violations as noted in a study conducted in Indiana, United States of America (USA) by Johnson et al. (2014), it can be noted by the frequency of the inspection violations cited in the reports that inspectors tend to check for the same things over and over each time they went for inspections. A study conducted in Finland by Läikkö-Roto et al. (2015), revealed that the use of properly-outlined templates for inspections reports increased the number of inspected items and the number of inspection violations cited. The study results also confirm the findings in a study byMulat (2006), that indicated that most inspections conducted in Zambia were not focused. The analysis of the inspection reports suggests that most health inspectors make use of visual inspections to cite the violations recorded in the inspection report, with the implication that their recommendations are not aided by any laboratory investigations. Thus, knowing that there is a possibility that the inspectors may not have inspected some of the critical items, questions the FSE’s compliance to food safety standards and regulations.
Food service establishment management factors
The study results showed that FSE’s run by female FSE managers or owners were more likely to comply with inspection recommendations than male FSE managers or owners. The contrast between males and female FSE managers or owners was also noted in the number of females against females that ventured into setting up or getting employed in the Food Service Establishments (FSEs). There are more females in the foodservice business in Mansa Municipality than males (that is about 24% males against 75% females).
Dudeja and Singh (2016), suggest that both the FSE manager and owner are supposed to ensure that the food establishment is following all the food safety guidelines and principles. This may be different when we are considering the FSE’s compliance with inspection recommendations after the food establishment has been inspected. The results of this study showed that Food Service Establishments whose daily operations are managed by the owner of the FSE business are more likely to comply with inspection recommendations than those managed by the manager or any other employee. This may complement the idea that the FSE owner may be always the person to make a decision and source money to make corrective actions. However, the need for both the manager and the owner to ensure that the inspection recommendations are complied with is important as it facilitates the improvement of the establishment’s outlook and also increases customer confidence (Arendt et al., 2014); and at the same time reduce the chances for the inspecting institution from taking administrative actions.
Socio-economic factors
The study results indicated that the majority of socio-economic factors assessed in the study had no significant influence on the FSE’s compliance with inspection recommendations except for the FSE’s monthly income. Specific references are given on socio-economic characteristics such as the type of FSE (whether restaurant, bakery, or butchery), the location of the FSE, and whether the owner of the premise was the one operating the food establishment, did not influence the FSE’s compliance with inspection recommendations. This particular finding is consistent with other studies. A study by Yapp and Fairman (2006) found that small businesses are more likely to choose partial compliance or non-compliance than large businesses, with the lack of money being one of the factors observed as they tend to focus on business survival than compliance. It is, however not consistent with findings of a study conducted in Alabama, the USA by Menachemi et al. (2012), who observed that certain characteristics of restaurants were associated with particular types of inspection violations. At the same time, owing to the fact as observed earlier in the discussion that inspections conducted in Zambia were not focused and had no risk basis, is an indication that certain FSE characteristics such location of FSE or type of FSE would the affect the type of inspection violations cited and not influence the FSE’s compliance with inspection recommendations.
Inspection process factors
CONCLUSION
The study had sought to establish the factors that influence the compliance of FSE’s with inspection recommendations in Mansa Municipality in 2018 and 2019. The level of compliance of Food Service Establishments to inspection recommendations stood at 29.1%. The study results clearly show that unlike the full initial model developed in the conceptual framework, factors including FSE manager or owner’s gender; person responsible for the day-to-day management of the FSE; the monthly income for the FSE; whether or not FSE received follow-up inspection; and administrative enforcement measures are taken by inspecting institution influenced the compliance of FSE with inspection recommendations in Mansa Municipality.
It can thus be noted that throughout the inspection processes, factors such as food safety and management training of FSE managers and food handlers, frequency of inspections, and FSE’s manager’s level of education may influence the FSE’s compliance with food safety standards. While, factors such as inspection follow-ups, administrative enforcement measures, the time limit specified for the FSE to take corrective actions against the inspection violations cited in the inspection reports influence the FSE’s compliance with inspection recommendations and ultimately results in having the FSE fully comply with food safety standards.
Inspecting institutions and Food Service Establishment owners, therefore, play key roles in facilitating Food Service Establishments’ compliance with inspection recommendations as this ultimately facilitates compliance with food safety standards.
CONFLICT OF INTERESTS
The authors have not declared any conflict of interests.
REFERENCES
|
Appling XS, Lee P, Hedberg CW (2018). Risk factor violations associated with sporadic salmonella cases. Front Public Health 6:355. |
|
|
Arendt SW, Roberts KR, Strohbehn CH, Meyer J (2014). Motivating foodservice employees to follow safe food handling practices: Perspectives from a multigenerational workforce. Journal of Human Resources in Hospitality and Tourism 13(4):323-249. |
|
|
British Columbia- MOH (2006). Evidence Review - Food Safety. Core Public Health Functions for British Columbia 38. |
|
|
Cseke P, Heacock H, Sidhu B, Mcintyre L, Wilcott L (2014). Inspecting inspection reports, does the type of restaurant change the risk. BCIT Environmental Health Journal. |
|
|
Dudeja P, Singh A (2016). Chapter 20 - Role of food business operators in food safety, in Rajul Kumar Gupta, Dudeja and Singh Minhas (ed.) Food Safety in the 21st Century: Public Health Perspective pp. 263-268. |
|
|
Hoag MA, Porter C, Uppala PP, Dyjack DT (2007). A risk-based food inspection program. Journal of Environmental Health 69(7):33-36. |
|
|
Irwin K, Ballard J, Grendon J, Kobayashi J (1989). Results of routine restaurant inspections can predict outbreaks of foodborne illness: The Seattle-King County Experience. American Journal of Public Health 79:5. |
|
|
Johnson AC, Almanza BA, Nelson DC (2014). Factors that influence whether health inspectors write down violations on inspection reports. Food Protection Trends 34:11. |
|
|
Jones TF, Pavlin BI, Lafleur BJ, Ingram A, Schaffner W (2004). Restaurant inspection scores and foodborne. Illnesses Emerging Infectious Diseases 10(4):688-692. |
|
|
Kassa H, Silverman GS, Baroudi K (2010). Effect of a manager training and certification program on food safety and hygiene in food service operations. Environmental Health Insights 4:7. |
|
|
Kettunen K, Pesonen S, Lundén J, Nevas M (2018). Consistency and risk-basis of using administrative enforcement measures in local food control. Food Control 85:199-211. |
|
|
Kirandeep KB (2016). Analyzing Interrelationships Between Food Safety Practices and Inspections Among Food Staff in Manitoba. Ph.D., Walden University. |
|
|
Kotsanopoulos KV, Arvanitoyannis IS (2017). The role of auditing, food safety, and food quality standards in the food industry: A review. Comprehensive Reviews in Food Science and Food Safety 16(5):760-775. |
|
|
Kwon J, Choi YG, Liu P, Lee YM (2012). Food safety training needed for Asian restaurants: Review of multiple health inspection data in Kansas. Journal of Foodservice Management and Education 6(6):10-12. |
|
|
Kwon J, Roberts KR, Sauer K, Cole KB, Shanklin CW (2014). Food Safety Risks in Restaurants and School Foodservice Establishments: Health Inspection Reports. Food Protection Trends 34(1):25-35. |
|
|
Läikkö-Roto T, Mäkelä S, Lundén J, Heikkilä J, Nevas M (2015). Consistency in inspection processes of food control officials and efficacy of official controls in restaurants in Finland. Food Control 57:341-350. |
|
|
Lee B (2013). Food Safety Interventions: Effect of Routine Inspection on Improving Food Hygiene at Food Service Establishments. National Collaborating Centre for Environmental Health. Available at: View |
|
|
Leinwand SE, Glanz K, Keenan BT, Branas CC (2017). Inspection Frequency, Sociodemographic Factors, and Food Safety Violations in Chain and Nonchain Restaurants, Philadelphia, Pennsylvania, 2013-2014. Public Health Reports 132(2):180-187. |
|
|
Luapula Provincial Health Office (2018). Luapula Province 2018 Environmental Health Indicators: Extract of 2018 Luapula Province yearly DHIS2 summary. Luapula Provincial Health Office. |
|
|
Makombe D, Chungu K, Kasase C (2017). The evaluation of food hygiene knowledge, attitudes and practices (KAP) of food handlers in food service establishments (FSE) in a peri-urban municipality of Zambia. The International Journal of Multi-Disciplinary Research 19 p. Available at: |
|
|
Mansa District Health Office (2018). Mansa District 2017 and 2018 Environmental Health Inspection of premises: extract from the DHIS2. Mansa District Health Office. |
|
|
Mathias RG, Sizto R, Hazlewood A, Cocksedge W (1995). The effects of inspection frequency and food handler education on restaurant inspection violations. Canadian Journal of Public Health 86(1):46-50. |
|
|
Menachemi N, Yeager VA, Taylor DM, Braden B, Mcclure LA, Ouimet C (2012). Characteristics of restaurants associated with critical food safety violations. Food Protection Trends 32:7. available at: View |
|
|
Mulat A (2006). Zambia - Annex 3: Assessment of the Capacity of Food Safety and Quality in Zambia. WORLD-BANK (ed.). |
|
|
Mwamakamba L, Mensah P, Kwakye TA, Darkwah-Odame J, Jallow A, Maiga F (2012). Developing and maintaining national food safety Control Systems - Experiences from the WHO African Region. African Journal of Food, Nutrition, and Development 12(4):6291-6304. |
|
|
Newbold KB, Mckeary M, Hart R, Hall R (2008). Restaurant inspection frequency and food safety compliance. Journal of Environmental Health 71(4):56-61. |
|
|
Nieboer J, Reader T, Leardini D (2015). Consistency and cognitive influences on the expert judgment of Environmental Health Officers. Food Standards Agency. Available at: |
|
|
Petran RI, White BW, Hedberg CW (2012). Health department inspection criteria more likely to be associated with outbreak restaurant in Minnesota. Journal of Food Protection 75(11):2007-2015. |
|
|
Phillips ML, Elledge BL, Basara HG, Lynch RA, Boatright DT (2006). Recurrent critical violations of the food code in retail food service establishments. Journal of Environmental Health 68(10):8. |
|
|
Powell DA, Erdozain S, Dodd C, Costa R, Morley K, Chapman BJ (2013). Audits and inspections are never enough: A critique to enhance food safety. Food Control 30(2):686-991. |
|
|
Public Health Act: Chapter 295 of the Laws of Zambia. |
|
|
Seaman P, Eves A (2006). The management of food safety - The role of food hygiene training in the UK service sector. International Journal of Hospitality Management 25(2):278-296. |
|
|
Yapp C, Fairman R (2006). Factors affecting food safety compliance within small and medium-sized enterprises: implications for regulatory and enforcement strategies. Food Control 17(1):42-51. |
|
Copyright © 2024 Author(s) retain the copyright of this article.
This article is published under the terms of the Creative Commons Attribution License 4.0


