Full Length Research Paper
ABSTRACT
This work investigated the human health risk effects of heavy metal contamination at Galena mining area. 10 elements were identified in both irrigated and wet season edible crops and fish were collected from five sampling locations at Galena mining area. Wet season crops held higher concentrations of heavy metals than irrigated crops. Study showed carcinogenic heavy metals Pb (1.42 E +08), Cd (1.36 E +14), Cr (1.31E – 07), As (3.92 E -06), Co (9.42E + 12), Cd (1.36 E +14) while non-carcinogenic heavy metals exposure showed assessment of health risk which indicated three major exposure pathways for people: ingestion, dermal contact and inhalation for non-carcinogenic while carcinogenic metals were exposure through ingestion and inhalation only. HI and HQ levels are < 1 indicating health risks of heavy metals in crops and fish, while carcinogenic Pb showed higher HI through ingestion by children and adults exposure. In this study, the routes of heavy metals exposure especially Pb as the major constituent element of galena was greater than 1.0 indicating higher health risks hence adequate diagnosis should be upheld in the area.
Key words: Galena, heavy metal, carcinogenic, non-carcinogenic, health risk
INTRODUCTION
Sediments and associated minerals conceived many heavy metals due to chemical weathering from rock surfaces; they are released into the environment at various rates and their concentrations from natural materials which are considered as pollutants, such as arsenic released from the weathering of arsenical pyrite (Gordon et al., 1999). Cadmium is a heavy metal with high toxicity and it is a non-essential element in foods and natural waters that accumulates principally in the kidneys and liver. Higher values of Cadmium have been previously reported for leafy vegetables cultivated along road sides (0.27 mg/kg) by Oluwole et al. (2013). Pb is also a highly toxic and carcinogenic metal causes chronic health risks, including headache, irritability, abdominal pain, nerve damages, kidney damage, blood pressure, lung cancer, stomach cancer and gliomas. The children are most susceptible to Pb toxicity, their exposure to high levels of Pb cause severe health complexities such as behavioral disturbances, memory deterioration and reduced ability to understand, while long-term Pb exposure may lead to anemia (Koki et al., 2015). Chromium is known to help maintain normal blood glucose levels by enhancing the effects of insulin (Chove et al., 2006). The most widespread human effect is chromium allergy caused by exposure to body, especially Cr6+ compounds are assumed to cause cancer risk.
Arsenic, for instance, is regarded a human carcinogen from extremely low levels of exposure. Acute exposure to arsenic compounds may cause nausea, vomiting, abdominal pain, muscle cramps and diarrhoea while chronic exposure is associated with peripheral nerve damage causing diabetes (Caspah et al., 2016). Cobalt is also the required metals needed for normal body functions as a metal component of vitamin B12. However, high intake of Co via consumption of contaminated food and water can cause abnormal thyroid artery, polycythemia, over-production of red blood cells (RBCs) and right coronary artery problems as reported by (Koki et al., 2015).
Humans are exposed to heavy metals at the vicinity of Galena mining area through inhalation of air pollutants, consumption of contaminated drinking water, exposure to contaminated soils or industrial waste, or consumption of contaminated food. The sources of food affected are commonly grown daily consumed vegetables, grains, fruits, fish and shellfish can become contaminated by accumulating metals from surrounding soil and water as reported by Abhishek and Surendra (2016). This research was aimed to assess the level carcinogenic heavy metals in commonly consumed vegetable and grains species in the vicinity of galena mining area, and also to assess the potential health risk levels with their daily exposure rate and impacts on humans.
MATERIALS AND METHODS
Sediments sampling
Sediment sampler was used to collect bottom sediment samples at center of Mine Lake by the effort of a good swimmer at different locations of about 100 m apart. The equipment for these sampling varies with deep of water and texture of the sediment. Five samples was collected and kept in polythene bag for the analysis as adopted by Titus et al. (2012).
Plants sampling
The plants collected are; Maize (Zea mays), Rice (Oryza glaberimo), Beans (Phaseohus vulgaris), Tomato (Lycopericon esculentum), and Okro (Hibiscus esculentum ). Five samples at interval of 5 m apart of the above-mentioned plants were collected at two locations of Nahuta Upstream and Nahuta Downstream along the mining site during dry and raining seasons. The sampling method adopted was to ensure relation to proper identifications of species and constituents present in the samples. Samples collected was kept in polythene bags to avoid evaporation of important constituents and later dried and preserved for analysis at the laboratory as adopted by Titus et al. (2012).
Fish sampling
Five commonly occurring species of fresh catch of fish was purchased at the mine lake bank at Nahuta from the fishermen as stated by Titus et al. (2012). Fish samples were preserved in coolers in contact with ice blocks and taken to the laboratory for analysis. The species used are; Tilapia (Oreochromis niloticus), Mudfish (Clarotex anguillaris), Catfish (Clarotex laticeps), Trunk fish (mormyrus rume) and Nile tilapia (Heterotis niloticus).
Water sampling
Water samples was collected using water sampler by submerging the sampler bottle when close into the water location and opened up to collect water and then capped while submerged to avoid mixing with contaminants as adopted by APHA (1992). Water samples was also collected in plastic sample bottles, thereafter each sample of water was mixed with 1.5 ml of 70% HNO3 in a litre that gave a pH < 2 for preservation due to analysis of elements present.
Study area
Galena mining Area at Nahuta is located at latitude 10° 48’ 42” E and longitude 9° 34’ 45” N along Futuk Road near Yalo in Alkaleri Local Government Area of Bauchi State. The village was located on bearing of 180° South of Yalo, whereby the direction of Nahuta is about 20 km drive from Yalo. The village can also be accessible from Billiri Road heading to Kashere in Gombe State or preferrably from Alkaleri Road leading to Yalo in Bauchi State. In terms of size, the village occupied a total land area of about 10 km2 (Futuk, 1975). Geologically, Nahuta has a Bima-formation rock types with few mining settlements having sparse population of about 2000 per square km. The mining operation started as far back in 1990, and the initial mining state was carried out by local miners, which was later sponsored by Chinese based company. The mineral exploration methods are underground mining. The Galena mining at this area is currently used for export purpose.
Sampling and sample preparation
Plants samples analysis
Collected plants and vegetable samples from different locations were washed with water to remove impurities. Succulent’s samples such as okro and tomatoes were cut and sliced for easy drying while hard grains like rice and maize were chaffed to remove pericarp and the endocarp was then grinded into powder form using mortar and pestle. The samples was dried at constant weight at 90°C in an oven and quartered to obtain a 100 g of representative fraction for analysis as described by Titus et al. (2012).
Fish samples analysis
Fish species that have been used for this analysis are; Tilapia (O. niloticus), Mudfish (C. anguillaris), Catfish (C. laticeps) and Trunk fish (M. rume). Fish species were treated differently by removing the parts and dried in an oven at 105°C at constant weight. Thereafter, samples were pulverized in a clean mortar dried, was then sieved to less than 125 um, quartered to obtain 100 g of representative fraction and stored in plastic bottles for analysis as adopted by Titus et al. (2012).
Digestion methods for preparation of MP-AES
Method involving sample preparation procedure in relation to the acid digestion of sediments, sludge, and soils was used. A short description of this digestion procedure was given below. Initially, 10 cm3 of 1:1 HNO3 was added to 1.00 g of soil sample in a 25 × 150 mm glass digestion tube. The samples were then heated to 95 ± 10°C for about 15 min. When cool, 5 cm3 of HNO3 was added and heat was applied for another 30 min. The digests were again allowed to cool, before 2 cm3 of Milli-Q water and 3 cm3 of 30% H2O2 was added and heated to 95 ± 5°C. After the digests were cooled again, another 1 cm3 of 30% H2O2 was added. Heating continued until the sample volumes reduced to approximately 5 cm3. The digests were then allowed to cool again before being diluted to 50 cm3 with Milli-Q water. Prior to analysis, the soil digests were further diluted ten-fold. The 2% moisture content given in the certificate of analysis of the sample was incorporated into the calculation on specific intensities that would analyze metals contents present (Stefan et al., 2014).
RESULTS AND DISCUSSION
Heavy metals exposure analyzed were determined through three pathways of ingestion, inhalation and dermal intake of heavy metals from the soil through various routes that grasped the crops, and exhibits health risk effects on humans. The results of the enrichment factors ranged from insignificant to moderate contamination of heavy metal elements at sample locations. The hazard quotient (HQ) evaluation investigations of non-carcinogenic effects, showed ingestion to be the route of exposure to soil dust that results in a higher risk for heavy metals, followed by dermal contact as stated by Afrifa et al. (2015). Hazard Index of non-carcinogenic Heavy metals showed greater than one, indicating likely adverse health risk effects. Carcinogenic heavy metals showed highest Hazard Index through inhalation of Pb (1.79 E + 07) as well as highest Hazard Index through ingestion.
Concentrations of irrigated and wet seasons sample contaminated by heavy metals
Table 1 showed mean concentrations of heavy metals in fish exposed Pb = 162.228 ± 352.33 mg/kg as the highest followed by Fe with 14.7 ± 8.237 mg/kg, and ± 0.588 mg/kg, while Ni = 0.0098 ± 0.0061 formed the least among them.

Wet season beans at Galena mine area showed highest concentrations of Fe = 6.58 ± 10.601 mg/kg in irrigated beans but shows Fe = 13.16 ± 14.345 mg/kg in wet season beans due to constant absorption of Fe cations by the roots of beans during wet season. Both irrigated and wet season beans showed the same concentration of Pb = 0.010 ± 0.050 mg/kg. Mn = 0.1 45 ± 0.374 mg/kg and 0.25 ± 0.374 mg/kg for irrigated and wet season beans. Irrigated beans showed Cr = 0.172 ± 0.0018 mg/kg while wet season beans showed Cr = 0.21 ± 0.0084 mg/kg.
Irrigated maize showed highest concentrations of Fe = 2.89 ± 5.167 mg/kg in irrigated maize and Fe = 3.102 ± 4.836 mg/kg in wet season maize, while the least concentration Co = -0.0290 ± 0.0775 in irrigated maize and Co = 0.0332 ± 0.0089 mg/kg in wet season maize.
Irrigated okro showed Fe = 1.0263 ± 0.1841 mg/kg in irrigated okro and Fe = 1.850 ± 0.011 mg/kg in wet season okro. Pb = 0.239 ± 0.320 mg/kg in irrigated and Pb = 1.413 ± 2.234 mg/kg in wet season okro, while Cr = 0.0224 ± 0.0043 mg/kg in irrigated okro and Cr = 0.0132 ± 0.0013 mg/kg in wet season is the lowest. Adedokun et al. (2016) reported that heavy metals content in vegetables across the markets ranged as follow; Cd (0.05 – 0.20 mg/kg); Pb (0.34 – 5.44 mg/kg), Zn (4.21 – 20.80 mg/kg), Cr (0.25 – 1.51 mg/kg), Ni (0.13 –2.91 mg/kg) and Cu (2.34 – 14.08 mg/kg).
Wet season and irrigated rice showed concentrations of Fe in irrigated rice is higher than wet season rice with values of 5.006 ± 7.179 mg/kg compared to 2.825 ± 0.371 mg/kg followed by concentrations of Fe in irrigated rice that is higher than wet season rice with values of 5.006 ± 7.179 mg/kg compared to 2.825 ± 0.371 mg/kg. Chromium showed Cr = 0.0198 ± 0.0055 mg/kg in irrigated rice compared to Cr = 0.0144 ± 0.0023 mg/kg of wet season rice as the lowest.
Tomatoes of wet season showed mean Fe = 2.545 ± 2.621 mg/kg in irrigated tomatoes compared to Fe = 5.70
± 6.264 mg/kg in wet season tomatoes; thus, Fe concentrations in wet season tomatoes are higher than irrigated samples followed by Zn = 1.633 ± 3.123 mg/kg in irrigated tomatoes and Zn = 0.295 ± 0.377 mg/kg of wet season tomatoes. Cr = 0.0164 ± 0.00288 in irrigated tomatoes compared to 0.0150 ± 0.0031 mg/kg in wet season tomatoes showed the lowest concentrations. In comparison, Adedokun et al. (2016) reported that heavy metals content in vegetables across the markets ranged as follow; Cd (0.05 – 0.20 mg/kg); Pb (0.34 – 5.44 mg/kg), Zn (4.21 – 20.80 mg/kg), Cr (0.25 – 1.51 mg/kg), Ni (0.13 –2.91 mg/kg) and Cu (2.34 – 14.08 mg/kg).
Concentrations of heavy metals analyzed showed that Fe = 2.5 mg/kg and 5.7 mg/kg in tomatoes and 1.2 mg/kg in beans, while As = 1.54 ± 0.186. Other heavy metals of Zn, Pb, Mn Fe and As in fish and rice contain higher proportion above Mn = 0.1- 0.4 mg/kg, Fe = 0.06- 0.05 mg/kg, As = 0.01- 0.31 mg/kg, Cd = 0.03 mg/kg, Cu = 2.0 mg/kg, Pb = 0.01 mg/kg as reported by Khan et al., 2008) along with NAFDAC as recommended levels, while Co, Mn and Cr concentrations in edible crops of maize, okro and tomatoes at Nahuta remain harmless in all the edible crops with range values of 0.01 to 0.05 mg/kg. Results also exposed that fish surviving within the Nahuta Galena mine lake should be avoided completely due to high concentrations of harmful heavy metals that have health risk. Wet season crops held higher concentrations of heavy metals than irrigated crops due to effects of percolations and erosion process, hence contamination affect the edible crops at the vicinity of Galena mine area which are generally harmful when exposure daily as food.
Health risk assessment exposure
Health risks assessment of carcinogenic and non-carcinogenic risk through heavy metals present in some edible crops and fish samples at Nahuta Galena mine area has been determined to be above 1.0 from the mean concentrations of heavy metals using exposure pathways of inhalation, ingestion and dermal to determine health risk human as evidence for taking decision (USEPA, 1989; Hu et al., 2016, 2017). Other studies by Abhishek and Surendra (2016) reported that calculated Average Daily Exposure (ADE) of heavy metals of As (0.74 mg/kg), Hg (1064.61 mg/kg) Cr (86.18 mg/kg) and Pb (23.22 mg/kg) for the different samples of different locations were compared to reference value of USEPA (1989). Generally, the hazard Index (HI) obtained for the heavy metals (V, Cr, Mn, Cu, Zn and Pb) below 1.0, indicate non-cancer adverse health effects to be most unlikely. Cancer risk index evaluated for Pb was below 1.0 which shows little or insignificant cancer adverse effect (Afrifa et al., 2015). Meanwhile, Adedokun et al. (2016) reported that THQ values range showed that Cd was0.048 – 0.192, Pb was 0.150 – 0.587, Zn was 0.021 –0.190, Cr was 0.0001 – 0.001, Ni was 0.050 – 0.120 and Cu was 0.148 – 0.239.
Based on the THQ equation and the RfDs of heavy metals published by the United States Environmental Protection Agency (USEPA), the safety limits of heavy metals in seafood were Cr (2.9 mg/kg), Cu (3.9 mg/kg), Zn (292 mg/kg), Cd (1.0 mg/kg), Hg (0.1 mg/kg), As (2.9 mg/kg) and Ni (19 mg/kg) as reported by (Koki et al., 2015). Methods adopted was through USEPA (1989) and are mentioned below.
Ingestion of heavy metals through soil

Inhalation of heavy metals via soil particulates

Dermal contact with soil

Where AD (mg/kg-1 day-1) is the absorbed dose of exposure to through ingestion (ADing), inhalation (ADinh), and dermal contact (ADder)
CS = Chemical concentration in soil (mg/kg)
IRing = Ingestion rate (mg soil/day): 100 mg/day (Liu et al., 2013; USEPA, 2011)
FI = Fraction ingestion from contaminated source: 1 at reasonable maximum exposure (USEPA, 2011).
EF: Exposure frequency: 350 days for non-carcinogenic effect (Liu et al., 2013; USEPA, 2011).
SA= Exposure skin area: 5700 cm3 (USEPA, 2011; Liu et al., 2013).
AF: Soil to skin adherence factor (mg/cm3): 0.07 mg/cm3 (USEPA, 2011; Liu et al., 2013).
ABS: Absorption factor (mg/cm3) 0.03 (As) 1 (USEPA, 2011; Liu et al., 2013).
BW: Body weight in (kg): 70 kg for adult average (USEPA, 1989).
PEF: P article Emission factor: 1.36 × 10⁹ m3.kg-1 (Liu et al., 2013).
AT: Average: 365 × ED for non-carcinogenic effect and 365 × 70 for carcinogenic effect.
CF: Conversion factor (10-6) (USEPA, 2011; Liu et al., 2013).
Non-carcinogenic risk assessment
The hazard quotient (HQ) represents the potential non-carcinogenic risk for an individual heavy metal. The HQ is the ratio of mean daily exposure dose (AD) to the reference dose (RfD) in mg/kg/day (USEPA, 2011; Hu et al., 2017).

Reference dose for (RfDing.) ingestion, (RfDinh.) inhalation and (RfDderm.) dermal constant values of heavy metals for this research have been estimated as;
The RfDing (mg/kg/day) of heavy metals values are; Cd = 1.00 x 10⁻³, Cr = 3.00 x 10⁻³ , Co = 3.00 x 10⁻⁴, Cu = 4.00 x 10⁻² Pb = 3.5 x 10⁻³, Zn = 3.00 x 10⁻¹ (Zheng et al., 2015), Mn = 1.40 x 10⁻¹, As = 3.00 x 10⁻⁴ (Bortey-Sam et al., 2015), Ni = 2.00 x 10⁻² (Caspah et al., 2016), and Fe = 7.00 x 10⁻¹ (Patrick et al., 2014).
The RfDinh (mg/kg/day), constant values are; Cd = 1.00 x 10⁻³, Cr = 2.86 x 10⁻⁵, Co = 5.71 x 10⁻⁶, Cu = 4.02 x 10⁻², Pb = 3.52 x 10⁻³, Zn = 3.00 x 10⁻¹ (Zheng et al., 2015), Mn = 1.84 x 10⁻⁵, As = 3.00 x 10⁻⁴, Ni = 0 (Caspah et al., 2016), and Fe = 8.25 (Patrick et al., 2014).
The RfDderm(mg/kg/day),constant values are; Cd = 1.00 x 10⁻⁵, Cr = 6.00 x 10⁻⁵, Co = 3.00 x 10⁻², Cu = 1.20 x 10⁻², Pb = 5.25 x 10⁻⁴, Zn = 6.00 x 10⁻² (Zheng et al., 2015), Mn = 1.84 x 10⁻³, As = 1.23 x 10⁻⁴, Ni = 5.6 x 10⁻³ (Caspah et al., 2016) and Fe = 7.00 x 10⁻¹ (Patrick et al., 2014).
Hazard index and daily exposure dose of heavy metals within the Galena mining area
Hazard Index was expressed in Figure 1 where Cr showed the highest hazard Index of 5.08E+01 while Cd showed the lowest hazard index of 0.00E+00. Figure 2 showed As metal with Hazard Index of 8.29E+17 and Mn with least values of Hazard Index crop plants and aquatic animals was analyzed at the vicinity of Galena mining area using the formula above.


Figure 3 showed daily dose exposure of Pb with 7.67E 00, Fe (5.17E + 00), Zn (1.98E + 00), Ni (2.02E + 00) and Mn showed 1.29E + 07, indicating that Pb showed higher daily dose while Pb was below 1.0 as reported by Afrifa et al (2015). Figure 4 showed the daily exposure dose whereby Cu showed 2.01E -07 followed by Cr with 3.11E -03, while Cd showed the least daily exposure dose of 2.79E -07. However, Figure 5 showed the highest daily exposure dose revealed by Co with 1.04E +15 whereas Arsenic metals showed 1.02E +14.


The daily exposure dose of heavy metals of analyzed in samples shown on Table 2 within the vicinity of Galena mining area were expressed in decreasing order of Co > As > Pb > Fe > Ni > Zn > Mn > Cu > Cd > Cr. Hazard Index are determined through three different pathways of ingestion as shown in Table 3. Inhalation and dermal are both in agreement with research reported by Zheng et al. (2015).


Carcinogenic risk assessment
Carcinogenic risk assessment of samples within the Galena mining area
Carcinogenic effects of risk assessment are determined through ingestion and inhalation while dermal pathways are neglected only for carcinogenic heavy metals such as Cd, Co, Cr, As and Pb as reported by Caspah et al. (2016). Average daily intake (ADI) values in mg/kg/day for adults and children in soil from the mining area for carcinogenic risk calculations are as reported by Afrifa et al. (2015).
Tables 4 and 5 showed carcinogenic cancer risk assessment determined by multiplying daily exposure dose by their corresponding slope factor of individual carcinogenic heavy metals to arrive at cancer risk values. Slope factor for ingestion in mg/kgday-1 of As = 1.50E + 00, Pb = 8.50E -03, Cr = 5.0E – 01, Co = 0, while slope factor for inhalation of carcinogenic heavy metals are As = 1.50 E + 01, Pb = 4.20 E – 02, Cd= 6.30 E + 00, Cr = 4.10 E + 01, and Co = 9.80 E + 00 (Caspah et al., 2016; Zheng et al., 2015).
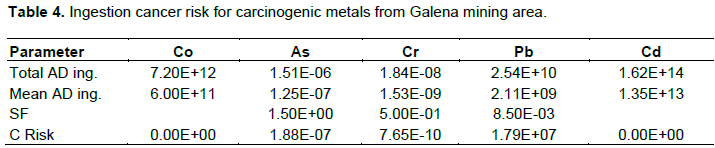

Figure 6 showed mean carcinogenic cancer risk of heavy metals analyzed within the Galena mining area, whereby Cd inhalation showed 1.36E +14 while ingestion in Cr was 0.00E + 00. Highest prolonged inhalation risk index of all the carcinogenic metals go to Cd in the analyzed heavy metals within the Galena mining area. The major constituent metal of Galena was Pb which has carcinogenic inhalation risk of 1.42E +08 but ingestion risk of only 1.79E + 07, Co has inhalation risk index values of 9.42E + 12 but showed zero ingestion risk index. Cr showed inhalation risk index of 1.31E – 07 compared to 7.65E -10 ingestion risk index. Arsenic heavy metal (As) showed inhalation risk index of 3.92 E -06 while ingestion risk index of As showed only 1.88E -07.

Mean inhalation of carcinogenic heavy metal cancer risk index was 2.91 E + 13 while mean ingestion of carcinogenic heavy metal cancer risk index was 3.58E + 06 respectively. Cancer risk index of carcinogenic heavy metals analyzed within the Galena mining area follows the order Cd > Co > Pb > As > Cr, through inhalation risk index, while ingestion cancer risk index order was Pb > Cd > Co > As > Cr as related to Afrifa et al. (2015).
Carcinogens are assumed to have no effective threshold. This assumption implies that there is risk of cancer developing with exposures at low doses and, therefore, there is no safe threshold for exposure to carcinogenic chemicals. Carcinogens are expressed by their Cancer Potency Factor (Koki et al., 2015).
CONCLUSIONS
The heavy metal contaminations at Galena mining area of Nahuta were investigated in this study. Hazard index of non-carcinogenic heavy metals showed greater than one, indicating likely adverse health risk effects. Carcinogenic heavy metals showed in Figure 6 revealed highest Hazard Index through inhalation of Pb (1.42 E +08), Cd (1.36 E +14), Cr (1.31E – 07), As (3.92 E -06), Co (9.42E + 12), and Cd (1.36 E +14) while Pb (1.79 E + 07) showed highest hazard index through ingestion. Children are more vulnerable to health risks at Galena mining area due to their constant incorporation to soil, air and water pollutants.
CONFLICT OF INTERESTS
The authors have not declared any conflict of interests.
ACKNOWLEDGEMENT
The authors thank ABU Zaria Multi User Laboratory for the assistance rendered during instrumental analysis of MP AES (Micro Plasma Atomic Emission Spectroscopy) of elements present in some edible crops and fish throughout the research period.
REFERENCES
|
Abhishek D, Surendra R (2016). Assessment of Health Risk due to Contaminated Soil and Remediation Techniques - A Case Study. Resources and Environment 6(6):148-153. |
|
|
Adedoku AH, Njoku KL, Akinola MO, Adesuyi AA, Jolaoso AO (2016). Potential Human Health Risk Assessment of Heavy Metals Intake via Consumption of some Leafy Vegetables obtained from Four Market in Lagos Metropolis. Nigeria. Journal of Applied Sciences and Environmental Management 20(3):530-539. |
|
|
Afrifa CG, Ofosu FG, Bamford SA, Atiemo SM, Aboh IJK, Gyampo O, Ahiamadjie H, Adeti JP, Arthur JK (2015). Health Risk Assessment of Heavy Metal Exposure from Soil Dust at Selected Fuel Filling Stations in Accra. International Journal of Science and Technology 4(7):289-296. |
|
|
APHA Awwa, WEF (1992). Standard Methods for Examination of Water and Waste Water 18th ed. APHA, Washington D.C. USA. pp. 78-109. |
|
|
Bortey-Sam N, Nakayama SMM, Ikenaka Y, Akoto O, Baidu E, Mizukawa H (2015). Health risk assessment of heavy metals and metalloid in drinking water from communities near Gold mines in Tarkwa Ghana. Environmental Monitoring and Assessment 187(7):397. |
|
|
Caspah K, Manny M, Morgan M (2016). Health Risk Assessment of Heavy metals in soil from Witwatersrand Gold mine basin South Africa. International Journal of Environmental Research and Public Health 13(7):663. |
|
|
Chove BE, Ballegu WR, Chove LM (2006). Copper and Lead levels in two popular leafy vegetables grown around Morogoro Municipality, Tanzania. Tanzania Health Bulletin 8(1):37-40. |
|
|
Futuk Sheet 172 E (1975). Topographical map of Futuk, Alkaleri Local Government, Bauchi State, Nigeria. Published by Federal Surveys of Nigeria 1-2. |
|
|
Gordon EB, Andrea LF, John DO (1999). Mineral surfaces and bioavailability of heavy metals: A molecular-scale perspective. Proceedings of the National Academy of Sciences 96(7):3388-3395. |
|
|
Hu B, Jia X, Hu J, Xu D, Xai F, Li Y (2017). Assessment of Heavy metal Pollution and Health Risk in Soil- Plant- Human System in the Yangtze River Delta China. International Journal of Environmental Research and Public Health 14(9):1042. |
|
|
Hu WY, Huang B, He Y, Yusef KK (2016). Assessment of potential health risk of heavy metals in soil from rapidly developing region of China. Human and Ecological Risk Assessment 22:211-212. |
|
|
Khan S, Cao Q, Zheng YM, Huang YZ, Zhu YG (2008). Health risks of heavy metals in contaminated soils and food crops irrigated with wastewater in Beijing, China. Environmental Pollution 152(3):686-692. |
|
|
Koki IB, Amina SB, Aminu U, Sabo Y (2015). Health risks assessment of Heavy metals in Water, Air, Soil and Fish. African Journal of Pure and Applied Chemistry 9(11):204- 210 ISSN 1996- 0840. |
|
|
Liu X, Song Q, Tang Y, Li W, Xu J, Wu J, Wang F, Brookes PC (2013). Human health risk assessment of heavy metals in soil-vegetable system: A multi-medium analysis. Science of the Total Environment 463:530-540. |
|
|
Oluwole SO, Makinde OSC, Yusuf KA, Fajana OO, Odumosu AO (2013). Determination of Heavy Metal Contaminants in Leafy Vegetables Cultivated By the Road Side. International Journal of Engineering Research and Development 7(3):1-5. |
|
|
Patrick O, Michael B, Grace A (2014) Health Risk pose by Pb, Cu and Fe via consumption of organs meats in Kampala city (Uganda). Journal of Environmental Pollution and Human Health 2(3):69-73. |
|
|
Stefan K, Viktor S (2014). Analysis of Acid Rock Drainage (ARD) with Micro Plasma Atomic Emission Spectroscopy (MP-AES) comparism with ICP-MS. An Interdisciplinary response to mine water challenges - Sui, Sun & Wang (ends). China University of Mining and Technology press Xuzhou pp. 131-135. |
|
|
Titus HT, Maina HM, Barminas JF (2012). Impact of heavy metals contamination on soil and metal toxicity on cultivated plants in the vicinity of Dandinkowa dam reservoir, Gombe State, Nigeria. Africa Journal of Physical Sciences 5(3):121-133. |
|
|
USEPA (1989). Risks Assessment Guideline for superfund volume 1. Human health Evaluation Manual (Part A). Interim Final. Office of Emergency and Remedial Response. US Environmental Protection Agency Washington D.C. 20450. EPA/540/1-89/002 |
|
|
USEPA (2011). Regulatory Impact Analysis. Final National Ambient Air Quality Standard for Ozone. US Environmental Protection Agency Office of Air and Radiation. Office of Air Quality Planning and Standard. |
|
|
Zheng X, Zhao W, Yan X, Shu T, Xiong O, Chen F (2015). Pollution Characteristics and Health Risk Assessment of Airborne Heavy metals collected from Beijing Bus stop. International Journal of Environmental Public Health 12(8):9658-9671. |
|
Copyright © 2024 Author(s) retain the copyright of this article.
This article is published under the terms of the Creative Commons Attribution License 4.0


