Full Length Research Paper
ABSTRACT
Crude palm oil is most worlds widely used oil, due to its nutritional and economic advantages. The proximate and physicochemical properties of fifty samples from local mills in Southern Nigeria were analyzed to determine their applicability as food and industrial usage applying standard procedures. The obtained results were: Moisture content (1.51 to 2.46%), ash content (0.30 to 0.50%), crude lipids (68.82 to76.77%), crude protein (2.44 to 3.25), carbohydrate (17.34 to 22.02%), energy value (697.80 to 716.04 Kcal/g), melting point (31.11 to 34.03°C), refractive index (1.465 to 1.469), specific gravity (0.8980 to 0.9140 g/mL), while viscosity ranged from 24.698 to 63.823 mPs. Others were saponification value (199.22 to 203.55 mg KOH/g), acid value (1.526 to 2.190 mg KOH/g), ester value (197.75 to 201.99 mg KOH/g), free fatty acid (0.719 to 1.090 mg KOH/g), peroxide value (3.186 to 5.450 mEq/g) and iodine value (45.57 to 50.60 Wij’s). The results showed good food and industrial applications except high moisture content which was above 0.29% recommended standard and may lead to short shelf life, therefore proper monitoring of local mills for effective standard operating procedures are required to reduce contamination which might have adverse health and economic effects.
Key words: Oil palm, food and industrial application, adverse health, economy effect.
INTRODUCTION
Crude palm oil is an edible vegetable oil extracted from the fruits of oil palm (Elaeis guineensis) which is originally inhabitant of West Africa’s tropical rain forests (FAO, 2015). The palm trees were cultivated both in wild and in plantation in Africa and Asia where countries like major Indonesia, Malaysia, Thailand, Nigeria and Colombia are producers of palm oil and it is consumed as food and utilized as vegetable oil worldwide (Uning et al., 2020; Shahbandeh, 2021). In Africa, oil palm thrives in West and Central African countries such as Nigeria, Benin, Togo, Ghana, Cote de ’Ivoire, Liberia, Sierra Leone, Cameroun, Angola, Congo and Angola, while in Nigeria the main oil palm belt area is the Southern region, which covers the South-West, South-Eastern and South-South regions (Raw Materials Research and Development Council, Nigeria, 2004).
Naturally, crude palm oil contains the highest known concentration of agriculturally derived carotenoids when compared to other vegetable oils. In fact, it is the world’s richest natural plant source of carotenes in terms of retinal (vitamin A). It also contains about 15 to 300 times as many retinal equivalent as carrot, leafy green vegetables and tomatoes (Tan, 1989) while its red colour looks like that of the pulp and this is as a result of high content of beta carotene that differentiates the palm oil from kernel oil or coconut oil (Akinola et al., 2010). It is an essential component of the diet in many homes, in Nigeria and West Africa due to its wider application in food production (Uning et al., 2020). According to the United States Department of Agriculture, in 2020, over 75 million tons of palm oil were produced worldwide by major players (USDA, 2021), which were more than the quantities in million tons of other vegetable oil (soybean, sunflower, and canola oil) and amounting to one-third of vegetable oil production in the world (Oosterveer, 2020). Palm oil has a wider application in foods and non-food applications, especially in food and pharmaceutical industries (Sampaio et al., 2017). It is also one of the main alternatives for biofuel production in the following years (Pirker et al., 2016).
The United State Food and Drug Administration required mandatory trans-fatty acids labeling on packaged foods from January 1, 2006, prompting food manufacturers to find alternatives to commercially?hydrogenated vegetable oils for bakery products, margarines and fried foods. In this context, palm oil provides the best natural replacement for commercially produced hydrogenated vegetable oils, as it is naturally solid (Mensink et al., 2003).
According to Njoku et al. (2010) the locations of fatty acids and type of fatty acid on the glycerol molecule indicate the number of different triglycerides whereby about 7 to 10% of saturated triglycerides predominantly give tripalmitic acid and fully unsaturated triglyceride constitute about 6 to 12%. The triacylglycerols in palm oil partially determine most of the physical characteristics of palm oil such as melting point, refractive index, viscosity, crystallization behaviors and so on.
The Association of Analytical Chemist indicated the importance of proximate composition of food and animal feed stuffs, and was developed to provide a high level and very broad classification of food components. Also, the analysis should be a routine test that involves the quantification of the amount of moisture content, ash content, crude fat/lipids (solvent extraction), crude fiber, crude protein, carbohydrate, nitrogen free content (NFC) which is more or less representing sugars and starch, is calculated by difference rather than measured by analysis. Thus, there should be good information about any feed (AOAC, 2005).
Frazier and Westhoff (1978) define moisture content of any food as an index of its water activity (aw). It has been established that the moisture content of palm oil depends directly on the strictly adherence to the final extraction and clarification processes which determine the chemical activities in the food, while it also determines the shelf-life and storage period (Poku, 2002; Orji and Mbata 2008).
Furthermore, Onyeike et al. (2002) investigated the proximate composition, energy content and physicochemical properties of Nigerian edible fats and oils such as groundnut oil, red palm oil, blue band margarine and butter. The proximate parameters determined were moisture, ash, crude protein, crude fat/lipids, carbohydrate, and calorific levels while typical physiochemical properties were colour, odour/aroma, texture, melting point, boiling point, flash point, saponification number, iodine number, free fatty acid level, saturated and unsaturated fatty acids and pH. The results obtained were, moisture content (0.77%), Ash content (0.66%), crude protein (2.89%), crude fat/lipid (94.10%), carbohydrate content (3.87%) and calorific or energy content (869.29 kcal/100 g). The physicochemical results were; melting point (29°C), pH (7.35), saponification value (198.97 mgKOH/100 g), iodine value (52.00 Wij’s). It was concluded that the results obtained demonstrated high nutritional value of edible fats and oils consumed in most Nigerian homes.
Akinola et al. (2010) also studied the physicochemical properties of palm oil from different palm oil local factories in Nigeria with the aim of determining the beta-carotenes content, saponification values, acid value, free fatty acid, ester value, refractive index, melting point and peroxide value in order to establish their suitability for use as food. The results obtained revealed that beta-carotene was in the range of 0.958 to 0.982 µg/100 g, peroxide value, 3.20 to 4.33 Mq/Kg; iodine value, 0.717-1.516 Wij’s; saponification value, 196.35-207.22 mgKOH/g, acid value, 0.552 to 2.617%; ester value, 196.075 to 205.91 mgKOH/g; melting point, 41- 48°C; specific gravity, 0.904 to 0.918; and refractive index, 1.439 to 1.4637. The study showed that palm oil produced at different local factories in Western Nigeria displayed varied physicochemical properties, which tend to reflect the stability and quality of the palm oil, and that temperature affects the physicochemical properties of palm oil and β-carotene contents that decreased with increasing temperature. This confirms the effect of heating on beta-carotene contents of palm oil and reduces its nutritive value as source of vitamin A. Meanwhile, the global consumption per day of palm oil was 0.017 pounds (7.7 g) per person per day in 2015 (Raghu, 2017) and the consumption trend has increased to 30.4 g in 2017/2018 (Statista, 2018). Crude palm oil had found its way into the global economic importance in food and non-food uses. Therefore, this study focused on the proximate constituents and some physicochemical properties of crude palm oil produced from local palm oil mills in Southern part of Nigeria in order to meet National and international standard limits of vegetable oils.
MATERIALS AND METHODS
Sample collection
The crude palm oil samples were collected from local palm oil mills along the major high ways from five states: Oyo, Osun and Ondo in South-West; Bayelsa and Rivers in South-South regions of Nigeria. The crude palm oil were collected with aseptically cleaned, dried and properly labeled amber bottles, after cooling to room temperature; the crude palm oil was well arranged in a cooler and then transported to the Department of Pharmaceutical and Medicinal Chemistry Laboratory, Niger Delta University, Wilberforce Island, Bayelsa State and stored in the refrigerator at about 4°C pending analyses.
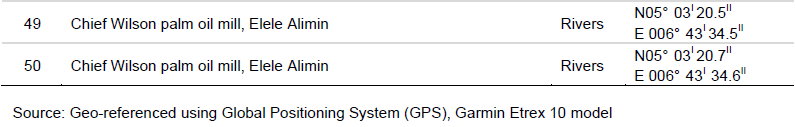
In each of the states, crude palm oil samples were collected from ten different palm oil processing mills along the road. Ten samples were collected in each state during the period of sampling. The sampling locations were geo-referenced using Global Positioning System (GPS), Garmin Etrex 10 model. The sampling locations are shown in Figure 1 while the descriptions of the sampling locations are stated in Table 1.


Proximate analysis of crude palm oil
In the proximate analysis, the parameters determined were moisture content, ash content, crude protein, fat and oil content, carbohydrate and energy value.
Determination of moisture content
The moisture content of the crude palm oil samples was determined by hot air oven drying method. Three grams (3.0 g) of the samples were weighed into crucibles of known weight and were placed into an oven operated at 105°C for 3 h. The crucibles were allowed to cool in desiccators and then re-weighed. The crucible with the sample were returned to the oven and dried further and re-weighed. The process of drying, cooling and re-weighing was continued until a constant weight was obtained (AOCS, 1990; AOAC, 2005; Salimon and Ahmed, 2012; Bahadi et al., 2016). The percentage moisture content was calculated using Equation 1.

Where W1 = weight of empty crucibles; W2 = weight of empty crucible + sample; W3 = weight of crucible + dried sample.
Determination of ash content
Two grams (2 g) of crude palm oil samples were weighed into pre-weighed crucible. The crucibles with their contents were placed in a furnace set at 550°C for 6 h after which it was carefully removed from the furnace and allowed to cool before being re-weighed. The process was continued until a constant weight was obtained. The percentage ash content was calculated using Equation 2.

Where W1 = weight of empty crucibles; W2 = weight of empty crucible + sample; W3 = weight of crucible + ashes sample.
Determination of crude protein
Crude protein is the amount of protein present in a food sample and this can be obtained in terms of nitrogen content of the samples. Protein is the major compound containing nitrogen (minor nitrogenous ingredients of food include amino acids, ammonium salts and vitamins) (Oshodi, 1992; AOAC, 2005). The following steps are involved in the determination of crude protein:
(i) Digestion: The crude protein was determined by Kjeldahl method. Two grams (2 g) of Crude Palm oil sample was weighed into 100 ml Kjeldahl digestion flask. One gram (1 g) of Kjeldahl catalyst mixture (Na2SO4 + CuSO4) and 15 mL of conc. H2SO4 were then added. The mixture was digested on an electro-thermal heater until the digestion mixture turned clear (when a grey white colour was obtained). This indicates complete digestion of the sample, then allowed to cool and made up to 50 mL with distilled water and preserved for distillation step.
The nitrogen in the sample was reacted with ammonia and H2SO4 to form (NH4)2SO4 as presented in Reaction 1:
H2SO4 + 2NH3 → (NH4)2 SO4 (Reaction 1)
(ii) Distillation: This step was carried out using a distillation apparatus set. Five milliliters (5 mL) of 4% boric acid (H3BO3) was used to trap the ammonia vapour down from the digested sample and three (3) drops of mixed indicator were added. The receiving flask was then placed in such a way that the tip of the condenser tube was below the surface of the boric acid. Exactly 10 mL of the digested sample was pipetted into the distiller and 10 mL of 4% NaOH was added until the mixture turned alkaline. The distillation processes are as presented in Reactions 2 and 3.
(NH4)2 SO4 + 2NaOH → Na2SO4 + 2NH3 + 2H2O (Reaction 2)
3NH3 + H3BO3 → (NH4)3BO3 (Reaction 3)
(iii) Titration: Fifty milliliters (50 mL) of the distillate was titrated against 0.1 M HCl solution using 3 drops of mixed indicator (5.0g bromocresol green and 1 g methyl red in 100 ml of ethanol) were added. At the end-point, the colour changed from light blue to pink. A blank (a distillate without CPO sample digest) was conducted simultaneously under similar experimental conditions. The process is as expressed in Reaction 4.
NH3 + H3BO3 + HCl → NH4Cl + H3BO3 (Reaction 4)
The percentage nitrogen was then calculated using Equation 3:

Where: M = molarity of acid; T = control titer value; W = weight of the sample; V1 = volume of the digest; V2 = volume of the digest used. % crude protein = 6.25 × % N (where 6.25 is the conversion factor). The conversion of nitrogen into % crude protein shows the quantity present in the CPO sample.
How to apply Equation 3
Sample titer = T1; molarity of the acid = M. Blank Titer = T2; Control titer = T2 - T1 = T; V1 =Volume of CPO sample digested = 50 mL; V2 = Volume of the digest used =10 mL.

The reaction formula was derived thus:
Since the mole ratio = 1:1

Determination of crude lipids content
Crude fat or lipid was determined by Soxhlet extraction system. A previously dried filter paper was weighed (W1), while 3 g of frozen crude palm oil sample was weighed into the filter paper (W2). The crude palm oil and filter paper were tightened very well with white tread and transferred into a thimble, a round bottom flask filled with n-Hexane, up to about 2/3 of a 500 mL flask. The Soxhlet extractor was then fitted up with a reflux condenser connected and the heat source of the extractor was adjusted so that the solvent boiled gently and it was left to siphon for 8 h, after which when the filter paper became white and then removed. The filter paper and defatted samples were dried in the oven at 50°C for about 30 min. The sample was allowed to cool down in a desiccator and re-weighed (W3). The percentage crude fat or lipid content was calculated using Equation 5:

Where: W1 = weight of the filter paper; W2 = weight of filter paper and freeze crude palm oil; W3 = weight of the filter paper + crude palm oil residues.
Determination of carbohydrate
The total carbohydrate present in the crude palm oil samples were determined by difference using Equation 6:
%Carbohydrate =100% - (% moisture + % Ash + % Protein + % Fat) (6)
Determination of energy value
The energy values (kcal/g) of the samples were estimated by multiplying percentage crude protein, crude lipid and carbohydrate by the recommended factor (3.44, 8.37 and 3.57 respectively) used in vegetable and seed analysis. Thus, Energy value = (crude protein x 3.44) + (crude lipid × 8.37) + (carbohydrate × 3.57) (Oshodi, 1992; AOAC, 2005).
Determination of physicochemical parameter of crude palm oil samples
Standard methods as described in AOAC (2005) and applied in some studies (Olaniyi and Ogungbmila, 1998; Akinola et al., 2010; Prasanth and Gopala, 2015) were adopted and applied in this study. They are as described below for the determination of saponification value, acid and free acid content, ester value, specific gravity, viscosity, melting point, iodine value, refractive index, peroxide value and free fatty acid.
Determination of saponification value
Saponification value is the amount of alkaline necessary to saponify a definite quantity of the sample (oil). It is expressed as the number of milligrams of potassium hydroxide (KOH) required for saponifying 2.0 g of the crude palm oil sample. The smaller the saponification number, the larger the average molecular weight of the triacylglycerol present in the oil (this implies that if saponification number is small the level of triacylglycerol breaking into fatty acids is higher). The equation of the reaction is as stated below:
C3H5 (C17H35COO)3 + 3KOH → C3H5(OH)3 + 3C17H35COO-K+ (Reaction 5)
Triacylglycerol + Potassium hydroxide → Triglycerol + Soap molecules
Two (2.0 g) grams of crude palm oil was weighed accurately and put into a conical flask containing 25 mL of 0.5 M alcoholic KOH. A reflux condenser was fitted to the flask containing the ionic solution and heated in a water bath for an hour swirling the flask frequently. The excess KOH was titrated hot with 0.5 M HCI using 1 ml of phenolphthalein (1%) solution as an indicator. The saponification value was calculated from the difference between the blank (aqueous solution without crude palm Oil sample) and the sample titration.

Where B = titer value of blank (aqueous solution without oil sample); A = titer value of oil sample; W= Weight of sample; 28.05 = mg of KOH equivalent to 1 ml of 0.5 M HCI.
Determination of acid value and free fatty acid content
Equal volume of diethyl ether and ethanol were mixed (1:1) and 1 ml of phenolphthalein solution (1%) was added. Ten grams (10 g) of oil was dissolved in the solvent and titrated with an aqueous 0.1 M KOH, shaking constantly until a pink colour which persists for 15 s was obtained (AOAC, 2005; Kowalska et al., 2020). The volume of KOH used was recorded. Thus,

Determination of ester value
The ester value is obtained by subtracting acid value from saponification value. Ester value is obtained by finding the difference between the saponification value (SV) and acid value (AV) as expressed in Equation 10
Ester Value = S.V- A.V (10)
Determination of specific gravity
Specific gravity was determined using density bottle to measure the ratio of the mass of a given volume to the mass of an equal volume of water. The specific gravity decreases with increased temperature and decreases slightly as viscosity decreases for similar compositions.

W1 = weight of empty density bottle with cover; W2 = weight of density bottle + distilled water; W3 = weight of density bottle + crude palm oil.
Determination of viscosity
Viscosities of oil samples were determined using Brookfield Rapid Viscometer Analyzer (RVA) model-NDJ-5S equipped with number one (1) spindle. The spindle number 1 was suspended in crude palm oil sample mixture and stirred for 1 min at speed of 100 revolutions per minutes (RPM) at ambient temperature. The spindle was allowed to rotate in the oil for duration of 1 min awaiting the reading on the meter monitor to be stable and the viscosity value was recorded (Isaac and Adejumo, 2010; Japir et al., 2017).
Determination of melting point
The melting point was determined using AOCS method (1990). The capillary tubes non-heparinized were sealed at one end using a Bunsen flame and then were inserted into the blended crude palm oil samples to obtain a 10±2 mm long columns of oil sample. The capillary tubes with the oil sample were kept in a refrigerator for three days during which the oil became solidified, the thermometer and sample tube were carefully inserted into the melting point apparatus (Galling kamp model) and the temperature reading when the frozen oil started melting and finally melted were recorded as the ranges of melting point of the samples.
Determination of iodine value
Crude palm oil sample was accurately weighed (0.20 g) into a dry 500 mL iodine flask and 10 mL of carbon tetrachloride was added to break the matrixes of the oil sample. Then, exactly 20.00 mL of 0.2 M iodine mono-chloride (ICl) (Wijs’ reagent) solution was added and moistened with potassium Iodide (15 ml of 10% w/v KI) the flask was covered and allowed to stand for 30 min in the dark at room temperature. At the expiration of the time 100 mL of distilled water was added and shaken vigorously. Precautions were taken to avoid escape of iodine mono-chloride vapor while adding the solutions. The content of the flask was titrated with 0.1 M Sodium thiosulfate (0.1M Na2S2O3) solutions and starch mucilage was added towards the end-point, as an indicator. The amount of mL required was noted as (‘S’ mL). Also, another titration was carried out in the same manner but without crude palm oil sample and noted the amount of 0.1 M Na2S2O3 used (‘B’ mL) and triplicate determinations was made, then iodine value of crude palm oil was calculated (Olaniyi and Ogungbamila, 1998; AOAC, 2005; Akinola et-al., 2010; Prasanth and Gopala, 2015). Hence,

A= titer value of crude palm oil sample; B= blank titer value; S= Samples titer value; N- Is the normality of the Sodium thiosulfate in mEq/L; 12.69 is the conversion factor from mEq/L Sodium thiosulfate to gram of Iodine (the molecular weight of Iodine is 126.9 g mol-1). W is the weight of the crude palm oil sample in grams.
Determination of refractive index
Refractive indices of oil samples were determined in triplicates at room temperature, using Abbe refractometer manufactured by Vision Scientific Japan. The thermometer was connected to the machine while film of crude palm oil sample was introduced into the prism block and the knob was adjusted until the crossed wire was observed through the eye piece, the sample showed at half within the cross wire, then the value was recorded from scale eye piece (Olaniyi and Ogungbamila, 1998; AOAC, 2005).
Determination of peroxide value
The peroxide value was determined by titrating chloroform/glacial acetic acid/potassium iodide solution of the oil with an aqueous solution of sodium thiosulfate using starch as an indicator. About 10 g of oil was weighed into the 250 mL conical flask. A mixture of glacial acetic acid and chloroform (30 mL) was added in a ratio of 3:2 mL and 1 mL saturated potassium iodide solution was also added. The mixture was properly shaken after adding 30 mL of water. The solution was then titrated with 0.01M sodium thiosulfate, until a yellow colour was observed. Approximately 5 mL of starch indicator was added to the titration process while shaking vigorously until a blue-black colour was observed. A blank (sample devoid of CPO) was also analyzed using the same procedure. The peroxide value was expressed mathematically as follows:

Where S = Sample titrated titer value; B = Blank titer value; M = Molarity of sodium thiosulfate; W = Weight of sample.
Statistical analysis
The data obtained were subjected to statistical analyses; mean, standard deviation and one way ANOVA to determine significant differences among the samples. All statistical analyses were done at the 95% confidence limit. The data analyses were performed using SPSS program version 17, Excel Package and Statistical Software version 16.
RESULTS AND DISCUSSION
The results obtained for proximate analysis and ANOVA of the crude palm oil samples are tabulated in Table 2A and B while the results for the physicochemical parameters are tabulated in Table 3.


Proximate composition of crude palm oil sampled from the five states
Moisture content
The moisture content for the five states ranged from 1.51% in Bayelsa State to 2.46% in Ondo State as shown Table 2A. The mean % M.C from the five states were in the order ON>OS> OY>RV>BY. Analysis of Variance revealed that there was no significant difference among the states with respect to moisture content (p>0.05) except between Bayelsa and Ondo (Table 2B). The values obtained from samples analyzed in all the states were above the Standard Organization of Nigeria limits difference (p < 0.05) while Osun has no significant 0.29% (SON, 2000). The high moisture content could be attributed to the traditional method of processing of the crude palm oil, where the water was used in excess in partition of oil from the chaff before clarification in the traditional method of processing in the South-West. The use of hydraulic and screw press for the extraction of palm oil from the South-South might also be responsible for the comparatively low level of moisture content (Aremu et al., 2015).
The moisture content of oils is an important parameter in assessing the quality of an oil sample. The moisture content level of any food is an index of its water activity which means high moisture content is an indication of ease of deterioration, microbial growth and rancidity as well as short shelf-life (Frazier and Westhoff, 1978). This implies that the samples showing higher values are susceptible to short shelf life due to microbial degradation and endogenous enzymes activities. To this end, such palm oil samples must be given short storage period.
In a similar study, Samuel et al. (2018) reported a range of 0.96 to 1.17%, for moisture content while a value of 0.32% was obtained by Enyoh et al. (2017) who reported that the values might be because the local producers do not boil the crude palm oil to reduce the moisture content, which might also be a reason for high moisture content obtained in this present study.
The moisture content in the five states was in the order Ondo (2.46 %) > Osun (1.83 %) > Oyo (1.78 %) > Rivers (1.76 %) > Bayelsa (1.51 %). Rivers and Bayelsa States being more riverine are expected to have higher moisture content in their palm oils however, the reverse is the case. This could be as a result of the differences in the palm oil processing methods. While in the south-west, the process involves the use of water in the extraction process; in the south-south, machines are used to compress the oil out of the fruits (Aremu et al., 2015). It has been established that the moisture content of palm oil depends directly on the final extraction and clarification processes (Poku, 2002; Orji and Mbata, 2008). Water is an unusual component of oil and fat, as the two are non-miscible and the presence of water can be compatible only at very low proportions (Enemuor et al., 2021). However, even very low moisture contents could be harmful to oil and fat products, as the presence of residual water is not important, but a catalyst for almost all chemical degradation reactions. Hence, determination of the moisturecontent generally provides a good indication of the level of the other quality parameters and can also be of assistance to predict subsequent variation. Furthermore, the presence of high moisture content enhances oxidative degradation and result in high peroxide value for fats and oils. However, the harmful effect of high moisture content on CPO is more in the rancidity of the oil.
Ash content
The results for ash content in Table 2A show that the average ash content for the five states ranged from 0.30% in Bayelsa State to 0.50% in Osun State sample. The analysis of mean variance shows that there was significant difference at p< 0.05; Bayelsa and Osun, 0.003403, and Bayelsa and Ondo, 0.005589 samples (Table 2B) while there was no significant difference amongst other states. The ash content in the five states was in the order Osun > Ondo > Oyo > Rivers > Bayelsa. The results were below the recommended standard limits of <1% and this content is used to determine the mineral content of the original samples. The results obtained were far lesser than what Adetuyi et al. (2014) reported for palm oil (1.04%) from Ondo State, while Olagbemide and Philip (2014) also reported ash content (3.87%) for Moringa oleifera oil. Thus, ash in food constitutes is the residue remaining after all the moisture and organic materials (fats, proteins, carbohydrates, vitamins, organic acids e.t.c) have been burnt away by ignition at high temperature. In general, the mineral elements in foodstuff are normally small (less than 1% of the food) (Onwuka, 2005; AOAC 2005).
Crude lipid/ fats
The crude lipid content result is as presented in Table 2A for the five states which ranged from 68.82% in Bayelsa State to 76.77% in Osun State as the minimum and maximum mean values. Meanwhile, in terms of significant comparison Osun, Bayelsa and Rivers had significant difference (p< 0.05) with Oyo State samples while Ondo had no significant difference between with Oyo and other state samples. The crude lipid/fat content in the five States was in the order Osun (76.77 %) > Rivers (76.48 %) > Ondo (74.36 %) > Oyo (73.14 %) > Bayelsa (68.82 %) as also shown in Table 2A. It has been established that palm oil fruit contain a high amount of oil (Aribido et al., 2001). Meanwhile, the samples analyzed in this study, were not the palm fruits but the extracted crude palm oil which might be mixed fruit of the hybrid and local palm fruits hence, a higher yield for crude lipids. Aremu et al. (2015) reported that oil seeds are those seeds that contain considerably large amounts of oil. However, the different methods used in some local mills resulted in production of oil of different qualities. The traditional/local channel most of the palm oil is produced by women using manual traditional method namely mortar and pestle and the extracted crude palm oil usually released is only 25% of the available oil in the fruit (Enyoh et al., 2017). This practice may reduce the quality of the extracted palm oil.
Crude protein
Crude protein content results for the five states ranged from 2.44% in Oyo State to 3.35% in Bayelsa State and crude protein content in the five States was in the order Bayelsa (3.25%) > Rivers (3.14%) > Ondo (2.91%) > Osun (2.88%) > Oyo (2.44%) as shown in Table 2A. The Ondo, Bayelsa and Rivers State samples had significant difference (p >0.05) with any of the states (Table 2B). This indicates that the crude palm oil produced in the study areas could be used for food enrichment and against malnourishment. Meanwhile, the results of crude protein from this work is compared well with what Adetuyi et al. (2014) who reported protein of 3.27% in red palm oil and Ouattara et al. (2015) also reported protein content ranged from 12.93 and 19.96% in the seed of Sesamum indicum. Proteins are polymers of amino acids, most of which are α-amino acids having the general formula NH2CHR2COOH and it is the only macronutrient in foods that contains nitrogen. Hence, the nitrogen in proteins becomes the basis of the estimation of protein in food (Oshodi, 1992; Onwuka, 2005).
Carbohydrate content
The results obtained for carbohydrate content from the crude palm oil samples for the five states ranged from 17.34% in Osun to 22.02% in Oyo samples as the lowest and the highest values (Table 2A). Carbohydrate content in the five states was in the order Oyo (22.02%) > Ondo (19.78 %) > Bayelsa (18.66%) > Rivers (18.29%) > Osun (17.34 %) with significant difference (p<0.05) among Osun, Bayelsa and Rivers State samples compared to Oyo State samples as shown in Table 2. Meanwhile, the carbohydrate was estimated by differential method where % Available carbohydrates = 100- (% moisture + % ash + % crude protein + % crude fiber + crude lipid or fat) (AOAC, 2005).
Energy value
The results obtained for energy value in crude palm oil samples ranged from 675.63 Kcal/g in Oyo to 716 04 Kcal/g in Bayelsa samples as shown in Table 2A. There is significant difference between the group (p<0.05) while the significant difference in energy values is as shown in Table 2B (Osun and Oyo (0.02443), Bayelsa and Oyo (0.01622), Rivers and Oyo (0.02358). There is no significant difference among other States. Thus, all samples show that, there are good food values except the moisture content that need to be improved.
The summary of results obtained for the physicochemical parameters studied are as stated in Table 3.
Melting point
The results for melting points of the crude palm samples from the various states studied were in the range 33.11 to 34.03°C (Table 3). The highest was recorded in rivers state while the least was in Oyo State. The melting points of crude palm oils were in the order Rivers > Osun > Ondo > Bayelsa > Oyo. There was significant difference (p<0.05) between Rivers and Oyo State sample while there was no significant difference among other states. The values obtained for the melting points are within the regulatory limits of Standards Organization of Nigeria (SON, 2000). Therefore deemed fit for use as food and for industrial application. The results were comparable to results (41 to 48°C) obtained in a study conducted by Akinola et al. (2010) on the physicochemical parameters of palm oils in the South-Western part of Nigeria. The determination of melting point is crucial in the study of palm oils as it is used in identifying the level of purity of the crude palm oils.
Refractive index
The results obtained for refractive index of the crude palm oil samples from the five states ranged from 1.4650 in Osun to 1.4690 in Oyo as the minimum and maximum values (Table 3) while the refractive index was in the order Oyo > Ondo > Bayelsa > Rivers> Osun. There is no significant difference in refractive index among the states (p >0.05). The result obtained is lower than that of Standard Organization of Nigeria (SON, 2000) which ranges from 1.4720 to 1.4775. Akinola et al. (2010) reported 1.4491 to 1.4637 which is a little bit closer to the result obtained. Akinyeye et al. (2011) reported a value of 1.4600, which is very close to the result obtained. In addition, Enyoh et al. (2017) reported 1.4620 to 1.4640 and Echioda et al. (2018) reported (1.476 to 1.562). This is a physical constant frequently used in determination of the identity and the purity of fats and oils and many other food and pharmaceutical products. In many cases, it may be used to determine quantitatively the strength and purity of solution or the proportion at which liquids are mixed.
Density or specific gravity
Tables 3 shows the results obtained in crude palm oil samples for each State where the mean results of density or specific gravity ranged from 0.8980 g/ml in Oyo to 0.914 g/ml in Ondo and Rivers as the lowest and the highest values respectively. Using Tukey’s pairwise for significant comparison, the values that are in pink for relative density between states (Ondo and Oyo (0.0001412), Ondo and Osun (0.003519), Bayelsa and Oyo (0.0004202), Rivers and Oyo (0.0001403), and Rivers and Osun (0.00318) have showed significant difference (p <0.05) while there was no significant difference among other states. The density/ specific gravity was in the order Ondo and Rivers > Bayelsa > Osun > Oyo. The results obtained were very close to what Enyoh et al. (2017) reported 0.870 to 0.910 g/mL and Akinola et al. (2010) reported 0.904 to 0.918 g/ml density for palm oil from different palm oil local factories in Nigeria.
The viscosity
The results obtained for viscosity of the crude palm samples from the various states studied were in the range from 24.689 to 63.83 mPa.s (Table 3). Also, Tukey’s pairwise for viscosity shows that Bayelsa and Oyo (0.009391) Bayelsa and Osun (0.0412), Rivers and Oyo (0.0001346), Rivers and Osun (0.0001432), Rivers and Ondo (0.001925) had significant difference (p<0.05) while there is no significant difference among other states. The viscosity of crude palm oils was in the order Rivers > Bayelsa > Ondo > Osun > Oyo. which may be due to reduction in temperature as the viscosity determination proceeded and this was in agreement with the report of Nzikou et al. (2010) which stated that the higher the temperature the lower the viscosity and possibly also because of the water that was absorbed by the gums (phospholipids) during extraction of the crude palm oil, hence the resistance or share stress in the crude palm oil sample increased from Oyo to Rivers State. Viscosity is a measure of resistance of a fluid to deform under shear stress. It is commonly perceived as thickness, or resistance to pouring. Viscosity also describes as fluid's internal resistance to flow and may be thought of as a measure of fluid friction.
pH
The results for the pH as presented in Table 3 ranged from 3.93 to 4.32 with crude palm oil sample from Oyo State having the concentrated pH which might be due to some un-ripened fruits and little hydrolysis, while crude palm oil sample from River State had the least concentrated pH due to hydrolysis. Thus, the acid value and free fatty acid from Rivers State are higher than that from Oyo State. The order of pH (OY = 3.93 > OS = 3.99 > ON= 4.10 > BY = 4.81 > RV = 4.32). This could be due to the downward leaching of nutrients in the soil by the consistent rainfall experienced in South-South areas than the South-West; because at this pH it is expected that the soil has maximum availability of all the essential plant nutrients (Enyon et al., 2017). The pH plays a vital role in the quality of vegetable oil. At higher pH like 1.0 to 2.0 the fruits are not yet detached properly but from pH 3.0 to 6.0 the fruits had ripened, ready to lose from the bunch while the acid value in the fruits indicate readiness to free the bunch.
Saponification value
The results for saponification values from this study are as presented in Tables 3 for the crude palm oil samples from the five States ranged from 199.22 mg KOH/g in Osun to 203.55 mg KOH/g in Oyo as the lowest and highest value. The saponification value were in the order Oyo > Ondo > Rivers > Bayelsa > Osun. There was no significant difference among the States at 95% confidence limit p (>0.05). The mean values obtained for each States are; OY (203.55 mg KOH/g), OS (199.22 mg KOH/g), ON (203.24 mg KOH/g), BY (199.62 mg KOH/g), and RV (202.56 mg KOH/g) and are within the recommended range of 195 to 205 mg KOH/g for palm oil (NIS, 1992; SON, 2000). These values are close to 197.07 and 222.90 mg KOH/g reported by Enyoh et al. (2017) and Akinyeye et al., (2011) but higher than the 140.00 mg KOH/g reported by Birnin-Yauri and Garba (2011). Consequently, the higher the saponification values the better the crude palm oils suited for soap production (Agbaire, 2012). Saponification value (SV) is an indication of the molecular weights of triglycerides of oils. High saponification value indicates high proportion of low fatty acids since saponification value is inversely proportional to the average molecular weight or length of fatty acids (binti Mohamad et al., 2011).Therefore, the shorter the average chain length (C4-C12), the higher the saponification value.
Acid value and free fatty acid
The results of acid value and free fatty acid were presented in Tables 3 for each state. The acid value results ranged from 1.526 to 2.190 mg KOH/g with palm oil from Oyo having the lowest value and palm oil from Ondo had the highest value among the State samples. There was significant difference (p<0.05) between States such as Ondo and Oyo (0.000609), Rivers and Ondo (0.001708) while there was no significant difference among other states. The acid value were in the order Ondo> Osun > Bayelsa > Rivers >Oyo. Since the free fatty acid is half the value of the acid values, hence, the results of free fatty acid ranged from 0.779 to 1.090 mg KOH/g in Oyo and Ondo. The result of ANOVA show significant different (p<0.05) are in pink for free fatty acid value (Ondo and Oyo (0.001505), Rivers and Ondo (0.00234) have significant difference while there is no significant difference among other states). The free fatty acid value were in the order Ondo> Osun > Bayelsa > Rivers > Oyo were ranged from the results for the five states. The obtained results were in agreement with Akinola et al. (2010) who reported 0.55 to 2.62 mg KOH/g acid value but these acid values are lower than the 28.30 and 20.00 mg KOH/g reported by Enyoh et al. (2017) and Birnin-Yauri and Garba (2011). Echioda et al. (2018) also reported a low acid value (0.86 to 0.90) from palm oil samples collected from different market in Kano State. Standard Organization of Nigeria’s (SON’s) recommended a maximum value of 3.5 mg KOH/g for acid value and 1.75 mg KOH/g for FFA (SON, 2000). The obtained results show that the level of oxidation of the palm fruits at the time of processing was low. The amount of free fatty acid in palm oil is an indicator of the quality of the palm oil, and high level of free fatty acid is an indication of lipid oxidation (Alyas et al., 2006). The measure of the free fatty acids in oil is the half of acid value. Fatty acids are usually in the triglyceride form but during processing, they tend to get hydrolyzed into free fatty acids. Therefore, there is a direct relationship between acid value and the free fatty acid content of fats and oil. These mean that higher acid value will cause higher free fatty acid and thereby decreasing the quality of the oil and fats. AOCS (1990) stated 0.6 mg KOH/g as the maximum accepted level for vegetable oil.
Ester value
The ester value results obtained were presented in Tables 2 for each state. The ester value results ranged from 197.75 to 201.99 mg KOH/g with palm oil from Bayelsa having the lowest value and palm oil from Oyo having the highest value among the state samples. The ANOVA of mean ester value and comparison shows that there is no significant difference (p>0.05) in ester value among the states. The average value for each state is: Oyo (201.99 mg KOH/g), Osun (197.98 mg KOH/g), Ondo (201.11 mg KOH/g), Bayelsa (197.75 mg KOH/g), and Rivers (200.95) with order OY>ON >RV>BY >OS. These values obtained are higher than 160.86 and 172.86 mg KOH/g and average value, 168.773 mg KOH/g reported by Enyoh et al. (2017) and closely aligned with result obtained (193.679 to 203.975 mg KOH/g) and average value (196.07 mg KOH/g) at room temperature by Akinola et al. (2010). While Echioda et al. (2018) reported a lower values (186.63 to 191.20) mg KOH/g.
Iodine value
The results obtained for Iodine value of the crude palm oil samples from the five states ranged from 45.57 Wij’s in Osun to 50.60 wij`s in Ondo as the lowest and highest value as shown in Table 2 while the Iodine value were in the order Ondo > Rivers > Oyo > Bayelsa > Osun. The ANOVA of Iodine value show that there is significant different (p<0.05) between Ondo and Oyo (0.01248) samples while there are no significant different among other states.
The values obtained from this work are higher than the 33.24 wij’s reported by Akinyeye et al. (2011) but very close to the value obtained (47.42-49.45) wij’s at room temperature reported by Akinola et al. (2010). Meanwhile, iodine values obtained in the present study were closed to the standard limits range of (45-53 Wij’s) recommended by SON (2000) respectively. These high values suggest that the oil has high level of unsaturation and might be susceptible to oxidation as most of the fruit’s bunches were on ground in the mills for some times before being processed. All the sites visited are adopting the same method of processing and these might result in closed range of the obtained results.
Peroxide value
Peroxide value for the crude palm oil samples from the different local oil mills in the five states results obtained are presented in Tables 2, for each state. The results for the peroxide value ranged from 3.16 and 5.45 mEq/Kg with Oyo sample having the lowest peroxide value and rivers sample had the highest value. The peroxide value has significant different (p<0.05) between Ondo and Oyo (0.0001375), Ondo and Osun (0.003163), Bayelsa and Oyo (0.0001336), Bayelsa and Osun (0.0002328), Rivers and Osun (0.000186) while there is no significantly comparison among other States). The peroxide value were in order RV>BY> ON>OS> OY. The results were in agreement with report of Akinola et al. (2010) who reported 4.00 to 6.26 mEq/Kg at room temperature for palm oil and Echioda et al. (2018) also reported 5.0 to 6.93 mEq/Kg for peroxide value for fresh palm oil. Agbaire (2012) also reported a much lower peroxide value. Meanwhile, Enyoh et al. (2017) reported a higher peroxide value (17.75 mEq/Kg), while 10 mEq/Kg was the standard specified by SON (2000) for peroxide value of oil. The peroxide value is an indicator of the level of lipid peroxidation or oxidative degradation. Hence, it is a useful indicator of the early stages of rancidity occurring under mild conditions and a measure of primary lipid oxidation products. This suggests a high level of unsaturation and susceptibility to oxidative rancidity. The addition of antioxidant may be a good way to prolong the stability of the oil (Enyoh et al., 2017).
In summary, proximate and physicochemical properties of crude palm oil are essential to be carried out in order to ascertain the qualitative and quantitative properties of locally produced crude palm oils. This also helps to determine the levels of conformity of local palm oil producers with regulated standard limits. Therefore, there is need for improvement by local palm oil producers to have a minimum standard operating procedure (SOP) to be strictly adhered to in order to meet international standard.
Table 4 show the obtained results for this present study compared to the standard recommendation of physicochemical parameters for crude palm oil by some regulatory bodies from both national and international organization thus, meeting these standards could be an added advantage for Nigeria crude palm oil marketing for ease of exportation and this will boost our economy.

CONCLUSION
This study reveals that crude palm oil produced at different local palm oil mills in South-West and South-South, Nigeria, based on the proximate constituents of crude palm oil samples analyzed, were within recommended limits except the moisture content. The higher moisture content could be attributed to the processing methods for the crude palm oils. This can lead to rancidity and short shelf life of the crude palm oils produced in the south-west and south-south regions of Nigeria. However, all the crude palm oil samples showed good proximate and physicochemical composition since they are within the recommended standard limits, it could be concluded that crude palm oil from Southern Nigeria is good for food and industrial applications.
CONFLICT OF INTERESTS
The authors declare that there is no conflict of interest.
ACKNOWLEDGMENTS
The authors are grateful to the Management of Niger Delta University for providing an enabling environment.
REFERENCES
|
Adetuyi OO, Aladekoyi G, Akinbobola AP, Adedokun BC (2014). Comparative Study of Proximate Composition of Oil Extracted from African Catfish Viscera (Clarias gariepinus) and Red Palm Oil. Journal of Fisheries and Aquatic Science 9(5):372-376. |
|
|
Agbaire PO (2012). Quality assessment of palm oil sold in some major markets in Delta State, southern Nigeria. African Journal of Food Sciences and Technology 3(9):223-226. (ISSN: 2141-5455) |
|
|
Akinola FF, Oguntibeju OO, Adisa AW, Owojuyigbe OS (2010). Physico-chemical properties of palm oil from different palm local factories in Nigeria. Journal Food Agriculture Environment 8(3-4):264-269. |
|
|
Akinyeye RO, Adeyeye EI, Fasakina O, Agboolaa A (2011). Physicochemical properties and anti-nutritional factors of palm fruit products (Elaeis Guineensis Jacq.) from Ekiti State Nigeria. Electronic Journal of Environmental, Agricultural and Food Chemistry 10(5):2190-2198. SSN: 1579-4377. |
|
|
Association of Official Analytical Chemists (AOAC) (2005). Official method of Analyses Association of official Analytical chemist 17th edition Washington D.C. USA. 2000. ISBN 0-935584-77-3 |
|
|
American Oil Chemists' Society (AOCS) (1990). Official Methods and Recommended Practices of the American Oil Chemists Society. 4th Edition. American Oil Chemists Society, Champaign, California, USA. |
|
|
Aremu MO, Ibrahim H, Bamidele TO (2015). Physicochemical characteristics of the oils extracted from some Nigerian plant foods-a review. Chemical and Process Engineering Research, 32, 36-52. |
|
|
Aribido SO, Ogunmodede BK, Lakpini CAM (2001). Nutritional assessment of Palm oils consumed in Abia State Nigeria. Journal of chemistry Research 6:27-30 |
|
|
Alyas SA, Abdulah A, Idris NA (2006). Changes of betacarotene content during heating of red palm olein. Journal of Oil Palm Research (Special Issue) pp. 99-102. |
|
|
Bahadi MA, Japir AW, Salih N, Salimon J (2016). Free fatty acids separation from Malaysian high free fatty acid crude palm oil using molecular distillation. Malaysian Journal Analytical Science 20(5):1042-1051. |
|
|
Binti Mohamad F, bin Mat Tahar R, binti Awang N (2011). Evaluating capacity of palm oil mill using simulation towards effective supply chain-A case study. InInternational Conference on Management (ICM 2011) Proceeding 2011. Conference Master Resources. |
|
|
Birnin-yauri UA, Garba S (2011). Comparative Studies on Some Physicochemical Properties of Baobab, Vegetable, Peanut and Palm Oils. Nigerian Journal of Basic and Applied Science 19(1):64-67. |
|
|
Echioda S, Salisu S, Bilyaminu YU, Danlandi IY, Sule HR (2018). Comparative Studies on the Quality of Palm Oil Samples Collected from Different Markets (Galadima, Sabon Gari and Singa) of Kano State, Nigeria West Africa. International Journal of Chemistry and Chemical Processes 4(2):1-8. ISSN2545-5265. |
|
|
Enemuor SC, Adige AA, Okechukwu VC (2021). Heavy metals and microbial contamination of palm oil produced and sold at some markets in Kogi East Area, Kogi State, Nigeria. African Journal of Microbiology Research 15(8):454-460, August, 2021. |
|
|
Enyoh EC, Enyoh CE, Amaobi CE (2017). Quality Assessment of Palm Oil from Different Palm Oil Local Factories in Imo State, Nigeria. World Scientific News 88(2):52-167. WSN 88(2) (2017) 152-167. EISSN 2392-2192. |
|
|
Food and Agriculture Organization (FAO) (2015). Corporate document repository, small scale palm oil processing in Africa written by Agriculture and consumer protection. |
|
|
Food and Agriculture Organization/ World Health Organization (FAO/WHO) (1984). Contaminants. In Codex Alimentarius, Vol. XVII, Edition1. FAO/WHO Codex Alimentarius Commission, Rome; 1984. |
|
|
Frazier WC, Westhoff DC (1978). Food Microbiology. 2nd edition. McGraw-Hill Company Ltd., New York, USA.Isaac BA, Adejumo OI (2010). Physicochemical properties of Roselle seed oil. Nutrition Food Science 40:186-192 |
|
|
Japir AAW, Salimon J, Derawi D, Bahadi M, Al-Shuja'a S, Yusop MR (2017). Physicochemical characteristics of high free fatty acid crude palm oil. Oilseeds & fats Crops and Lipids (OCL) 24(5):D506. |
|
|
Kowalska M, Wo'zniak M, Zbikowska A, Koz?owska M (2020). Physicochemical Characterization and Evaluation of Emulsions Containing Chemically Modified Fats and Different Hydrocolloids. Biomolecules 10(1):115. |
|
|
Mensink RP, Zock PL, Kester AD, Katan MB (2003). Effects of dietary fatty acids and carbohydrates on the ratio of serum total to HDL cholesterol and on serum lipids and apolipoproteins: a meta-analysis of 60 controlled trials. The American journal of clinical nutrition, 77(5):1146-55. |
|
|
National Agency for Food and Drug Administration and Control (NAFDAC) (2019). Fats and Oils regulations 2019. |
|
|
Nigerian Industrial Standards (NIS) (1992). Standard for edible vegetable oil, 5-12. |
|
|
Njoku PC, Egbukole MO, Enenebeaku CK (2010). Physio-chemical characteristics and dietary metal levels of oil from Elaeis guineensis species. Pakistan Journal of Nutrition 9(2):137-140. |
|
|
Olagbemide PT, Philip CN (2014). Proximate analysis and chemical composition of raw and defatted Moringa oleifera kernel. Advances in Life Science and Technology 24:92-99. |
|
|
Olaniyi AA, Ogungbamila FO (1998). Experimental Pharmaceutical chemistry. Published by SHANESON C.I Limited, 1A Adebo Ojo Street, Obokun, Akintola Avenue, Eleyele, G. P.O Box 16093, Ibadan Nigeria and printed by omoade printing press, Box 7309, Ibadan, Oyo State, Nigeria ISBN 978240036.OCLC Number: 81656861. |
|
|
Orji MU, Mbata TI (2008).Effect of extraction methods on the quality and spoilage of Nigerian palm oil. African Journal of Biochemistry Research 2(9):192-196. |
|
|
Onwuka GI (2005). Food analysis and Instrumentation, theory and practice, Lagos, Nigeria: Naphtali Print. |
|
|
Onyeike EN, Nwinuka NM, Enwere DI (2002). Proximate Composition, Energy Content and Physicochemical Properties of Nigerian Edible Fats and Oils Bioscience Research Communications 0795-8072/2002 14(2), April 30, 2002. |
|
|
Oshodi AA (1992). Proximate composition, nutritionally valuable mineral and functional properties of Adenopus breviflorus bean seed flour and protein concentration. Journal of food chemistry 45(2):79-83. |
|
|
Ouattara CAT, Somda MK, Moyen R, Traore AS (2015).Comparative physico-chemical and proximate analysis of oils of Shea nut, Sesamum indicum, Cucurbita pepo, Cucumis melo seeds commonly cultivated in West Africa. African Journal of Biotechnology 14(31):2449-2454, |
|
|
Oosterveer PJM (2020). Sustainability of Palm Oil and Its Acceptance in the European Union (EU). Journal of Oil Palm Research 32:365-376. |
|
|
Pirker J, Mosnier A, Kraxner F, Havlík P, Obersteiner M (2016). What Are the Limits to Oil Palm Expansion? Global Environmental Change 40:73-81. |
|
|
Prasanth KP, Gopala KA (2015). Physicochemical characteristics of commercial coconut oils produced in India. Grasas y Aceites 66(1):e062. |
|
|
Poku K (2002). Small-scale palm oil processing in Africa. FAO agricultural services bulletin, #148. Rome Italy: Food and Agriculture Organization of the United Nations. ISBN-13:978-9251048597 |
|
|
Raghu A (2017). We each consume 17 pound of palm oil a year. Bloomberg News retrieved 22nd May, 2017. |
|
|
Salimon J, Ahmed WA (2012). Physicochemical characteristics of tropical Jatropha curcas seed oil. Sains Malaysiana 41(3):313-317. Corpus ID: 73604527. |
|
|
Sampaio KA, Ayala JV, Van Hoed V, Monteiro S, Ceriani R, Verhé R, Meirelles AJ (2017). Impact of crude oil quality on the refining conditions and composition of nutraceuticals in refined palm oil. Journal of food science 82(8):1842-1850. |
|
|
Standard Organization of Nigeria (SON) (2000). Standards for edible refined palm oil and its processed form. pp. 2-5. |
|
|
Statista (2018). Palm oil Consumption in Nigeria 2017/2018. |
|
|
Raghu A (2017). We each consume 17 pound of palm oil a year. Bloomberg News retrieved 22nd May, 2017 |
|
|
Tan B (1989). Palm Carotenoids, tocopherols and tocotrienols. Journal American Oil Chemical Society 66(6):770-77. ISSN 1680-5194 |
|
|
Uning R, Latif MT, Othman M, Juneng L, Hanif NM, Nadzir MSM, Maulud KNA, Jaafar WSM, Said NFS, Ahamad F, Takri MS (2020). A review of Southeast Asian oil palm and its CO2 fluxes. Sustainability. |
|
|
United States Department of Agriculture (USDA) (2021). Oilseeds: World Markets and Trade. |
|
Copyright © 2024 Author(s) retain the copyright of this article.
This article is published under the terms of the Creative Commons Attribution License 4.0


