Full Length Research Paper
ABSTRACT
This study aimed to elucidate the effect of sampling location of Eucalyptus camaldulensis leaves on antioxidant activity, total phenolic content (TPC) and total flavonoid content (TFC). Leaves of E. camaldulensis collected at three different locations in Burkina Faso (north, central, south-west) were subjected to hydrodistillation to obtain a water extract and subsequent ethanol extraction of the solid residue. The extracts were analysed for antioxidant activity using 2,2-diphenyl-1-picryl-hydrazyl (DPPH) radical scavenging, TPC, TFC and high-performance thin layer chromatography (HPTLC) fingerprint. TPC were higher in water extracts and presented considerable variation from 129±9 to 266±4 milligram Gallic Acid Equivalent per gram of extract (mg GAE/g) with the highest value 266±4 mg GAE/g at the south-west site. This aqueous extract also showed high antioxidant activity with EC50 8.3 µg/mL. Furthermore, HPTLC fingerprint of the extracts showed both band intensity and size differences. For TFC, we found a slight differences within both water and ethanolic extracts with the highest value of 38.3 ±4.2 mg QE/g for the south-west ethanolic extract. The noticeable impact of climate on chemical variability of E. camaldulensis leaves needs to be taken into consideration for any further applications based on TPC biological activity of the extracts.
Key words: Eucalyptus camaldulensis, total phenolic content, total flavonoid content, antioxidant activity, sample location, chemical variation.
INTRODUCTION
Naturally occurring polyphenols have been paid increasing attention for their antioxidant activity and potential use in various applications, e.g. in the food, pharmaceutical and agricultural industry (Pandey and Rizvi, 2009; Augustyniak et al., 2010; Choi et al., 2012; Siangu et al., 2019). These secondary metabolites are found throughout the plant kingdom in various plant parts, with over 8000 polyphenolic compounds identified from multiple plant species (Pandey and Rizvi, 2009). One of the most studied groups of polyphenols is the flavonoid group. They protect plants against biotic and abiotic stress (Panche et al., 2016)and possess a large variety of biological properties exploited in foodstuff, pharmacy and agriculture industries (Kumar and Pandey, 2013). It has been reported that the geographical location of a plant caused variation in its chemical composition including flavonoid content (Haytowitz et al., 2013;Bouterfas et al., 2016; Dolkar et al., 2017; Ismail et al., 2017; Rimkiene et al., 2017). When a plant is chosen to study its biological activities in correlation with chemical composition, it is necessary to evaluate its chemical variability in composition or concentration of secondary metabolites basing on their location.
Eucalyptus camaldulensis is the main Eucalyptus species in Burkina Faso. Its stem is highly used in constructions, making its leaves a cheap and available raw material which can be valorised. The essential oil from the E. camaldulensis leaves is used in various applications, such as pharmacy, cosmetic and numerous food product formulations. It has also been suggested as a biopesticide (Batish et al., 2008). Hydrodistillation generates residual water and solid residue, which contain recoverable bioactive substances (Santana-Méridas et al., 2014). High polyphenol content, as well as antioxidant, antimicrobial, and antitumor activity, have been reported for various Eucalyptus extracts (Boulekbache-Makhlouf et al., 2013; Ashraf et al., 2015; González et al., 2017). Bioactive compounds are known to be influenced by various parameters: location, climate, soil, plant varieties, tree age, sampling season and extraction methods (Viljevac Vuletić et al., 2017; Chiasson et al., 2001). In the case of essential oil from E. camaldulensis, both location and harvest time affected the obtained yield and the chemical composition of the oil (Moudachirou et al., 1999). This study aimed to investigate the effect of geographical location on the chemical composition of water extracts from hydrodistillation, and ethanol extracts carried out on the residual solid fraction. To achieve this objective, the variability of the contents in phenolics, flavonoids and antioxidant properties was evaluated. Importantly, we focused on the standardization of antifungal biopesticide formulations based on E. camaldulensis leaves.
MATERIALS AND METHODS
Chemicals and reagents
The chemicals used were analytical grades, including 2,2-Diphenyl-1-picrylhydrazyl (DPPH), 6-Hydroxy-2,5,7,8-tetramethylchromane-2-carboxylic acid (Trolox), gallic acid, quercetin dihydrate, Folin-Ciocalteau’s phenol reagent, aluminium chloride hexahydrate (AlCl3.6H2O), from Sigma-Aldrich. All chemicals were used directly without further purification.
Plant material
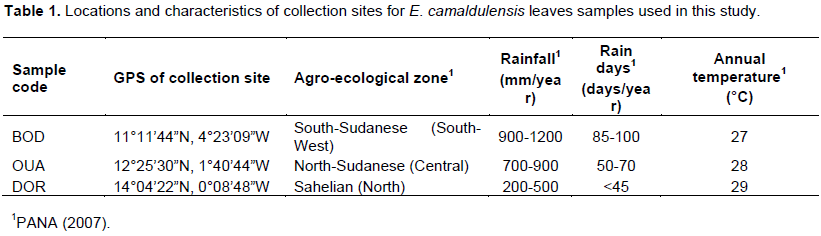
Plant material consisting of leaves from E. camaldulensis was collected from three different geographical locations of Burkina Faso, namely, the South-Sudanese zone (Sudanese climate) with the collection site near the town of Bobo-Dioulasso (BOB), the North-Sudanese zone (Sudano-Sahelian climate) with the collection site near the city of Ouagadougou (OUA) and the Sahelian zone (Sahelian climate) with the collection site near the town of Dori (DOR). Table 1 contains pieces of information about annual rainfall, number of rain days and average temperatures in Burkina Faso. The collection was carried out within ten days at the end of March to the beginning of April 2018. This period corresponds to the dry season in Burkina Faso. At each sampling point, leaves from a minimum of three trees were collected, weighed and mixed in equal proportions. The study included only trees with a stem circumference of 20 to 50 cm (measured 1 m of the ground). GPS coordinates were logged using a GARMIN e-trex 30 GPS (satellite). The collected leaves were washed with distilled water, dried in the shade at room temperature for ten days, ground into a fine powder and stored in a closed container at room temperature until further processing.
Dr Zerbo Issouf made the identification of plant specimen and voucher specimens (N-ID17046, 6876) were kept at the Laboratory of Plant Biology and Ecology, University Joseph KI-ZERBO, Ouagadougou, Burkina Faso.
Moisture content
The moisture content of the leaves powder was measured as follows: 1.0 g of each powder was dried in an oven at 105°C for 3 h, left to cool in a desiccator before weighing. Samples were prepared and analysed in triplicates.
Total ash content
The ash content was determined as follows: 5.0 g of each powder was calcinated in an oven at 550°C for 10 h, then left to cool for 10 h in the oven, followed by a 20 min drying step in a desiccator before weighing. The samples were prepared and analysed in duplicates. The ash content on dry basis was calculated in percentage (%) from the mass after calcination (m) and the moisture content (MC) according to:
Ash (%) = (m / 5.0 × (1 - MC)) × 100
Extraction procedure
The hydrodistillation started with 100 g of plant powder in 1 L of distilled water (dH2O) for 1 h using a Clevenger apparatus. The essential oil was collected but not analyzed further. The remaining crude was filtered using a fabric tissue to recover an aqueous solution and a solid residue. The aqueous volume extract was logged before being subjected to a second filtration using cotton. A sample of the final filtrate was frozen at -20°C overnight and dried through lyophilisation (LABCONCO FreeZone 2.5 Plus).
The remaining solid residue was dried at room temperature for 24 h and then subjected to ethanol extraction. The solid residue was mixed with 1 L of 70% ethanol, and the mixture continuously stirred for 24 h at room temperature before a two-step filtration, first using a fabric tissue and then filter paper. The ethanol was removed under vacuum and the sample re-dissolved in dH2O, frozen at -20ËšC and dried through lyophilisation.
Flavonoids fingerprinting by high-performance thin layer chromatography (HPTLC)
The extracts were analysed by HPTLC using an automatic TLC sampling system (LAMAG). 0.1 mg of each extract was loaded onto a silica plate (Sigma Aldrich) and run in a mobile phase consisting of n-butanol-acetic acid-water (65:15:10). The plate was left to dry at room temperature, observed under UV-light at 254 nm, before the flavonoid specific NEU reagent (2-aminoethyl-diphenylborinate, 1% w/v in MeOH) was sprayed onto the plate followed by PEG-4000 (5% v/v in EtOH). The plate was then photographed under UV light at 365 nm.
Total phenolic content evaluation (Folin-Ciocalteu method)
The total phenolic content (TPC) was determined using a modified version of the Folin-Ciocalteu method, adapted for microplate (Ainsworth and Gillespie, 2007). In short, 200 µL of Folin-Ciocalteu reagent (1:10 in dH2O) was added to 100 µL of plant extract (0.5 mg/mL in dH2O) and mixed thoroughly before the addition of 800 µL Na2CO3 (0.7 M in dH2O). Samples were transferred to a microplate, 200 µL/well in triplicates, and incubated for 2 h at 28°C. The absorbance of the mixture was determined at 765 nm using pure reagents without extract as blank and reported to a standard curve (y = 4.81x - 0.017; R2 = 0.997) made with gallic acid (0.2-0.025 mg/mL) used as standard compound. The TPC was expressed as milligram gallic acid equivalent per gram of extract (mg GAE/g). A multifunctional microplate reader (BMG Labtech SPECTRO star Nano) was used. All samples were prepared and analysed in triplicates.
Total flavonoid content (TFC) evaluation (AlCl3-method)
TFC was evaluated using the AlCl3-method (PÄ™kal and Pyrzynska, 2013)adjusted for microplate. In short 0.5 mL of AlCl3 (2% w/v in MeOH) was added to 0.5 mL of plant extract (1 mg/mL in MeOH), mixed and transferred to a 96 well microplate in triplicates, 200 µL/well. The microplate was incubated for 10 min at 28°C before reading the absorbance at 420 nm (BMG Labtech SPECTROstar Nano) using the sample in pure MeOH as blank. The absorbance was compared to a standard curve (y = 17.2x – 0.017; R2 = 0.997) prepared with quercetin (0.03-0.003 mg/mL) to give the TFC as milligram Quercetin Equivalent per gram of extract (mg QE/g). All samples were prepared and analysed in triplicates.
Antioxidant activity evaluation (DPPH-method)
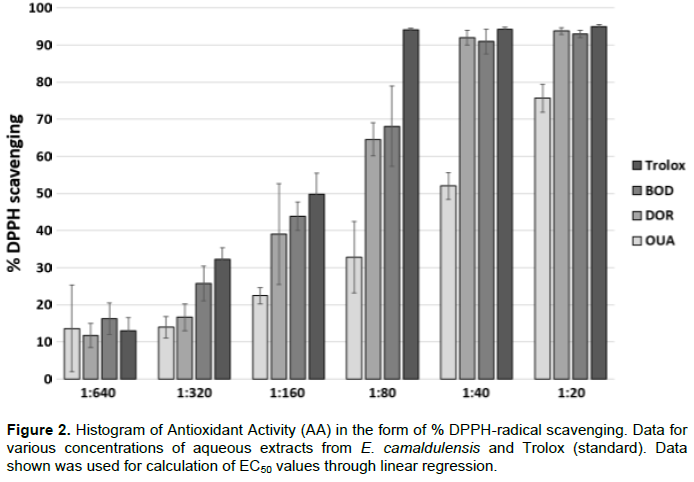
The Antioxidant Activity (AA) of the extracts was determined using the DPPH-method (Cheng et al., 2006)adjusted for microplate. The samples in triplicates were serial diluted in the microplate, final concentrations 0.1-0.0016 mg/mL for aqueous extracts and 0.25-0.0078 mg/mL for ethanol extracts. In each well, 100 µL of MeOH or 100 µL of freshly prepared DPPH (0.2 mM in MeOH) were added to 100 µL of the sample. The microplate was incubated at 28°C for 20 min before reading the absorbance at 515 nm. The percentage of inhibition was plotted against sample concentration, and the EC50-value in µg/mL was calculated using linear regression. Data points with inhibition >90% were excluded from the linear regression as it indicated saturation. The antioxidant activity of Trolox (6-hydroxy-2,5,7,8-tetramethylchroman-2-carboxylic acid) was analysed as standard. All samples were prepared and analysed in triplicates. The percentage of DPPH inhibition was calculated for each sample concentration using the following formula:

where Ax = absorbance measured for x.
Extract chemical stability
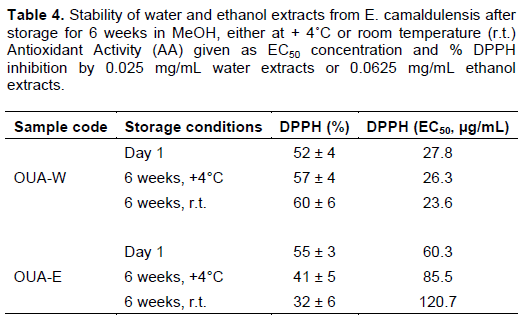
The chemical stability was performed for one collection point sample (OUA) using the antioxidant assessment. The water and ethanol extract solutions (1 mg/mL in MeOH) of this sample were stored at room temperature or +4°C for 6 weeks. The AA of the extracts in solution after storage was analysed and compared to the activity of freshly prepared samples.
RESULTS
Table 2 summarises the dried powders of E. camaldulensis leaves’ characteristics, including moisture content, total ash content and extraction yields.
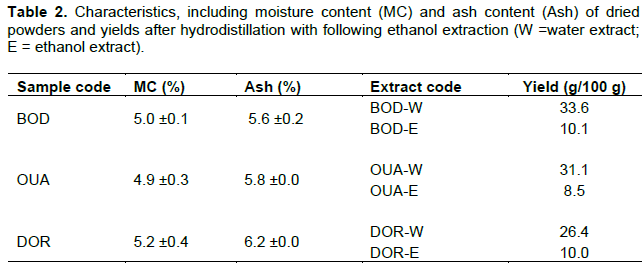
Only minor differences in moisture content and total ash content could be observed between the powders. The moisture content was approximately 5%, and the total ash content was about 6%, for all three powders.
After drying, the aqueous phase from hydrodistillation yielded approximately 30 g dry extract per 100 g (dry base) of plant powder processed. Water extracts BOD-W and OUA-W gave slightly higher yields than DOR-W (33.6 and 31.0 g versus 26.4 g). Subsequent ethanol extraction of the solid residue remaining after hydrodistillation yielded approximately 10 g dry extract per 100 g (dry base) plant material processed. This value was slightly lower for OUA-E (8.5 g versus 10.0 g and 10.1 g for DOR-E and BOB-E, respectively). The sum of water and ethanol extracts for each sample was approximately equivalent to 40 g of extract per 100 g (dry base) of plant powder processed. The DOR sample has the lowest value, with 36.4 g and BOD present the highest value with 43.7 g.
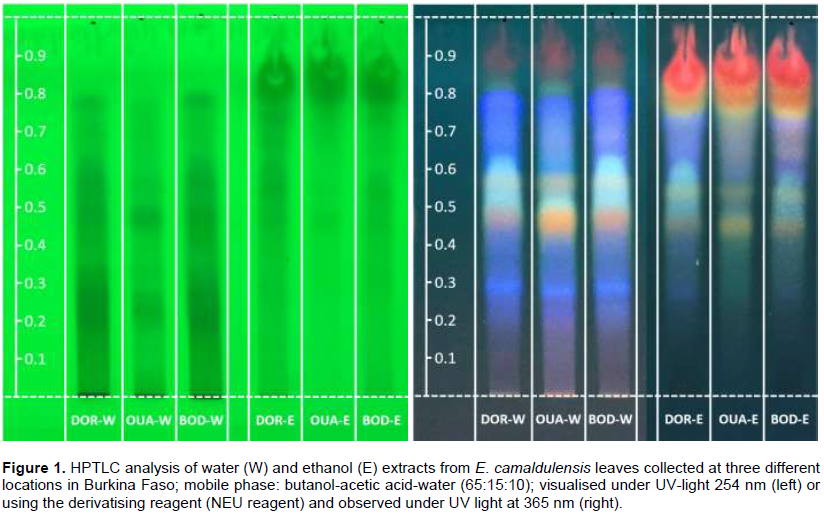
Figure 1 illustrates the extracts’ HPTLC fingerprints, before the derivatisation under UV-light at 254 nm and after derivatisation with NEU reagent under UV-light at 365 nm. The chromatogram of each extract contained several bands with a pink-yellow fluorescence. These bands indicated the presence of flavonoids in the extracts (Kinghorn, 1997). Some differences appeared between the extracts from the different collection sites. A notable difference was the orange band with a retention factor (Rf) at around 0.45. In both the water and ethanol extracts, a green smear spot around Rf ≈ 0.6 was visible in the DOR and BOB extracts but less in the OUA extract. In general, the ethanol extracts showed a similar profile as the water extracts, but with lower intensity of bands. The most significant difference was the yellow-orange bands migrating with the eluent front (Rf ≈ 0.8). Table 3 summaries the TPC, TFC and AA values from the extracts.
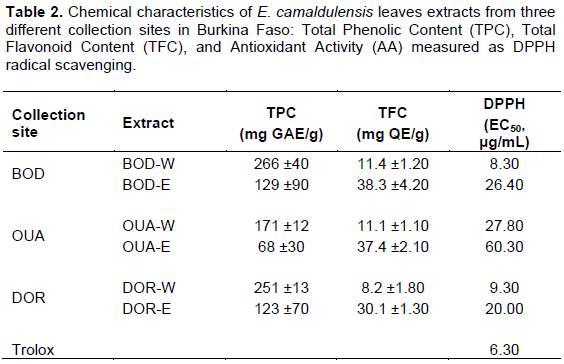
TPC was generally higher in the aqueous extracts than in the ethanol extracts. For the aqueous extracts, the obtained values according to collection locations were 171 ±12 mg GAE/g for OUA, 266 ±4 mg GAE/g for BOD and 251 ±13 mg GAE/g for DOR extract. The ethanol extracts were 68 ±3, 129 ±9 and 123 ±7 mg GAE/g, respectively for OUA, BOD and DOR extracts.
For TFC, the ethanol extracts generally showed a higher content compared to the aqueous extracts. When we compared the different collection points, the DOR extracts had lower amounts of flavonoids, 8.2 ±1.8 mg QE/g for DOR-W versus 11.1 ±1.1 and 11.4 ±1.2 mg QE/g for OUA-W and BOD-W, respectively. For the ethanol extracts, the obtained values were 30.1 ±1.3 mg QE/g for DOR-E versus 37.4 ±2.1 and 38.3 ±4.3 mg QE/g, respectively for OUA-E and BOD-E.
The highest AA was observed for BOD-W, followed by DOR-W extracts (Table 3 and Figure 2), with EC50-values of 8.3 and 9.3 µg/mL, respectively. These EC50 values were comparable to the standard antioxidant Trolox (EC50 6.3 µg/mL). The less active was OUA-W with EC50 27.8 µg/mL. The ethanol extracts were also less active. The DOR-E and BOD-E showed a higher AA than OUA-E, with EC50 20.0 and 26.4 µg/mL, respectively, compared to EC50 60.3 µg/mL for OUA-E. Noteworthy, a higher antioxidant ability corresponds to a lower EC50 value.
Correlation between TFC and TPC values with antioxidant properties
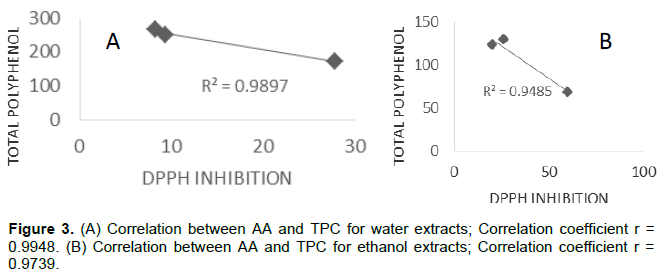
To correlate the results between AA with TPC and TFC for each type of extract (water and ethanol), a regression analysis was performed, and the correlation coefficient r was determined. Figure 3 (A and B) shows the results of DPPH inhibition and TPC correlations for water and ethanol extracts. Significant correlations were found between DPPH inhibition and TPC with an r 0.9948 for water extracts and 0.9739 for ethanol extracts. In contrast, the correlations of DPPH inhibition and TFC were weak, with an r 0.5336 for ethanol extracts and 0.3830 for water extracts.
Chemical stability study
The storage conditions and duration were considered for chemical stability study, and the AA was the parameter. The AA of the water extract did not decrease significantly after 6 weeks in the prepared solution stored at 4°C or room temperature (Table 4), suggesting adequate stability under the test conditions. However, the ethanol extracts’ EC50 values increased, suggesting a loss of activity. The loss was high for the extract stored at room temperature (approximately 25°C) compared to the one stored at 4°C. The EC50 values were 120.7 and 85.5 µg/mL, respectively, compared to 60.3 µg/mL for the first day (original sample).
DISCUSSION
The presence of water is generally favourable for the development of germs and also hydrolysis reactions in plant material. It is therefore essential to know its content in plant powders before further processing and conservation. The moisture content levels (4.9 - 5.2%) were less than 10% (Table 2), and according to the European Pharmacopoeia (Pharmacopée, 2007), these powders were storable over a long period without the growth of molds or yeasts. The ash content in plant materials is an indicator of the content of inorganic elements (minerals). The ash contents of the powders from the three geographical locations were similar (from 5.6 - 6.2%). This study therefore expected that the TPC, TFC and AA would be affected similarly by the minerals.
The total extraction yield of 40% was higher or similar to the one obtained for Eucalyptus species using various organic solvent-based extraction methods (3-46 %) (Elâ€Ghorab et al., 2003; Safaei-Ghomi et al., 2010; Singa et al., 2011; Boulekbache-Makhlouf et al., 2013). But the sample DOR, collected in a dry environment gave low quantities of extractives compounds. In contrast, the humid areas’ sample (BOD) gave higher amounts. The observed variation suggested a systematic effect to take into account for future use after the chemical analysis of the extract.
By HPTLC fingerprint, a high amount of active substances is effectively present in the aqueous phase after hydrodistillation and the ethanol extract. Some slight qualitative differences were observed in the six extracts. Still, the quantification of chemicals can confirm the chemical variation in TPC, TFC and AA of E. camaldulensis leaf extracts from the three different agro-ecological zones in Burkina Faso.
TPC was higher in the aqueous extracts than in the ethanol extracts, whereas for TFC, the ethanol extracts showed higher values compared to the aqueous ones. Two possible explanations for the observed reversal: (i) the extraction method used and (ii) the higher solubility of flavonoids in ethanol. First, the water extraction happened at high temperature, and most of the phenolic compounds soluble in water will be extracted, including phenolic acids, tannins, glycosides, etc. The overall yield of extraction by the high-temperature method was higher compared to a cold extraction (Siddesha et al., 2011). Secondly, flavonoids are more soluble in alcohol than water. Thus, a higher fraction of flavonoids compounds would remain in the solid residue and recovered only by the aqueous ethanol used in this study. Aqueous ethanol is generally the best solvent for flavonoids extraction. For example, optimisation of solvent extraction showed that TFC increased when the ethanol concentration and temperature increases and the optimum concentration lies between 50 and 60% ethanol (Gullon et al., 2017; Echeverry et al., 2018). These ethanol concentrations are closed to 70% used in the present study.
The highest TPC, TFC and AA corresponded to the sample from the south-west (BOD), which also presented a high extraction yields. The obtained values for TPC and TFC were respectively 266 ±4 mg GAE/g for water extract and 38.3 ±4.3 mg QE/g for ethanol extract. Regarding the AA, the EC50-value was 8.3 µg/mL for the water extract, closed to the standard Trolox (6.3 µg/mL). These results stemmed from the fact that this region of Burkina Faso with a Sudanese like climate presented the lowest temperature (average temperature is 27°C) and the highest pluviometry, compared to the others sites, with rainfall of 900 to 1200 mm/year (Table 1).
E. camaldulensis growing at Sudanese areas were, therefore, more bioactive than those in dry areas with high water stress (Zohra et al., 2014). As mentioned earlier, the highest AA was found for BOD-W with EC50 value of 8.3 µg/mL, followed by DOR-W (EC50-value 9.3 µg/mL). The less active one was observed for OUA-E (Central) with an EC50-value 60 µg/mL. The sample from the central part (OUA) also had the lowest TPC with 68 ±3 mg GAE/g for ethanol extract. But the lowest TFC was obtained in the North (DOR) part with 8.2 ±1.8 mg QE/g for water extract.
The AA of the extracts (EC50 = 8-60 µg/mL) was in line, with previous reports for other eucalyptus extracts using the same DPPH radical scavenging-assay, EC50 in the range of 17 to 480 µg/mL (Amakura et al., 2009; Safaei-Ghomi et al., 2010; Singa et al., 2011).
The AA correlated well with polyphenol content, both with water and ethanol extracts, with a correlation coefficient r 0.9948 for water extracts and 0.9739 for ethanol extracts (Figure 3A and B), suggesting that the AA of the extracts was due to polyphenols other than flavonoids (Dudonné et al., 2009). Previous studies showed that Eucalyptus globulus contains some phenolic acids (gallic acid and ellagic acid) which possess a high antioxidant ability. Other high molecular weight polyphenols were also identified but they did not contribute to the antioxidant activity (Amakura et al., 2002). Gallic acid and ellagic acid were the prevailing antioxidants in the ethanol extract from E. camaldulensis collected in Egypt (Elâ€Ghorab et al., 2003).
As the TFC was similar in extracts from different sites, it appeared that phenolic acids in water extracts explained the considerable variation in TPC in the water extracts of samples from the three sites. The TPC measurement was easy and in correlation with AA. It was proposed that correlation as an indicator for the chemical diversity of E. camaldulensis leaves.
Depending on the targeted biological activity for plant extract valorisation, one can choose the ethanol extract if flavonoids are in focus or the water extract if phenolic acids are the interesting ones as bioactive molecules. Generally, extracts rich in phenolic compounds have good AA. In this study, the collection took place for ten days in the middle of the peak dry season in Burkina Faso. Day time temperatures during this period can reach above 40°C, with no rainfall for weeks before collection. In the north, this temperature was the highest; so, the sample DOR possessed the highest total ash content when the moisture contents were similar. This means that the leaves from DOR possessed more minerals and a bit less organic material molecules to extract. Secondary metabolites of plants play an essential role to face biotic and abiotic stress as dust, high temperature, and disease (Imelouane et al., 2011).
CONCLUSION
Water and ethanol extracts from hydrodistillation process of E. camaldulensis leaves collected at three different sites in Burkina Faso showed differents TPC, TFC and AA. Among the sites, the South-Sudanese zone sample extract (south-west of Burkina Faso) showed superior antioxidant properties, TPC and TFC. It also exhibited higher extractives than the sample from the Sahelian area (North of Burkina Faso). The geographic variation was more evident in water-soluble compounds (water extracts) rich in phenolic acids than the ethanol extracts rich in flavonoids. A significant correlation between antioxidant properties and TPC indicated that phenolic compounds were the major contributors to the antioxidant properties of E. camaldulensis leaves extracts. Regarding the differences between the extracts, we concluded that the collection sites of samples affected the phytochemicals of the plant.
For any future application as an antifungal biopesticide in organic agriculture, the collection site needs to be included for the standardisation of the formulations. The management of the geographical differences are essential to any successful industrial or agricultural application.
CONFLICT OF INTERESTS
The authors have not declared any conflicts of interests.
ACKNOWLEDGMENTS
Authors appreciate the International Science Programme (ISP, SWEDEN), for their financial support to the research activities through the project BUF 01 in Burkina Faso. They also acknowledge the Minor Field Studies program from Swedish International Development Agency (SIDA) for the travel and stay of Ebba Rosendal at University Joseph KI-ZERBO in Burkina Faso.
REFERENCES
|
Ainsworth EA, Gillespie KM (2007). Estimation of total phenolic content and other oxidation substrates in plant tissues using Folin-Ciocalteu reagent. Nature Protocols 2(4):875-877. |
|
|
Amakura Y, Umino Y, Tsuji S, Ito H, Hatano T, Yoshida T, Tonogai Y (2002). Constituents and their antioxidative effects in eucalyptus leaf extract used as a natural food additive. Food Chemistry 77(1):47-56. |
|
|
Amakura Y, Yoshimura M, Sugimoto N, Yamazaki T, Yoshida T (2009). Marker constituents of the natural antioxidant Eucalyptus leaf extract for the evaluation of food additives. Bioscience, Biotechnology, Biochemistry 73(5):1060-1065. |
|
|
Ashraf A, Sarfraz RA, Mahmood A, Din M (2015). Chemical composition and in vitro antioxidant and antitumor activities of Eucalyptus camaldulensis Dehn leaves. Industrial Crops and Products 74:241-248. |
|
|
Augustyniak A, Bartosz G, Cipak A, Duburs G, Horakova L, Luczaj W, Majekova M, Odysseos AD, Rackova L, Skrzydlewska E, Stefek M, Strosova M, Tirzitis G, Venskutonis PR, Viskupicova J, Vraka PS, Zarkovic N (2010). Natural and synthetic antioxidants: An updated overview. Free Radical Research 44(10):1216-1262. |
|
|
Batish DR, Singh HP, Kohli RK, Kaur S (2008). Eucalyptus essential oil as a natural pesticide. Forest Ecology and Management 256(12):2166-2174. |
|
|
Boulekbache-Makhlouf L, Slimani S, Madani K (2013). Total phenolic content, antioxidant and antibacterial activities of fruits of Eucalyptus globulus cultivated in Algeria. Industrial Crops and Products 41:85-89. |
|
|
Bouterfas K, Mehdadi Z, Elaoufi MM, Latreche A, Benchiha W (2016). Antioxidant activity and total phenolic and flavonoids content variations of leaves extracts of white Horehound (Marrubium vulgare Linné) from three geographical origins. Annales Pharmaceutiques Françaises 74(6):453-462. |
|
|
Cheng Z, Moore J, Yu L (2006). High-Throughput Relative DPPH Radical Scavenging Capacity Assay. Journal of Agricultural and Food Chemistry 54(20):7429-7436. |
|
|
Chiasson H, Bélanger A, Bostanian N, Vincent C, Poliquin A (2001). Acaricidal properties of Artemisia absinthium and Tanacetum vulgare (Asteraceae) essential oils obtained by three methods of extraction. Journal of Economic Entomology 94(1):167-171. |
|
|
Choi DY, Lee YJ, Hong JT, Lee HJ (2012). Antioxidant properties of natural polyphenols and their therapeutic potentials for Alzheimer's disease. Brain Research Bulletin 87(2-3):144-153. |
|
|
Dolkar P, Dolkar D, Angmo S, Kumar B, Stobdan T (2017). Variability in phenolics, flavonoids and antioxidants in Seabuckthorn (Hippophae rhamnoides L.) seed from nine trans-Himalayan natural population. Journal of Berry Research 7(2):109-116. |
|
|
Dudonné S, Vitrac X, Coutière P, Woillez M, Mérillon JM (2009). Comparative Study of Antioxidant Properties and Total Phenolic Content of 30 Plant Extracts of Industrial Interest Using DPPH, ABTS, FRAP, SOD, and ORAC Assays. Journal of Agricultural and Food Chemistry (57):1768-1774. |
|
|
Echeverry SM, Medina HI, Costa GM, Aragón DM (2018). Optimization of flavonoid extraction from Passiflora quadrangularis leaves with sedative activity and evaluation of its stability under stress conditions. Revista Brasileira de Farmacognosia 28(5):610-617. |
|
|
Elâ€Ghorab AH, El-Massry KF, Marx F, Fadel HM (2003). Antioxidant activity of Egyptian Eucalyptus camaldulensis var. brevirostris leaf extracts. Food/Nahrung 47(1):41-45. |
|
|
González N, Elissetche J, Pereira M, Fernández K (2017). Extraction of polyphenols from Eucalyptus nitens and Eucalyptus globulus: Experimental kinetics, modeling and evaluation of their antioxidant and antifungical activities. Industrial Crops and Products 109:737-745. |
|
|
Haytowitz DB, Bhagwat S, Holden JM (2013). Sources of Variability in the Flavonoid Content of Foods. Procedia Food Science 2:46-51. |
|
|
Imelouane B, Tahri M, Elbastrioui M, Aouinti F, Elbachiri A (2011). Mineral Contents of Some Medicinal and Aromatic Plants Growing in Eastern Morocco. Journal of Materials and Environmental Science 2(2):104-111. |
|
|
Ismail NZ, Arsad H, Samian R, Hamdan MR (2017). Determination of Phenolic and Flavonoid Contents, Antioxidant Activities and GC-MS Analysis of Clinacanthus nutans (Acanthaceae) in Different Locations. Agrivita. Journal of Agricultural Science 39(3):335-344. |
|
|
Kinghorn AD (1997). Plant Drug Analysis. A Thin Layer Chromatography Atlas. Second Edition By H. Wagner and S. Bladt (Universität München). Photographs by V. Rickl. Springer-Verlag, Brooklyn, New York. 1996. xv+ 384 pp. 19.5 × 24 cm. $198.00. ISBN 3-540-58676-8. Journal of Natural Products 60(4):428-428. |
|
|
Kumar S, Pandey AK (2013). Chemistry and Biological Activities of Flavonoids: An Overview. The Scientific World Journal (2013):1-16. |
|
|
Moudachirou M, Gbénou JD, Chalchat JC, Chabard JL, Lartigue C (1999). Chemical Composition of Essential Oils of Eucalyptus from Bénin: Eucalyptus citriodora and E. camaldulensis. Influence of Location, Harvest Time, Storage of Plants and Time of Steam Distillation. Journal of Essential Oil Research 11(1):109-118. |
|
|
PANA (2007) Programme d'action national d'adaptation à la variabilité et aux changements climatiques, rapport final. Ministère de l'Environnement et du Cadre de Vie, Secrétariat Permanent du Conseil National pour l'Environnement et le Développement Durable. Ouagadougou, Burkina Faso. |
|
|
Panche AN, Diwan AD, Chandra SR (2016). Flavonoids: An overview. Journal of Nutritional Science 5:1-15. |
|
|
Pandey KB, Rizvi SI (2009). Plant polyphenols as dietary antioxidants in human health and disease. Oxidative Medicine and Cellular Longevity 2(5):270-278. |
|
|
Pharmacopée E (2007). Guide pour l'élaboration des monographies de drogues végétales et préparations à base de drogues végétales. Direction Européenne de la Qualité du Médicament & Soins de Santé. Conseil de l'Europe, 67075 Strasbourg Cedex, France. |
|
|
Pękal A, Pyrzynska K (2013). Evaluation of Aluminium Complexation Reaction for Flavonoid Content Assay. Food Analytical Methods 7(9):1776-1782. |
|
|
Rimkiene L, Kubiliene A, Zevzikovas A, Kazlauskiene D, Jakstas V (2017). Variation in Flavonoid Composition and Radical-Scavenging Activity in Ginkgo biloba L. due to the Growth Location and Time of Harvest. Journal of Food Quality 2017(4):1-8. |
|
|
Safaei-Ghomi J, Ghadami M, Batooli H (2010). Bioactivity of methanol extracts of Eucalyptus Sargentii maiden cultivated in Iran. Digest Journal of Nanomaterials and Biostructures 5(4):859-863. |
|
|
Santana-Méridas O, Polissiou M, Izquierdo-Melero ME, Astraka K, Tarantilis PA, Herraiz-Penalver D, Sánchez-Vioque R (2014). Polyphenol composition, antioxidant and bioplaguicide activities of the solid residue from hydrodistillation of Rosmarinus officinalis L.. Industrial Crops and Products 59:125-134 |
|
|
Siangu BN, Sauda S, John MK, Njue WM (2019). Antioxidant activity, total phenolic and flavonoid content of selected Kenyan medicinal plants, sea algae and medicinal wild mushrooms. African Journal of Pure and Applied Chemistry 13(3):43-48. |
|
|
Siddesha JM, Angaswamy N, Vishwanath BS (2011). Phytochemical screening and evaluation of in vitro angiotensin-converting enzyme inhibitory activity of Artocarpus altilis leaf. Natural Product Research 25(20):1931-1940. |
|
|
Singa AN, Ayoub N, Al-Sayed E, Martiskainen O, Sinkkonen J, Pihlaja K (2011). Phenolic constituents of Eucalyptus camaldulensis Dehnh, with potential antioxidant and cytotoxic activities. Records of Natural Products 5(4):271-280. |
|
|
Viljevac Vuletić M, Dugalić K, Mihaljević I, Tomaš V, Vuković D, Zdunić Z, Puškar B, Jurković Z (2017). Season, location and cultivar influence on bioactive compounds of sour cherry fruits. Plant Soil Environment 63(9):389-395. |
|
|
Zohra B, Ali M, Moulay B (2014). The physiological and behavioural responses of argan seedlings (Argania spinosa (L.) Skeels) to water stress in the semi-arid Western Algeria. International Journal of Plant Physiology and Biochemistry 6(5):44-55. |
|
Copyright © 2024 Author(s) retain the copyright of this article.
This article is published under the terms of the Creative Commons Attribution License 4.0


