Full Length Research Paper
ABSTRACT
A colour indicator-based assay was developed and validated for the quantitative analysis of Lisinopril in tablet in aqueous medium. The proposed procedure involved a reaction between the acidic functional group (COOH) of Lisinopril drug and standardised aqueous sodium hydroxide. The method involved dissolution of powdered Lisinopril tablet in water followed by filtering; the obtained filtrate was titrated with aqueous sodium hydroxide, and the end point was determined using phenolphthalein as indicator. The method which was applicable over a concentration range of 0.2 to 1.12 mg/ml gave an inter-day percentage of relative standard deviation (%RSD) of 0.11 to 1.67, while that of intra-day was 0.27 to 1.72 across the different concentrations used for the determinations. Similarly, the percentage of relative error (%RE) were 0.38 to 2.58 and 0.38 to 2.60 for the inter-day and intra-day assays, respectively. This indicates good accuracy and precision for the method. Furthermore, water soluble excipients did not interfere with the end point determination. Slight modification of the method involving potentiometrically determining the end point using glass calomel electrode system gave similar results. The application of both methods; potentiometry and phenolphthalein indicator-based to the chemical content assay of nine different brands of Lisinopril tablets showed no statistically significant difference between the two methods.
Key words: Lisinopril, phenolphthalein-based assay, titrimetry, potentiometry.
INTRODUCTION
The prevalence of hypertension in Nigeria and Africa is put at 12.4 to 34.8% in the south western part of Nigeria as at 2009 (Ekwunife and Aguwa, 2011) with the prevalence increasing with age (Hall, 2006; Ulasi et al., 2011). It is also the most common cause of hospital admissions in Nigeria (Kolo et al., 2012; Ukoh, 2007; Ike, 2009). The chronic nature of hypertension requires that the therapeutic objective should be dependent on dosage regime and duration of therapy. Effective management of most chronic diseases like hypertension is strongly influenced by the assurance of the quality drugs used in such disease conditions.
Quality assurance of drugs depends on maintaining established quality standards based on standardized laboratory tests; physical, chemical, biopharmaceutical and biological procedures. This could be achieved for pharmaceutical products by concise determination of its chemical contents through classical (titrimetry, gravimetry, colourimetry, electrochemistry and polarography) and instrumental methods (spectrofluorometry, spectrophotometry, mass spectrometry and chromatography) (Olaniyi, 1993). An important step in the assessment of quality of drug product is the determination of chemical content of such products. A highly sensitive procedure for detecting variations between different batches of pharmaceutical products to ensure uniformity and consistency among drug batches is an essential component of quality control of drug products.
A major setback in the quality control of pharmaceutical products in developing countries is the unavailability of analytical equipments, unskilled personnel and inadequate infrastructures (Jegede, 1998). This has led to distribution of fake, substandard and poor quality drug products.
Lisinopril (2S)-1-[(2S)-6-Amino-2-[[(1S)-1-carboxy-3-phenylpropyl] amino] hexanoyl] pyrrolidine-2-carboxylic acid dihydrate (Figure 1) is a lysine analogue of enalaprilat, the active metabolite of enalapril, which exist as a dihydrate salt. It is a long-acting, dicarboxyl-containing angiotensin-converting enzyme (ACE) inhibitor (Widimsky, 2009).
Lisinopril dihydrate is an important member of the angiotensin converting enzyme inhibitors (ACEIs) class of drugs used as first line drug in the management of hypertension and congestive heart failure; they act by reducing peripheral vascular resistance and blood volume (Hall, 2006; El Gindy et al., 2001).
The official method for the chemical content determination of pure Lisinopril dihydrate involves the use of potentiometry and high performance liquid chromatography (HPLC) (British Pharmacopoeia, 2009; United States Pharmacopoiea, 2000). Furthermore, various analytical techniques have been reported for the tablet dosage form, these includes spectrophotometry (Asad, et al., 2005; El- Yazbi et al., 1999; El-Gindy et al., 2001; Stanisz, 2004; Dinc et al., 2013; Shinde et al., 2007; Ahmed Ali and Elbashir, 2012; Devi et al., 2003; Fawzy et al., 1999; ?akar and Popovi?, 2012), liquid chromatography (El-Gindy et al., 2001; Fawzy et al., 1999; United States Pharmacopoiea, 2000; Ali et al., 2004; Sagirli and Ersoy, 2004; Ivanovic et al., 2007; Japanese Pharmacopoeia, 1993), gas chromatography (Avadhanutu and Pantulu, 1993), spectrofluorometry (El Gindy et al., 2001; El- Yazbi et al., 1999; Jamakhandi et al., 2010; Esra et al., 2003; Constantinos et al., 2004), derivative spectrophotometry (Abdel-Razak et al., 2003), and polarography (Abdel-Razak et al., 2003; El-Enany et al., 2003), capillary electrophoresis and fluoroimmunoassay (Gotti et al., 2000; Yuan and Gilbert, 1996).
Most of these methods are sophisticated, costly, tedious, time consuming, and or require certain reagents, equipments as well as skilled personnel which may not be easily available in many developing countries where prevalence of hypertension is on the increase. This may result in inadequate control of the quality of the drug compound with the accompanying therapeutic failure, which may lead to patients developing complications that may be life threatening and even fatal.
Guidelines for global standardization and requirements for the registration, assessment, marketing, authorization and quality control of drug products have been issued by WHO Report (1996). However, many developing countries do not have the technical, financial, or human resources required to monitor the quality of drug products being distributed within their regions. Hence, the need for a simple, rapid, economical and selective method, that can easily be used for routine field assessment of the quality of Lisinopril.
This study was aimed at developing a simple, fast, sensitive and cost effective method for the determination of Lisinopril in raw and pharmaceutical formulations, which can compare favourably with official methods. The method was applied to the analysis of nine brands of Lisinopril tablets.
MATERIALS AND METHODS
Average weight determination
The average weight and percentage deviation of the Lisinopril dihydrate tablets (Zestril©) brand was determined according to the official method (British Pharmacopoeia, 2009).
Isolation of pure Lisinopril dihydrate (2° Standard) from tablets
Fourteen Lisinopril tablets were powdered, transferred into an extraction tube and extracted with methanol. The solution was decanted, filtered and dried under nitrogen gas; the dried residue was recrystallised using chloroform-methanol (1:1, v/v).
Pure Lisinopril powder obtained was dried under nitrogen gas. The identification of the recrystallised Lisinopril was determined using melting point (Stuart apparatus, England), thin layer chromatography (TLC) (Silica gel GF254 using butanol: ethylacetate: glacial acetic acid: water [5:5:5:5] as mobile phase), infrared (Buck, England), ultraviolet-visible spectrophotometry (Pye Unicam, Stoke, England) (British Pharmacopoeia, 2009) and high performance liquid chromatography (Agilent series 1100, Waldbronn, England) (Japanese Pharmacopoeia, 1993). Assay of the pure Lisinopril (2° Standard) was determined using potentiometry (British Pharmacopoeia, 2009) and HPLC (Japanese Pharmacopoeia, 1993).
Development of new titrimetric assay techniques
Colour indicator based technique using phenolphthalein indicator
Pure Lisinopril dihydrate (2° Standard): pure Lisinopril powder (25 mg) dissolved in distilled water (25 ml) was titrated with NaOH (0.01 M); the end point was determined using phenolphthalein solution (1%) as indicator with colour change from colourless to pink.
Lisinopril tablet in the presence of excipients: powdered Lisinopril tablet (Zestril©) (equivalent to 25 mg pure Lisinopril) was dissolved in 25 ml of distilled water with shaking. Few drops of phenolphthalein indicator were added and the mixture was titrated with NaOH (0.01 M), and the end point was determined by the change in colour from colourless to pink. Triplicate assay was carried out.
Lisinopril tablet in the absence of excipients: powdered Lisinopril tablet (Zestril©) (equivalent to 25 mg pure Lisinopril) was dissolved in 25 ml of distilled water with shaking. The mixture was filtered before titration with NaOH (0.01 M); the end point was determined using phenolphthalein indicator with colour change from colourless to pink. Triplicate assay was carried out.
Using methyl orange indicator
The above procedure for pure Lisinopril and powdered tablet was repeated using methyl orange indicator.
Potentiometry technique
Lisinopril dihydrate pure (2° standard): the pure procedure for pure Lisinopril was repeated but the end point was determined potentiometrically (British Pharmacopoeia, 2009). Triplicate assay was carried out.
Lisinopril tablet: Lisinopril tablets (in the presence and absence of excipients) was repeated, but the end point was determined potentiometrically (British Pharmacopoeia, 2009). Triplicate assay was carried out.
Validation of the selected method
Calibration curve: Lisinopril pure powder; 5, 12 and 28 mg were weighed and dissolved in 25 ml of distilled water, giving 0.2, 0.48 and 1.12 mg/ml solution, respectively. Few drops of phenolphthalein solution (1% w/v) used as indicator was added to each solution and titrated with 0.01 M NaOH. The end point was determined by the colour change from colourless to pink. Triplicate assay was carried out at the different concentration.
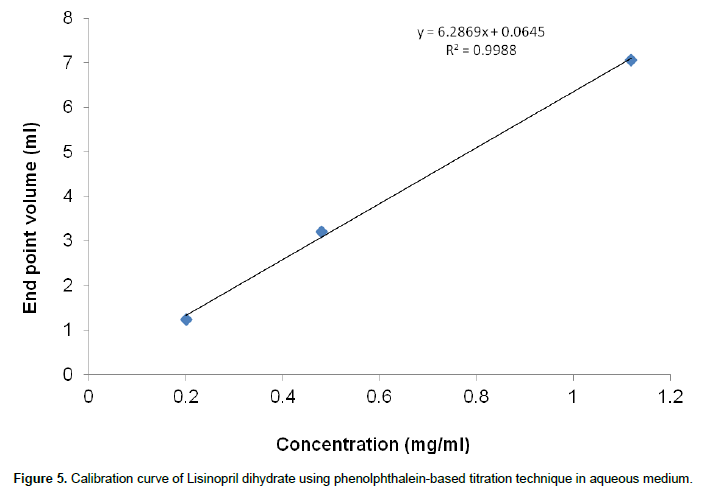
A calibration curve was generated using a graph of mean end point volume (MEPV) of the titrant (ml) against the corresponding concentration (mg/ml) of Lisinopril. The regression line equation and correlation coefficient was obtained from the curve. A three-day recovery study was done and the accuracy and precision were determined.
Application of the method to nine brands of Lisinopril tablets
Average weights of nine brands of Lisinopril tablets procured from retail pharmacies were determined. The presence of Lisinopril dihydrate was determined using TLC. The amount of Lisinopril in each brand was determined using the calibration curve as following.
Colour based titrimetric technique: powdered Lisinopril tablet equivalent to 25 mg pure Lisinopril was dissolved in 25 ml of distilled water with shaking. The mixture was filtered before titration with NaOH (0.01 M); the end point was determined using phenolphthalein as indicator. Triplicate assay was carried out.
Potentiometry technique: powdered Lisinopril tablet equivalent to 25 mg pure Lisinopril was dissolved in 25 ml of distilled water with shaking. The mixture was filtered before titration with NaOH (0.01 M), and the end point was determined potentiometrically. Triplicate assay was carried out.
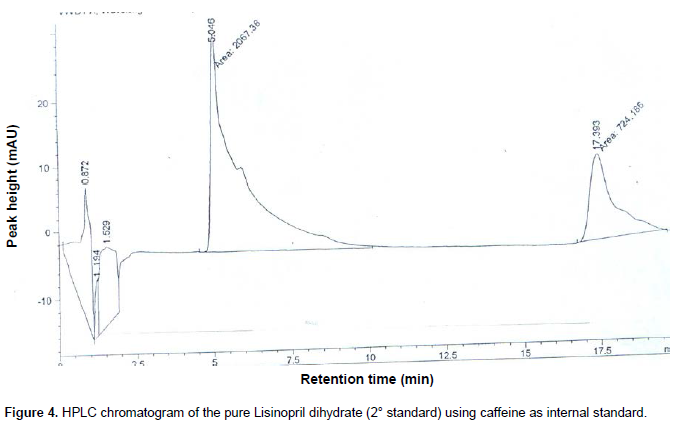
HPLC assay method: test solutions (equivalent pure Lisinopril, 0.2 mg/ml) and internal standard (caffeine, 0.05 mg/ml) were prepared in distilled water. Chromatographic analysis was performed as earlier described. The peak areas, peak heights and retention times were measured and the percentage content of the Lisinopril was calculated with reference to the internal standard (Japanese Pharmacopoeia, 1993).
Statistical analysis
Students’ t-test and one-way analysis of variance (ANOVA) was used for the statistical analysis, p < 0.05 was taken as the significant level.
RESULTS
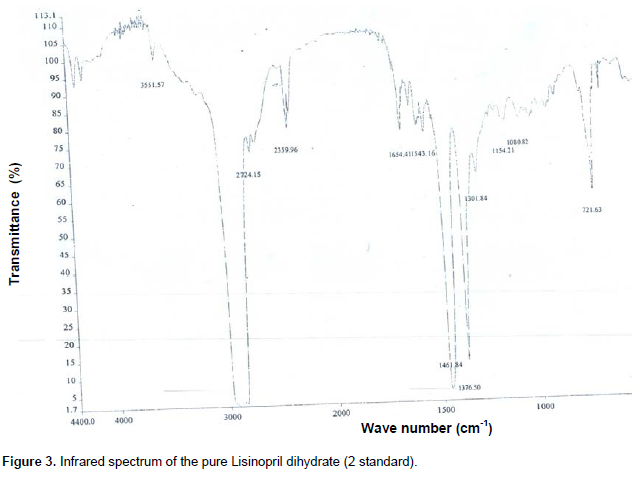
The extracted Lisinopril dihydrate (2° standard) gave a melting point of 160 to 162°C with λmax 209 nm (Figure 2), prominent infra red bands at 1376.50, 1461.84, and 2724.15 cm-1 using KBr disc (Figure 3) and a single peak with retention time of 5.05 min with HPLC analysis, while caffeine internal standard was 17.39 min (Figure 4). Lisinopril dihydrate content was 99.40±9.06 and 102.88% w/w using potentiometry and HPLC procedures, respectively. The obtained value with the potentiometry complied with official specification of 98.5 to 101.5% w/w (British Pharmacopoeia, 2009), while that of the HPLC was slightly higher.
.png)
The colour based reaction using methyl orange as indicator could not determine the end point as there was no change in colour in all the determinations of the pure Lisinopril and tablet dosage forms. However, defined change in colour from colourless to pink was observed with phenolphthalein indicator at the end point which corresponds with the end point volume obtained with the potentiometric technique. The colour based titrimetric techniques using phenolphthalein indicator gave Lisinopril content of 97.14 ± 1.83% w/w for the pure Lisinopril (2° standard).
Application of the procedures to tablet dosage form involving the use of one brand of Lisinopril tablet gave 110.10±1.74 and 95.27±1.85% w/w in the presence and absence of excipients, respectively using potentiometry, while the colour based titrimetry technique gave 115.22±9.06 and 99.35±9.02% w/w, respectively.
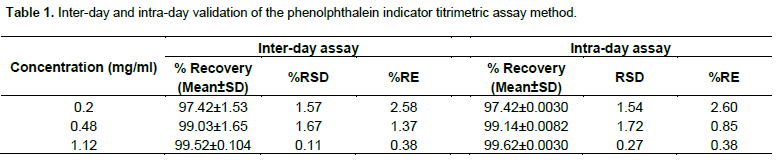
Validation of the proposed phenolphthalein based titrimetric procedure gave a calibration curve with linear response; y = 6.286x + 0.064 (r2 = 0.998) (Figure 5). The inter-day relative standard deviation (%RSD) was 0.11 to 1.67, while that of intra-day was 0.27 to 1.72 across 0.2 to 1.12 mg/ml used for the determinations. Similarly, the percentage of relative error (%RE) were 0.38 to 2.58 and 0.38 to 2.60 for the inter-day and intra-day assays, respectively (Table 1).
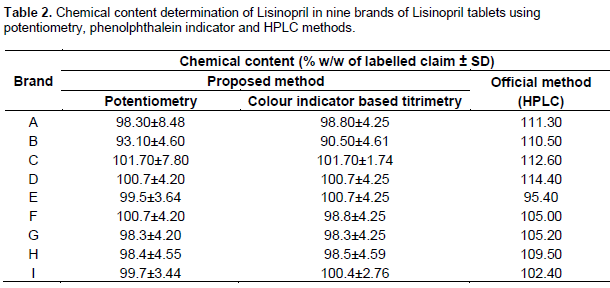
The result of the application of the proposed procedures: potentiometry and phenolphthalein indicator based titrimetry and HPLC to nine brands of Lisinopril tablets is presented as shown in Table 2. The obtained results showed that there was no significant difference between potentiometry and phenolphthalein indicator based procedures (p = 0.6028), while the obtained values HPLC method were significantly higher than the potentiometry and phenolphthalein indicator based procedures (p = 0.0051 and 0.0075, respectively).
DISCUSSION
The absence of reliable drug quality control systems in many developing countries is a major contributor to the prevalence of fake and sub-standard drug compounds, which has accounted for treatment failures especially with chronic diseases such as hypertension, diabetes, etc. Multi-sourcing of drug compounds have long been implicated in the rising cases of distribution of fake and
substandard drugs, especially in poor resourcedeconomies where access to appropriate quality control technologies are not available. Thus the need for simple, cost effective and reliable methods of assay for the quality control of drug compounds in developing countries cannot be over emphasised.
Lisinopril (an ACEI), is a first line drug in the management of hypertension and coronary heart diseases which is available in various brands as multi-sourced drug. The official methods and earlier reported methods involve the use of high technology equipments and procedures. Thus this study was carried out to proffer an alternative and equally reliable method assay for Lisinopril tablets.
Physicochemical analysis of the Lisinopril pure powder (2° standard) extracted from the tablet gave melting point
of 160 to 162°C, λmax of 209 nm and infrared bands which are characteristic of Lisinopril (Japanese Pharmacopoeia, 1993). The chemical content determination gave 99.40±9.06 and 102.88% w/w using the official potentiometric and HPLC methods, respectively. These results confirm the purity and suitability of the extracted Lisinopril as a secondary reference standard for this study.
Lisinopril, a common antihypertensive drug compound is an amphoteric compound, possessing both acidic and basic properties; it has two carboxylic acids in its structure which can ionise in basic medium. The reaction of these carboxyl groups with sodium hydroxide is the basis for the proposed assay technique, which is a slight modification of the official potentiometric method for pure Lisinopril dihydrate (British Pharmacopoeia, 2009):
![]()
The modification involved filtering the tablet solution and the use of colour indicator to determine the end point.
Titrimetric assay using colour indicator for the pure Lisinopril (2° standard) gave 97.14±1.83% w/w using phenolphthalein indicator with a colour change from colourless to pink, while the methyl orange did not show any colour change. This shows that methyl orange is not suitable for determination of the end point using this procedure.
Furthermore, the excipients were observed to interfere with the end point determination using the proposed potentiometry and colour indicator based methods, hence, the need to filter the solution before the assay. Thus, the procedure was repeated after filtration to remove the insoluble excipients.
Validation of the proposed methods showed consis-tency on a three-day assessment at the three different concentrations: 0.2, 0.48 and 1.12 mg/ml. A positive cor-relation of end point volume (ml) against concentration (mg/ml) obtained and coefficient of determination of 0.998 showed that the method is accurate and precise. The %RSD of 0.11 to 1.67 and 0.27 to 1.72 for inter-day and intra-day, respectively at 0.2 to 1.12 mg/ml range was used for the determinations. Similarly, %RE were 0.38 to 2.58 and 0.38 to 2.60 for the inter-day and intra-day assays, respectively. This showed that the methods gave good accuracy and precision.
Application of the proposed methods to nine other brands of Lisinopril tablets, whose content of Lisinopril had earlier been confirmed through TLC showed slight variations in the end point colour; five brands showed a colour change from colourless/white to pink, while one brand gave a colour change from peach to pink, and the remaining three showed variations in the colour changes. The change in colour though different was well defined in all the samples, could be attributed to differences in the formulations.
The chemical content ranged from 93.1±4.60 to 101.7±7.80% w/w for all the brands using the proposed potentiometric method, while the phenolphthalein indicator method gave 90.5 ± 4.61 to 101.7 ± 1.74% w/w. On the other hand, 95.4 to 114.4% w/w was obtained for the nine brands using an HPLC method (Japanese Pharmacopoeia, 1993) (Table 2). Statistical comparison of the proposed methods: phenolphthalein indicator based titrimetry and potentiometry, and HPLC, showed that there was no significant difference in the obtained results for potentiometry and colour indicator based titrimetry (p=0.6028), however, a significant difference was observed when compared with HPLC method (p<0.05).
The obtained results from this study are in agreement with another report on the use of titrimetric technique in the analysis of Lisinopril tablets using benzene: methanol (3:1) mixture as solvent (Basavaiah et al., 2010). However, the proposed method from this study is in aqueous medium which has a great advantage over the earlier titrimetric report because of the issue of solvent cost and safety with regards to benzene.
Titrimetric techniques involving the use potentiometry and colour indicator for the chemical content deter-mination of some drug compounds; salbutamol (Pungal, 2013), hydroxyzine hydrochloride (Rajendraprasad et al., 2013), pheniramine maleate (United States Pharmacopoiea, 2000, Raghu et al., 2012), in pure and dosage forms have been reported. These methods were reported to exhibit very good correlation with instrumental methods in terms of accuracy, robustness and precision. In all the methods as observed in the current proposed methods, soluble excipients did not interfere with the determinations.
Although, the Lisinopril content of all the brands to which the proposed procedures were applied were within the official specification for tablets: 92.5 to 105.5% w/w (British Pharmacopoeia, 2009), the values obtained with the HPLC method was quite higher than the two methods. Furthermore, a similar trend was obtained with the nine brands in the proposed methods; Brand B gave the lowest chemical content, while Brand C gave the highest value (Table 2). Comparing the chemical content values obtained with HPLC method for the tablets with that of the pure Lisinopril showed a similar trend; the value obtained for the pure Lisinopril (2° standard) was higher than the official specification (British Pharmacopoeia, 2009).
This is a definite indication that the two proposed methods can be used to determine the chemical content of Lisinopril tablets.
CONCLUSION
The two proposed methods: potentiometry and phenolphthalein indicator based titrimetry, are simple, fast, cost-effective requiring minimal instrumental/ technological input and thus can be adopted for use in a poor resourced economy where appropriate sophisticated equipments and other infrastructures are inadequate.
CONFLICT OF INTEREST
The authors declared no conflict of interest.
REFERENCES
|
Abdel Razak O, Belal F, Bedair M, Barakat S, Haggag S (2003). Spectrophotometric and polarographic determination of enalapril and Lisinopril using 2, 4-dinitrofluorobenzene. J. Pharm. Biomed. Anal. 31:701-711. crossref |
||||
| Asad R, Tariq A, Atta-ur-R (2005). Spectrophotometric determination of Lisinopril in Pure and Pharmaceutical Formulations. J. Chin. Chem. Soc. 52(5):1055-1059. | ||||
| Avadhanutu B, Pantulu R (1993). Gas liquid chromatographic estimation of lisinopril in its pharmaceutical dosage forms. Indian Drugs 30:646-649. | ||||
|
Basavaiah K, Tharpa K, Vinay KB (2010). Titrimetric assay of lisinopril in aqueous and non-aqueous media. Eclética Quím. 35(2):7-14. crossref |
||||
| British Pharmacopoeia (2009). British Pharmacopoeia, HM Stationary Office: London. pp. 1135-1138. | ||||
|
Čakar M, Popović G (2012). Determination of lisinopril in pharmaceuticals by a kinetic spectrophotometric method. J. Serb. Chem. Soc. 77(10):1437-1442. crossref |
||||
| Constantinos Z, Paraskevas T, Demtrius T, Georgios T, Anastasios E, Pantelis R (2004). Rapid spectrofluorimetric determination of lisinopril in pharmaceutical tablets using sequential injection analysis. Anal. Bioanal. Chem. 379:759-763. | ||||
| Devi PA, Mallikarjuna Rao GPV, Krishna Prasad KMM, Sastry CSP (2003). Four simple spectrophotometric determinations of lisinopril in pure state and in tablets. Indian J. Pharm. Sci. 65(3):296-99. | ||||
| Dinc S, Donmez OA, Asci Burge, Bozdogan A (2013). Spectrophotometric multicomponent resolution of a tablet formulation containing lisinopril and hydrochlorothiazide by multivariate calibration methods. Asian J. Chem. 25(2):999-1002. | ||||
|
El-Enany N, Belal F, Al-Ghannam S. (2003). Polarographic determination of lisinopril in pharmaceuticals and biological fluids through treatment with nitrous acid. Microchim. Acta 141:55-61. crossref |
||||
|
El-Gindy A, Ashour A, Abdel-Fattah L, Shabana MM (2001) Spectrophotometric, septrofluorimetric and LC determination of lisinopril. J. Pharm. Biomed. Anal. 25:913-922. crossref |
||||
|
El-Yazbi FA, Abdine HH, Shaalan RA (1999). Spectrophotometric and spectrofluorometric methods for the assay of lisinopril in single and multicomponent pharmaceutical dosage forms. J. Pharm. Biomed. Anal. 19:819-827. crossref |
||||
|
Esra S, Aktas L, Lale E, Olcay S (2003). A new spectrofluorimetric method for the determination of lisinopril in tablets. IL Farmacol. 58:165-168. crossref |
||||
|
Gotti R, Andrisano V, Cavrini V, Bertucci C, Furlanetto S (2000). Analysis of ACE-inhibitors by CE using alkylsulfonic additives. J. Pharm. Biomed. Anal. 22:423-31. crossref |
||||
| Hall J, Guyton E, Arthur C (2006). The textbook of medical physiology. St. Louis, Mo., Elseivier Saunders. P 228. | ||||
|
Ike SO (2009). "Prevalence of hypertension and its complications among medical admissions at the University of Nigeria teaching hospital, Enugu (Study 2)." Niger. J. Med. 18(1):68-72. Pubmed |
||||
| Ivanovic D, Medenica M, Jancic B, Knezevic N, Malenovic A, Milic J (2007). Validation of an analytical procedure for simultaneous determination of hydrochlorothiazide, lisinopril, and their impurities. Acta Chromatogr. 18:143-156. | ||||
| Jamakhandi CM, Javali C, Kumar S, Kumar DS. (2010). New fluorimetry method of determination for lisinopril dosage forms. Int. J. Pharm. Sci. Drug Res. 2(3):182–187. | ||||
| Japanese Pharmacopoeia (1993). 15th Edition. Pharmaceuticals and Medical Devices Agency Chiyoda-ku, Tokyo 100-0013 Japan. | ||||
| Jegede EC (1998). Drug regulation and control in developing countries. Buffalo Groove II, Interpharm Press Inc. pp. 35-37. | ||||
|
Kolo PM, Jibrin YB, Sanya EO, Alkali M, Peter Kio IB, Moronkola RK (2012). Hypertension-related admissions and outcome in a tertiary hospital in Northeast Nigeria. Int. J. Hypertens. pp. 1-6. crossref |
||||
| Olaniyi AA (1993). Towards better quality assurance of drugs and foods. Proceedings of a National Workshop, 1993. Department of Pharmaceutical Chemistry, University of Ibadan. pp. 67-72. | ||||
| Pungal A (2013). Simple titrimetric method for the estimation of salbutamol sulphate (SBS) in pharmaceutical formulations. Res. J. Pharm. Sci. 2(1):11-14. | ||||
| Raghu MS, Basavaiah K, Prashanth KN, Vinay KB (2012). Acid-base titrimetric assay of pheniramine maleate in pharmaceuticals in hydro-alcoholic medium. Der. Pharmacia. Lett. 4(5):1523-1529. | ||||
| Rajendraprasad N, Basavaiah K, Vinay KB (2013). Acid-base titrimetric assay of hydroxyzine dihydrochloride in pharmaceutical samples. Chem. Ind. Chem. Eng. Q. 16(2):127-132. | ||||
| Sagirli O, Ersoy L (2004). An HPLC method for the determination of lisinopril in human plasma and urine with fluorescence detection. J. Chromatogr. 809(1):159-165. | ||||
|
Shinde V, Trivedi A, Upadhayay PR, Gupta NL, Kanase DG, Chikate R (2007). Identification of a new impurity in lisinopril. J. Pharm. Biomed. Anal. 43(1):381-86. crossref |
||||
| Stanisz B (2004). Estimation of the applicability of differential spectroscopic method for the determination of lisinopril in tablets and for the evaluation of its stability. Acta Pol. Pharm. Drug Res. 61(5):327–334. | ||||
|
Ukoh VA (2007). Admission of hypertensive patients at the University of Benin teaching hospital, Nigeria. East Afr. Med. J. 84(7):329–335. Pubmed |
||||
| United States Pharmacopoiea-USP-24, NF-19 (2000). Asian Edition, United States Pharmacopoeial Convention, Inc. Twin Brook Parkway, Rockville, MD, U.S.A. | ||||
| Widimsky J (2009). The combination of an ace inhibitor and a calcium channel blocker is an optimal combination for the treatment of hypertension. Soc. Hypertens. J. 55(2):123-130. | ||||
| WHO (1996). World Health Organization Expert Committee on specifications for Pharmaceutical Preparations, 34th Report. WHO Technical Report Series, No. 863. Geneva, Switzerland. | ||||
|
Yuan AS, Gilbert JD (1996). Time-resolved fluoroimmunoassay for the determination of lisinopril and enalaprilat in human serum. J. Pharm. Biomed. Anal. 14:773-81. crossref |
||||
Copyright © 2024 Author(s) retain the copyright of this article.
This article is published under the terms of the Creative Commons Attribution License 4.0


