This research provided quantitative data for the quality of randomly selected ibuprofen tablets that are sold in both formal and informal market in Harare, Zimbabwe. Fourteen batches of ibuprofen tablets comprising of sixty tablets per batch were randomly selected from retail pharmacies and informal traders over a period of six months. Quality control tests which included physical appearance, uniformity of mass, disintegration test, friability, in vitro dissolution test, spectrophotometric and High Performance Liquid Chromatography (HPLC) profiling of the samples were carried out. Three out of the fourteen batches failed the uniformity of mass test. Those that failed were from the informal market. One out of these also failed the quantitative chemical assay and dissolution test. Four other ibuprofen batches were according to labelling from the same manufacturer but had differences in the packaging used therefore raising suspicion of the possibility of counterfeiting. Two more ibuprofen samples were from the same manufacturer but the appearance of these samples differed in shape size and colour and therefore failed the appearance test. The other batches passed all the tests done. All the samples tested contained the stated active pharmaceutical ingredient (API), ibuprofen. However, the other three samples were reported as substandard as they failed to meet the WHO set standards for either uniformity of weight, chemical assay test or dissolution test.
Ibuprofen is an over-the-counter antipyretic, analgesic and non-steroidal anti-inflammatory drug that is widely used for the relief of pain and inflammation caused by headache, toothache, back pains, menstrual pains, minor injuries and arthritis. The ability of ibuprofen to treat a wide case of mild to serious pain makes it a popular medicine. With many new medicinal products released into the market regularly, it is increasingly difficult to keep track of the safety of every product and this failure to keep track of medicinal products has led to an influx of counterfeit or substandard products (Yankus, 2006). Fake drugs have capacity to deceive, particularly if they are copied to make it look like the original product so that purchasers are unlikely to be suspicious (Nsimba, 2008). Analytical methods and anti-counterfeit technologies have therefore been developed to determine if products in the market are of good quality and reduce the risk substandard products may pose to consumers (Arzamastev et al., 2004; Deisingh, 2005; Bansal et al., 2013; Shah et al., 2010). Reports suggest that in a number of developing countries, there is a high incidence of the availability of substandard drugs mainly due to poor monitoring programs (Morris and Stevens, 2006; WHO, 2006; Kelesidis et al., 2007).
According to WHO (2006), poorly manufactured pharmaceutical products may be classified as either substandard or counterfeit. In the same report, the WHO describes substandard products as those that contain the active pharmaceutical ingredient (API) but do not conform to the quality requirements for that product such as incorrect quantities of the API or fails other physical tests such as the weight variation test, friability, hardness, disintegration test, thickness and diameter test. The WHO standards further describe a counterfeit drug as one that is deliberately and fraudulently mislabeled with respect to identity and or source.
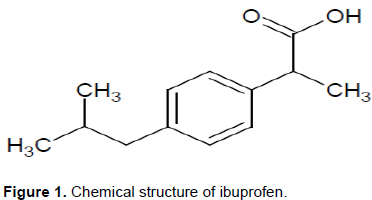
In this study, the quality of ibuprofen tablets found in the formal and informal market in the city of Harare, Zimbabwe was reported. The chemical structure of ibuprofen is shown in Figure 1.
Sampling
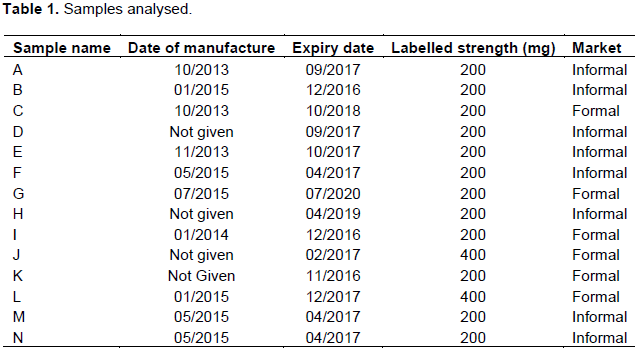
Fourteen batches of ibuprofen tablets comprising of sixty tablets per batch were sampled over a period of six months in Harare, Zimbabwe’s largest city. The sampled tablets from the formal and informal market originated from Kenya, India, Cyprus and China. Table 1 summarises the samples obtained.
Chemicals and chemical reagents
Chemicals used for various experiments were of analytical reagent grade unless otherwise stated. Ibuprofen reference standard was obtained from United States Pharmacopoeia (Rockville, USA), Lot Numbers KOJ009. Potassium dihydrogen orthophosphate and sodium hydroxide were purchased from Surechem Products Ltd., RSA and orthophosphoric acid from Minema Ltd., RSA. HPLC grade methanol was purchased from Merck (Pvt) Ltd. Water for HPLC analysis was Millipore purified.
Equipment
A Shimadzu LC-20AD HPLC equipped with a SPD-2AD UV/Vis detector was used for HPLC profiling and quantitative determination of API. A Distek apparatus (USA) was used for dissolution tests and a Shimadzu UV1800 UV/Vis spectrophotometer was used for quantitative determination of API dissolved in the media. For the friability test, an Erweka friabilator (Germany) was used.
Sample characterization methods
Test for uniformity of mass
The method for uniformity of mass determination was adapted from Okunlola et al. (2009). Exactly 20 tablets were weighed individually and relative standard deviations were used to determine the variation in mass.
Friability test
The friability test method was adapted from Ngwaluka et al. (2009). Exactly 20 pills were weighed initially and then placed in a friabilator for 4 min. The final mass was then determined. The friability of the tablets was calculated using equation 1:
Where F % is the percentage friability, w1 is the initial weight and w2 is the final weight. The friability value of tablets should be less than 1.0%.
Disintegration test
Disintegration test method was adapted from Dewan et al. (2013). Exactly six pills were individually suspended in 800 mL of water, equilibrated to and maintained at 37 ± 0.5°C. The disintegrator operated for 30 min. The time taken for each tablet or capsule to completely disintegrate was recorded.
API determination
An HPLC method adapted from Sunaric et al. (2013) Eraga et al. 2015 was used for the determination of API in the ibuprofen samples. Exactly 20 pills were weighed and ground into a fine powder. A quantity of the powdered tablets containing 200 mg of ibuprofen was weighed into a 100 mL volumetric flask, shaken with about 30 mL of the mobile phase and sonicated for 30 min. The mixture was allowed to cool to room temperature and made up to volume with the mobile phase. This mixture was then centrifuged for 5 min at 2500 rpm. The supernatant liquid was used as the sample solution. The chromatographic conditions were as follows: Mobile phase (methanol: water: orthophosphoric acid (750:247:3), C18 5 µm Luna column: 4.6 mm x 15 cm, flow rate: 1.0 mL/min, injection volume: 10 µL, detection: 264 nm. The percentage released API was calculated using Equation 2.

Where, Au is the mean area response of the sample and As is the mean area response of the standard, Cstd is the concentration of standard in µg/mL.
Dissolution test
The dissolution test method was adapted from Kulkarni et al. (2011) and Giri et al, (2013). Exactly 6 tablets per batch were suspended in 900 mL of phosphate buffer solution of pH 7.2 that had been brought to an equilibrium temperature of 37 ± 0.5°C. The dissolution process was monitored over a 90 min period. Aliquots of 10 mL were withdrawn at intervals of 5, 10, 15, 20, 30, 45, 60 and 90 min and filtered through a 0.45 µm filter. 1 mL of the filtrate was pipetted into a 20 mL volumetric flask and made up to volume with the dissolution media. The concentration of API was determined using a UV/Vis spectrophotometer set at 220 nm. The percentage API released was calculated using Equation 3.
Where, Au is the mean area response of the sample and As is the mean area response of the standard, Cstd is the concentration of standard in µg/mL.
Uniformity of mass
The results for uniformity of mass for selected batches from the informal market are illustrated in Figure 2. From the figure, it can be observed that three batches failed the uniformity of mass test as stated in the British Pharmacopeia (2015). The batches consisted of two from the same manufacturer and were all from the informal market.
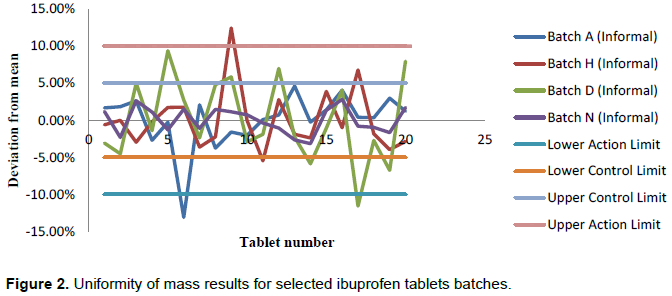
It can also be observed that seven out of twenty tablets of batch D failed the first condition of not more than ± 5% whilst one of the tablets had a deviation more than ±10%. Three tablets of the tested batch H had variation of more than ±5% whilst one had more than ±10 %. Avbunudiogba et al. (2013) suggested that variations in the uniformity of mass within the same batch is a strong indication of poor manufacturing practises that may lead to different dosages on different occasions if the mass of the API differ from tablet to tablet. Batches D and H were from the same manufacturer.
Karmakar and Kibria (2012) described further that high variation in weight may be an indication of corresponding variation in the drug content. Accordingly, higher percentage variations in tablet weight may mean the active pharmaceutical ingredient will differ from one tablet to the next which may be detrimental to a patient who may end up being under dosed and overdosed on different occasions. However, it is also possible that since these ibuprofen tablets are film coated, poor manufacturing practices during the coating process may lead to high inconsistency in the amount of coating applied per tablet. This may lead to large variations in the weight but not necessarily affecting the amount of API available per tablet but probably affect the rate at which the API is released. Eleven out of the tested fourteen batches passed the uniformity of weight test.
Friability
Teklu et al. (2014) reported that friability tests may indicate the resistance of the tablets to external pressure from manufacturing, storage, handling during shipment and transportation. All batches tested had % friability of less than 0.1%. The results show that all samples passed the friability test set by the WHO (2014). This may be attributed to the film coating that protects the tablet against abrasion.
Disintegration time results
The British Pharmacopoeia (2015) sets limits for disintegration of coated tablets as 30 min. All fourteen batches passed the disintegration test although some samples from certain batches had relatively high disintegration times ranging from 15 min 26 s to 22 min 56 s (Figure 3). Notably, samples from batches A, D, E, H, I and J had disintegration times ranging from 15 min 26 s to 22 min 56 s. Samples from batches A, D, E and H were from the informal market while those from batches I and J were from the formal market.
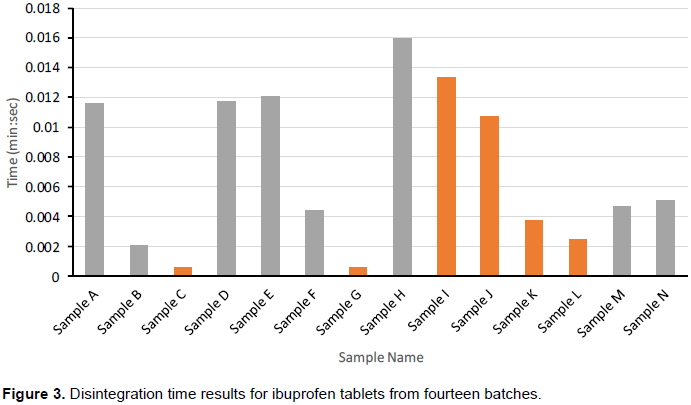
According to a report by Cardot et al. (2007), disintegration is the break down process of tablet into smaller particles and is the first step towards dissolution. It can be suggested that the longer the disintegration time, the longer the time taken before the API is absorbed by the body. It may therefore be assumed that the longer the disintegration time, the longer the time taken before the API is dissolved and absorbed by the body (Esimone et al., 2008; Niharika et al. 2013).
It was observed that batches A and E were from the same manufacturer, batches D and H from another manufacturer and so were batches I and J. From these observations, it could be concluded that the relatively high disintegration times observed could be related to the different manufacturing processes. Excipients such as binders and type of coating used play a major role in the rate at which a tablet breaks down into smaller particles and the way the API is released. If the binders have affinity for the API then more time is required before the API is released for absorption.
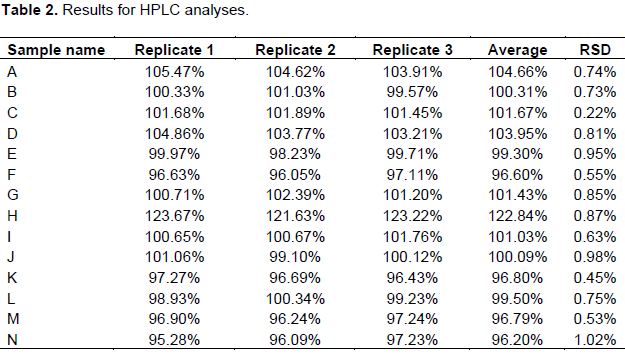
HPLC analytical results for API
The results for HPLC analysis are shown in Table 2. It can be concluded that batches except ibuprofen sample H met the standard requirements. Samples from batch H contained 122.84 ± 0.87% of ibuprofen. It can be suggested that there is a high possibility that any patient who uses this sample will be overdosed by more than 12% of the maximum allowed ibuprofen per tablet. This sample happened to be from the informal market.
Dissolution test results
Dissolution of an oral pharmaceutical product is important because it gives an indication of the percentage of the drug that is available for absorption after a specific time. It therefore follows that high dissolution rate means high bioavailability of the drug content. The results for dissolution profiles are illustrated in Figure 4. All batches except batch H passed the dissolution test as more than 85% of the API was released within the stipulated time of 60 min. Although, the average content of API released for sample H is 97.38%, the % RSD of 13.58 means some tablets within the sample had a % API dissolved of below (Q) = 85%. The results show that samples from batch H were substandard as they failed the dissolution test.
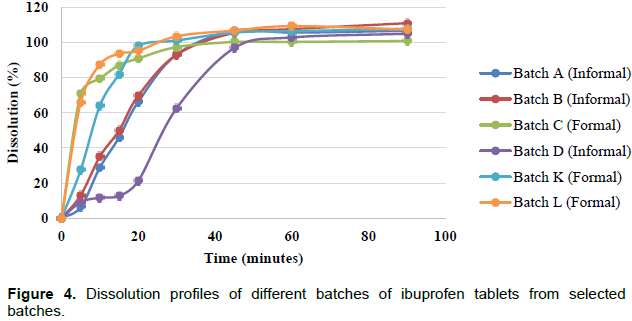
From the dissolution profiles in Figure 4, samples from batches C, I and L had the highest dissolution efficiencies at T15. These three products were obtained from retail pharmacies. Samples from batches A, B and D only had dissolution efficiencies comparable to those of samples from batches C, I and L after 30 min and these happened to be from the informal market.
The above results may show the risks of purchasing a pharmaceutical product from an informal market. Since most of the people who purchase these products use them for the relief of pain and inflammation, the longer it takes for the drug to be bioavailable, the higher the chances of an overdose. A different drug may be ingested to relieve pain when the other one is still in the system leading to improper drug interactions.
A pharmaceutical product of oral dosage form normally contains a drug substance known as the active pharmaceutical ingredient (API) and its excipients. The proportion between the excipients, the type of excipients (grade) and the manufacturing process may affect the bulk properties and absorption properties of the product. This gives each product a general dissolution pattern as illustrated in the Figure 4. Although, the same API- Ibuprofen was analysed, differences in the manufacturing process, type and proportions were used for different brands leading to different dissolution profiles with the efficiencies increasing in the order D<A<B<K<I<L<C at T5. It can also be observed from the results that samples of batches of the retail pharmacies generally had dissolution efficiencies consistent with regulatory requirements as compared to those in the informal market.
Batch to batch consistency
If a manufacturer is using a validated manufacturing process, results from one batch to the next are expected to be comparable such as those illustrated in Figure 5a and c showing results of samples from a retail pharmacy. More than 85% of the API had been released in 15 min for both batches. Similar profiles were also observed (Figure 5d) for the samples from batches D and H from the same manufacturer. Although, very low dissolution efficiencies were noted at T15, the dissolution profiles are similar in the rate at which the API is released.
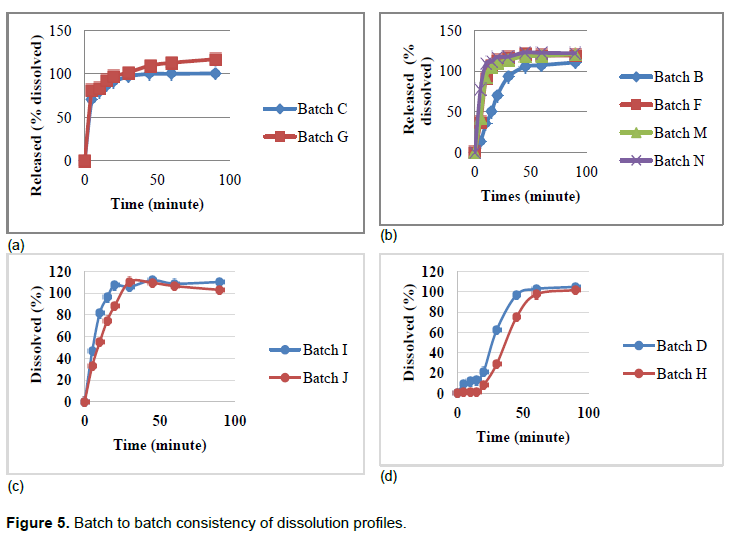
The same however cannot be said for samples from batches B, F, M and N as illustrated in Figure 5b. Four different batches from the same manufacturer were analysed. Three of these batches (F, M and N) were manufactured in the same month according to the labels, and gave similar results but these three results differed from the results of the batch (Sample B) that had been produced earlier (Table 1).
From Figure 4, it can be noted that samples from batch D had the lowest dissolution efficiency at T15. This strongly correlates with disintegration profiles in Figure 3 that shows batches D and H from the same manufacturer having relatively the highest disintegration time.
This was not the case with samples from batches B, F, M and N in Figure 5b. The results deviate from the strong correlation suggested by Esimone et al. (2008). Samples from batch B had the least disintegration time of the four batches but it did not release the API as efficiently as the other three batches. This may raise concern to a regulator when presented with these results as samples from batch B had a different packaging as compared to the other three batches. The two packaging used shows variation in the way the batch number and date of expiry were printed. Samples from batch B had the batch details embossed on the blister pack whereas details for samples from batches F, M and N were stamped.
Visual appearances
There was also a difference in the font used to label the brand name with ibuprofen sample B having small letters throughout, whereas the other three batches had capital letters at the beginning and at the end of the product name, for example one sample being branded as ‘sample-ab’, whereas the other three samples were labeled as ‘Sample-AB’. The dimensions of the blister packs used also differed with ibuprofen samples from batch B being 9.5 x 3.7 cm, while the other three batches had 8.8 x 3.7 cm. It is possible for a manufacturer to change packaging for the same product in the same year but it also has an effect of introducing room for counterfeiting as there are chances that it will look like the original. Differences of this nature gives room for counterfeits as a fake product may be marketed so this sample was suspected to be a counterfeit where the branding may be falsified.
Ibuprofen samples from batches D and H also differed in appearance although they were manufactured under the same brand name. Shape, size and colour of the tablets differed as samples from batch H were smaller in diameter and more intense in colour. This raises suspicion of counterfeiting as samples from batch H failed the assay and dissolution tests that followed. Both samples were different batches from the informal market.
All batches from both informal and formal market did not contain a leaflet or package insert to explain dosage, medicine content, adverse effects, medicine action and how the medicine should be taken. This observation has serious health effects as not all patients ask for this information before use of medication and there is no guarantee on how accurate the information may be disseminated from supplier to end user.
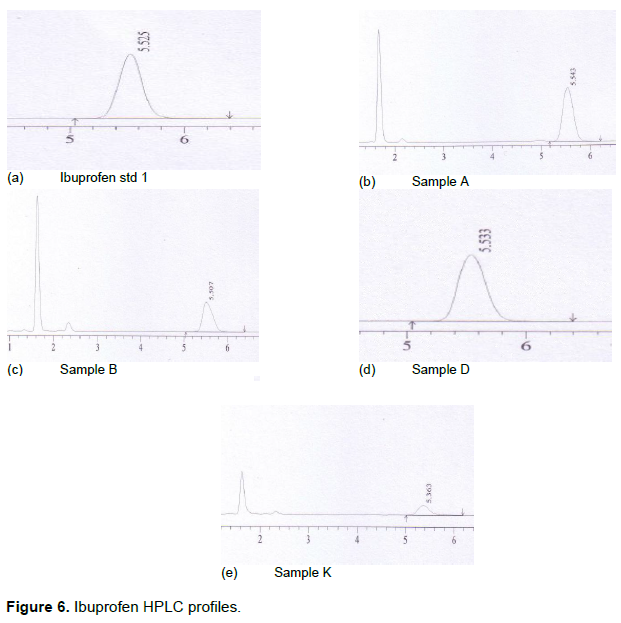
HPLC profiling
Figure 6a to e shows variation in the HPLC profiles. Only one peak appeared in the ibuprofen standard profiles (Figures 6a), whereas profiles for ibuprofen samples from batches A, B, E, F, K, M and N had more than a single peak. All these samples except samples from batch K were from the informal market. Samples from batches B, F, M and N were samples from the same manufacturer and samples from batches A and E were from another manufacturer. Although, samples from batch K was from a formal market, it was not sold in the original packaging and therefore did not contain the brand name of the product, date of manufacture and country of origin for the product. The two peaks that were detected in these samples could have been excipients that are soluble in the mobile phase, impurities (either intentional such as undeclared APIs) or degradation products.
From the results obtained in this research, it can be concluded that out of the fourteen batches, three failed the uniformity of weight test and these were from the informal market. One out of these three that failed the uniformity of weight test also failed the quantitative chemical assay test and the dissolution test. Four other ibuprofen batches were from the same manufacturer but had differences in the packaging used therefore raising suspicion of the possibility of counterfeiting. Two more ibuprofen samples were from the same manufacturer but the appearance of these samples differed in shape, size and colour and therefore failed the appearance test. The other batches passed all the tests done. All the samples tested contained the stated API ibuprofen. However, the other three samples were reported as substandard as they failed to meet the WHO (2015) set standards for either uniformity of weight, chemical assay test or dissolution test.