The current study was conducted to assess the trait association and path analyses in thirty-six rain fed lowland rice genotypes at two locations. The aim of this present study was to estimate the extent of association between pairs of characters at phenotypic and genotypic levels and thereby compare the direct and indirect effects of the characters. The field experiment was laid out in 6x6 simple lattice design with two replications during 2015/16 cropping season. Thirteen characters were measured including yield and related traits. The extent of phenotypic correlation coefficient values indicated presence of fairly strong inherent association among the studied traits. Moreover, association analyses studies indicated yield had significantly (p<0.05) positive genotypic correlation with days to heading, days to maturity, filled grains per panicle, fertile tillers per plant harvest index, total spikelets per panicle and biomass yield. Path coefficient analyses revealed that biomass yield followed by harvest index, total spikelets per panicle and plant height exhibited the highest direct effects on grain yield; these traits can be considered for direct selection for grain yield of rice.
The major cultivated species of rice, Oryza sativa (2n=2x=24), originated in Southern and South Western Tropical Asia. The other species of cultivated rice, Oryza glaberrima (2n=2x=24) is indigenous to the upper valley of the Niger River and it is cultivated only in Western Tropical Africa (Ansari et al., 2015). Rice provides the two-thirds of calories intake for more than three billion people in Asia and one-third of calories intake of nearly 1.5 billion people in Africa and Latin America (Khan et al., 2015).
In Ethiopia, rice is A source of income and employment opportunities for rice farmers. It is used in the preparation of local foods such as injera, dabbo, geniffo, kinchie, shorb and local beverage like tela and arki (Gebrekidan
and Seyoum, 2006; Asefa et al., 2011). Rice production in Ethiopia is predominantly constrained by biotic stress like termite, blast, brown spot diseases, and weeds; abiotic stress such as cold, drought, salinity and soil acidity are the major problems for production of rice. In addition, shortage of adapted varieties to different agro-ecologies and lack of recommended crop management practices for different rice ecosystem (MoARD, 2010; NRRDSE, 2009; Lakew et al., 2014), lack of awareness on its utilization, inadequate technology promotion and seed supply, skilled manpower, erratic rainfall, flood and rice seed shattering was observed (Meron, 2016).
Rice consumers are increasing at the rate of 1.8% every year (Puhan and Siddiq, 2013). The world population is increasing day by day and by 2050 it is expected to reach 9.1 billion; however, agricultural production and productivity is not yet getting higher at a parallel pace (Wani and Sah, 2014). According to an estimate, there are approximately 925 million people on the globe who live in a state of hunger (Karimizadeh et al., 2011). In a bid to eradicate that ugly spot of hunger from the beautiful face of the humanity, we need to significantly increase the production and supply of food by integrating different elements and strengthening the plant breeding tools for crop improvements (Beddington et al., 2012).
Knowledge on association of crop trait for yield with other related traits are essential to the breeder for making crop improvement in a complex quantitative trait such as yield and for which trait direct selection is not much effective. Hence, association analysis is important for determining the direction of selection and number of traits to be considered in improving grain yield (Idris et al., 2012). Path coefficient analysis is a standardized partial regression coefficient and as such measures the direct and indirect effect for one variable upon another and permits the separation of the correlation coefficient into components of direct and indirect effect (Dewey and Lu, 1959). Since yield is a complex trait, indirect selection through correlated is less complex and easier measurable traits would be an advisable strategy to increase the yield. Efficiency of indirect selection depends on the magnitude of correlations between yield and target yield component traits (Bhatti et al., 2005). Breeding strategy in rice mainly depends upon the degree of associated traits as well as its magnitude and nature of variation (Zahid et al., 2006).
Rice breeders are interested in developing cultivars with improved yield and other desirable agronomic traits. In agriculture, path analysis has been used by plant breeders to assist in identifying traits that are useful as selection criteria to improve yield (Dewey and Lu, 1959; Milligan et al., 1990). However, information about trait association between yield and related traits in lowland rice improvement program is not yet well studied. Therefore, in view of this gap, the present study was carried out to evaluate the association between yield and related traits with the objective of estimating the extent of association between pairs of traits at genotypic and phenotypic levels and thereby comparing the direct and indirect effects of the traits.
Description of the study areas
The experiment was conducted in 2015/16 cropping season at Pawe Agricultural Research Center and Fogera National Rice Research and Training Center. The locations are situated in North Western part of Ethiopia in Benishangual-Gumuz and Amhara Regional States, respectively.
Fogera National Research and Training Center is located 607 km from Addis Ababa in the North Western part of Ethiopia. Particularly, the experimental site is located at 11° 58'N latitude, 37° 41'E longitude and at elevation of 1810 m above sea level. Based on ten years average meteorological data, the annual rainfall, mean annual minimum and maximum temperatures are 1300 mm, 11.5°C, respectively. The soil type is black (Vertisol) with average pH of 5.90.
Pawe Agricultural Research Center is located 578 km away from Addis Ababa. The experimental site is found at 13° 19’ N latitude, 37° 24’ E longitude and at an elevation of 1200 m above sea level. The major soil type of the study site is well drained Nitisol with the pH value ranging from 5.3 to 5.5. The annual rainfall, mean annual minimum and maximum temperatures are 1587 mm, 16.3°C and 32.6°C, respectively.
Experimental materials, design and trial management
The present study contained a total of thirty-six rice genotypes including two checks (Ediget and X-jigna). All rice genotypes were obtained from Fogera National Rice Research and Training Center and were introduced from Africa Rice. The experiment was laid out in 6x6 simple lattice design at each location. The plot size was six rows of 5 m length with 0.2 m row spacing giving a total area of 6 m2 spacing of 1.0 m and 0.30 m were used between blocks and plots, respectively. For data collection, the middle four rows were used for determination of yield and yield component traits. The genotypes were planted by manual drilling at a rate of 36 g per plot in 2015/16 cropping season at two locations. Recommended fertilizer of Urea and DAP at the rate of 64 kg N ha-1 and 46 kg P2O5 ha-1 was applied to each experimental plot. P2O5 was applied all at planting time while N was applied in three splits (1/3 at planting, 1/3 at tillering and the remaining 1/3 at panicle initiation) according to the national rice fertilizer blanket recommendation at each location. Weeding was done by hand two to three times starting from 25-30 days after sowing depending on infestation level. All other important agronomic practices were applied as per the recommendation for rice production in the two locations during the growing season.
Data collection
14 quantitative traits of morphological data at right growth stage of rice were collected and recorded according to two rice descriptors (IRRI, 2002; Bioversity International, 2007). Days to 50% heading, fertile tillers per plant, plant height (cm), Panicle length (cm) culm length (cm), flag leaf length (cm), number of filled grains per panicle, number of unfilled grains per panicle, number of total spikelets per panicle, days to 85% maturity, biomass yield per plot (gram per plot) grain yield per plot (gram) thousand grains weight(g) and harvest index (%) were collected.
Data analysis
Path analysis, phenotypic and genotypic correlations data was subjected to analysis using SAS 9.2 (SAS, 2008) and GENRES Statistical Software, 1994).
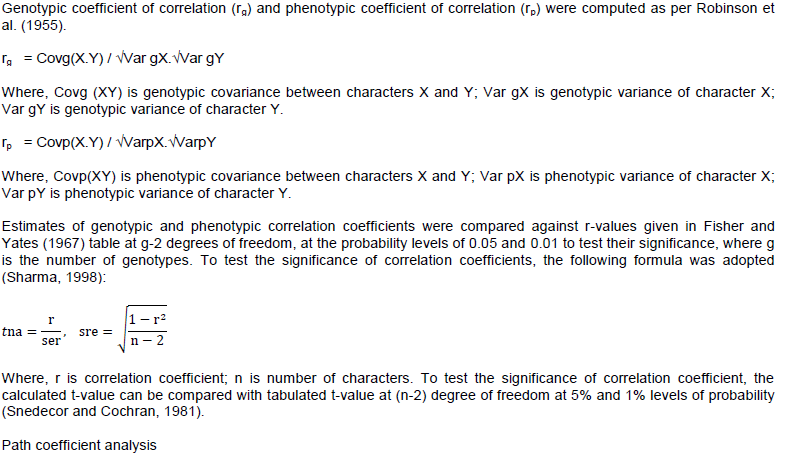
Correlation coefficient analysis
Analysis of variance
The analysis of variance revealed that there were significant differences (P< 0.01) among thirty-six genotypes for all characters studied at two locations. However, number of filled spikelets per panicle, fertile tillers per plant, number of total spikelets per panicle and harvest index were non-significant at Pawe location while number of unfilled spikelets per panicle (p< 0.05) was significant at Fogera location. Though, unfilled spikelets per panicle and thousand grains weight were non-significant at both locations.
Character association
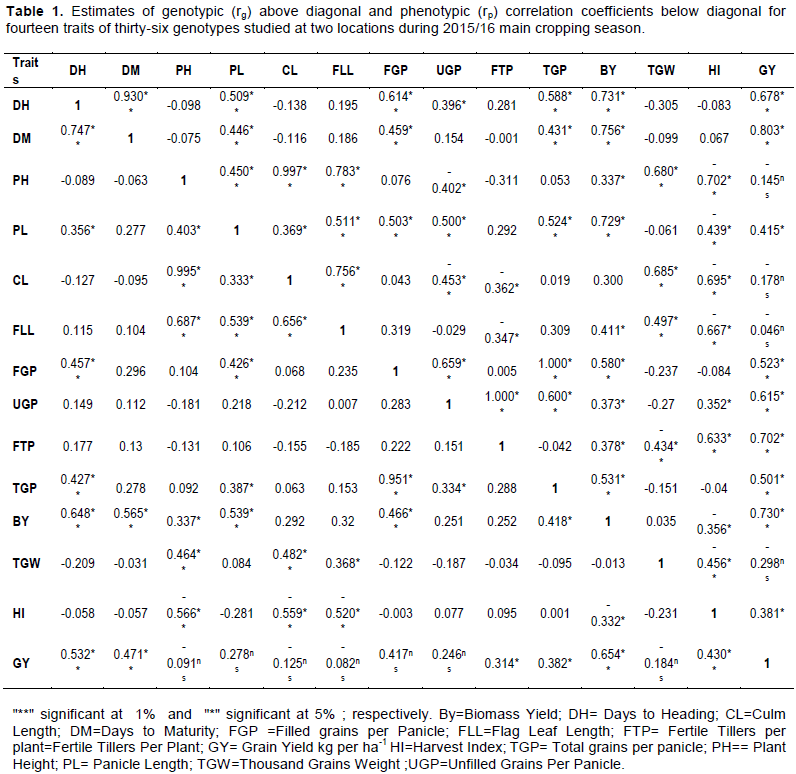
Phenotypic (rp) and genotypic (rg) correlation estimates between the various characters are presented in Table 1. Close values of genotypic and phenotypic correlations were observed between some traits combinations, such as days to heading with plant height, culm length with biomass yield, panicle length with flag leaf length, culm length with filled grains per panicle, biomass yield with harvest index and plant height with panicle length which might be due to reduction in environmental variance to minor proportions as reported by Dewey and Lu (1959). Yield exhibited positive and highly significant (p<0.01) genotypic correlation with days to heading (rg=0.678**), days to maturity (rg=0.803**), filled grains per panicle (rg=0.523**), fertile tillers per plant (rg=0.702**), harvest index (rg=0.668**), total spikelets per panicle (rg=0.501**) and biomass yield per plot (rg = 0.730**), respectively which shows that improving these traits may result in the improvement of yield as the results of positive and strong correlation (Table 1). Similarly, Iftekharuddaula et al. (2002) reported the positive correlation of grain yield with panicle length and harvest index. Moreover, days to heading (rg= 0.532**), days to maturity (rg=0.471**), fertile tillers per plant (rg=0.314*), total spikelets per panicle (rp=0.382*), biomass yield (rp=0.654**) and harvest index (rp=0.430**) showed positive and significant correlation with yield at phenotypic level. Similar findings were reported by Nandan et al. (2010) for days to heading and Karim et al. (2014) who observed positive association between harvest index and yield. Indris et al. (2013 and Kishore et al. (2015) reported positive correlation of filled grains per panicle with yield. Laza et al. (2004) reported similarly for total spikelets per panicle with yield. Corresponding findings was noticed by Naseem et al. (2014) for days to maturity and total spikelets per panicle. Similarly, Fentie et al. (2014) confirmed positive correlation of biomass yield with grain yield. On the other hand, yield had non-significant but positive phenotypic correlation with unfilled grains per panicle (rp=0.246), filled grains per panicle (rp=0.417) and panicle length (rp=0.278) which suggests that selection for these traits would not improve yield.

Phenotypic correlation between the traits
Correlations between yield components and other quantitative traits help in understanding the association between the characters. Days to heading exhibited positive and significant (p<0.01) phenotypic association with days to maturity (rp=0.747**), panicle length (rp=0.356*), filled grains per panicle (rp=0.457**), biomass yield (rp=0.648**) and total grains per panicle (rp=0.427**). Days to maturity showed significant correlation at (p<0.01) with biomass yield (rp=0.565**) while non-significant for the rest of traits.
Plant height showed positive and significant correlation with culm length (rp=0.995**), flag leaf length (rp=0.687**), panicle length (rp=0.403*), above ground biomass yield (rp=0.337*) and thousand grains weight (rp=0.464**) and negative and significant correlation with harvest index (rp=-0.566**). The finding is in conformity with Ghosal et al. (2010) and Kishore et al. (2015) for panicle length. Moreover, panicle length showed significant and positive association with culm length (rp=0.333*), flag leaf length (rp=0.539**), filled grains per panicle (rp=0.426**), total grains per panicle (rp=0.387*) and biomass yield (rp=0.539**) but non-significant association with unfilled grain per panicle (rp=0.218), fertile tillers per plant (rp=0.106), thousand grains weight (rp=0.084) and harvest index (rp=-0.281).
Culm length had significant and positive association with the traits such as flag leaf length (rp=0.656**) and 1000-grain weight (rp=0.482**) whereas it had negatively associated with harvest index (rp=-0.559**). Flag leaf length manifested positive and significant association with 1000-grains weight (rp=0.368*) and had negative association with harvest index (rp=-0.520**). Number of filled grain per panicle showed a positive strong to moderate correlation with number of total grain per panicle (rp=0.951**) and biomass yield (rp=0.466**), respectively. However, contrary to the observation of Karim et al. (2014) who reported highly significant negative correlation between 1000-grains weight and number of filled grain per panicle. According to Adams and Grafius (1971), the negative correlations arise primarily from competition for a common possibility, such as nutrient supply. If one component gets advantage over the other, a negative correlation may arise. The genetic reasons for this type of negative association may be linkage or pleiotropy. Total grains per panicle revealed positive correlation with biomass yield (rp=0.418*) and non-significant with thousand grains weight (rp=-0.095) and harvest index (rp=0.001), respectively. Biomass yield per plot had significant and negative association with harvest index (rp=-0.332*).
Genotypic correlation coefficient
Some of traits genotypic correlation coefficients were higher than their corresponding phenotypic correlation coefficient values (Table 1) which indicates a fair strong inherent relationship between the traits due to suppressing effect of the environment, which may have modified the phenotypic expression of these traits by reducing phenotypic coefficient values at the period of characters’ development. Similar findings were reported by Zahid et al. (2006) and Prasad et al. (2001). The yield component traits revealed various trends of association between themselves. For instance, days to heading (0.930**) followed by biomass yield (rg=0.731**), filled grains per panicle (rg=0.614**), total grains per panicle (rg=0.588**), panicle length (rg=0.509**) and unfilled grains per panicle (rg=0.396*) showed significant and positive correlation (p<0.01) with days to maturity. Moreover, days to maturity manifested significant and positive correlation (p<0.01) with panicle length (rg=0.446**), filled grains per panicle (rg=0.459**), total grains per panicle (rg=0.431**) and biomass yield (rg=0.756**).
Plant height had significant and positive genotypic correlation with traits such as panicle length (rg=0.450**), culm length (rg=0.997**), flag leaf length (rg=0.783**) and biomass yield (rg=0.337*); however, it had negative and significant association with unfilled grains per panicle (rg=-0.402*) and harvest index (rg=-0.702**). Likewise, Iftekharuddaula et al. (2001) reported highily significant and positive correlation of plant height with panicle length and negative correlation for harvest index. Similarly, Ghosal et al. (2010), Babu et al. (2012) and Kishore et al. (2015) reported positive correlation of plant height with panicle length. Panicle length was positively and significantly associated with culm length (rg=0.369*), flag leaf length (rg=0.511**), filled grain per panicle (rg=0.503**), thousand grains weight (rg=0.405*), unfilled grain per panicle (rg=0.500**), total grain per panicle (rg=0.524**) and biomass yield (rg=0.729**). Harvest index had negative and significant association with panicle length (rg=-0.439**), culm length (-0.695**), flag leaf length (-0.667**), biomass yield (-0.356*) and thousand grains weight (-0.456**) while positive significant association with unfilled grains per panicle (0.352*). In contrast, Kishore et al. (2015) reported non-significant association with filled grain per panicle and thousand grains weight.
Filled grains per panicle had strong positive correlation with the total grains per panicle (1.000**) followed by unfilled grain per panicle (0.659**) and biomass yield (0.580**) but the rest traits indicated non-significant association. Unfilled grains per panicle showed positive correlation at genotypic level with total grains per panicle (0.600**), biomass yield (0.373*) and harvest index (0.352*). Fertile tillers per plant showed significant positive association with biomass yield (0.378*) and harvest index (0.633**) while it showed significant and negative correlation with thousand grains weight (-0.434**). Similarly, Rokonuzzaman et al. (2008) reported significant negative correlation for thousand grains weight. Total grains per panicle showed significant association with biomass yield (0.531**) but non-significant association with thousand grains weight and harvest index.
On the contrary, Iftekhlruddaula et al. (2001) observed significantly negative association with harvest index and thousand grains weight. Biomass yield manifested negative and significant association with harvest index (-0.356*). Culm length revealed positive and significant association with flag leaf length (0.756**) and thousand grains weight (0.685**) whereas it had negative and significant association with unfilled grain per panicle (-0.453**), fertile tillers per plant (-0.362*) and harvest index (-0.695**). Similarly, flag leaf length exhibited positive and significant correlation with thousand grains weight (0.497**) and biomass yield (0.411*). However, harvest index (-0.667**) and fertile tillers per plant (-0.347*) showed significant and negative correlation.
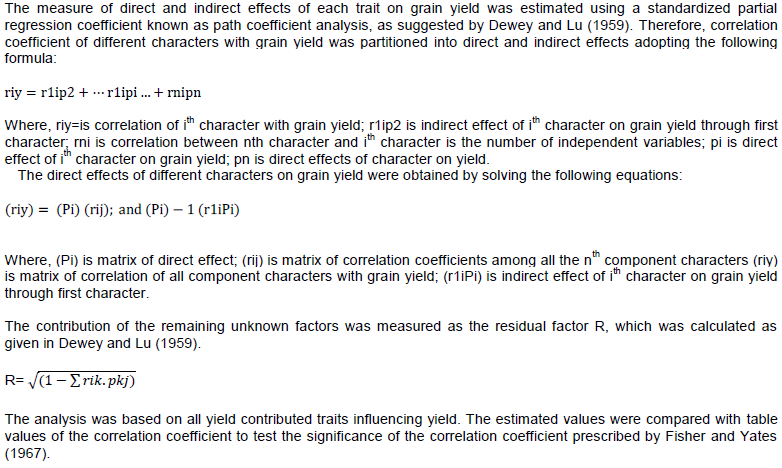
Path coefficient analysis
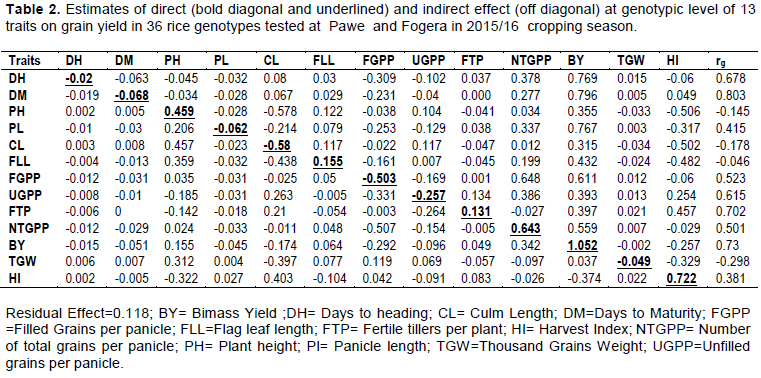
Grain yield is becoming a complex outcome of various traits which were considered to be the dependent trait. In the current study, thirteen traits were selected as casual variables to evaluate the contribution of these individual traits for yield (Table 2).
Direct effect of different traits on yield
A perusal result of genotypic path analysis revealed that biomass yield (1.052) followed by harvest index (0.722), total grains per panicle (0.643) and plant height (0.459) had highest direct effect on yield with significant and positive genotypic correlation across locations, which indicates the correlation that explains the true association with yield and direct selection through these traits will be effective. Hence, selection of genotypes with more total grains per panicle, harvest index, biomass yield and plant height is necessary to be emphasized during simultaneous selection to prove effectively increasing yield potential (Table 2). These traits have been identified as major direct contributors towards yield by Srek and Beper (2002) and Pratap et al. (2012) for biomass yield and harvest index for rice, respectively. Khare et al. (2014) reported similarly, the highest positive direct effect of the total grains per panicle on yield in earlier study. Sravan et al. (2012) reported a maximum direct effect of biological yield on yield followed by harvest index, and total grains per panicle in upland rice. Mulugeta (2015) reported biomass yield and plant height as the major contributors to yield and had direct effect on yield in upland rice. Karim et al. (2014) and Kishore et al. (2015) reported that plant height had high direct positive effect on yield.

On the other hand, days to heading (-0.020), days to maturity (-0.068), panicle length (-0.062), culm length (-0.580), unfilled grains per panicle (-0.257), filled grains per panicle (-0.503) and thousand grains weight (-0.049) had negative direct loading on yield except on culm length, panicle length, and thousand grains weight but showed positive and significant genotypic correlation with yield. The negative direct effect indicates that the direct selection through these traits would not prove to be useful for the improvement of yield of rice. Similar results reported earlier by Mulugeta et al. (2012) for days to maturity and Kiani and Nematzadeh (2012) also noticed negative direct effect of panicle length on yield. On the contrary, Kiani and Nematzadeh (2012) reported the positive direct effect of filled grains per panicle on yield of rice.
Indirect effect of various traits on yield
The highest and positive indirect effect on yield shown by days to maturity through biomass yield (0.796), days to heading via biomass yield (0.769), panicle length through biomass yield (0.767), filled grains per panicle through total grains per panicle (0.648), filled grains per panicle by biomass yield (0.611), total grains per panicle by biomass yield (0.559), fertile tillers per panicle through harvest index (0.457) and culm length via plant height (0.457). Thus, indirect selection based on these traits should be considered simultaneously as indirect selection criteria for yield improvement. In contrast, Karim et al. (2014) reported negative indirect effect of panicle length on yield. The perusal of path analysis result indicated that plant height exhibited high negative indirect effect on yield through culm length (-0.578) and harvest index (-0.506), total grains per panicle through total grains per panicle (-0.507) and culm length via harvest index (-0.502). The indirect effect of days to heading through culm length (0.080), flag leaf length (0.030), fertile tillers per plant (0.037) total grains per panicle (0.378), biomass yield (0.769) and thousand grains weight (0.015) counter balanced the negative direct effect days to heading on yield (-0.020) and reduced the correlation coefficient to +0.678.
Correspondingly, the indirect effect of days to maturity through culm length (0.067), flag leaf length (0.029), fertile tillers per plant (0.0001) total grains per panicle (0.277), biomass yield per plot (0.796), thousand grains weight (0.005) and harvest index (0.049) counter balanced the negative direct effect of days to maturity on yield (-0.068) and reduced the correlation coefficients to +0.803. Moreover, the indirect effect of panicle length through plant height (0.206), flag leaf length (0.079), fertile tillers per plant (0.038), total grains per panicle (0.337), biomass yield (0.767) and thousand grains weight (0.003) counter balanced the negative direct effect of panicle length on grain yield (-0.062) and reduced the correlation coefficient +0.415. The negative direct effect of culm length on yield per hectare (-0.580) was counter balanced mainly by its positive indirect effects through plant height (0.457) and reduced its genotypic correlation to -0.178. Similarly, the indirect effect of filled grains per panicle mainly counter balanced through total grains per panicle (0.648) and biomass yield (0.611) reduced its genotypic correlation to +0.523.
The residual effect (0.118) showed that the traits which are included in the genotypic path analysis explained 88.2% of the total variation on yield that was contributed by thirteen traits studied. The residual 11.8% showed that there are some more traits that were not included in the present study but could contribute to yield. Most likely, biomass yield, harvest index, total grains per panicle and plant height has the highest direct effect on yield with significant and positive genotypic association. This indicates that the correlation revealed the true association and direct selection through these traits will be effective.
Yield exhibited positive and highly significant (P <0.01) genotypic correlation with traits like days to heading, days to maturity, filled grains per panicle, fertile tillers per panicle, harvest index, total grain per panicle and biomass yield, respectively. This indicates the importance of these traits for yield improvement in rice. Thus, the indirect selection for higher yield based on these characters would be reliable.
Path coefficient analysis revealed that biomass yield, harvest index and number of total grains per panicle had the highest direct effect on grain yield with significant and positive genotypic association, which indicates that the correlation explains the true association with grain yield and direct selection through those traits will be effective. Thus, selection of genotypes with more harvest index, biomass yield, plant height and total grains per panicle are important to develop high yielder varieties and an emphasis be given for these traits in future breeding efforts.