Full Length Research Paper

ABSTRACT
The study on ecological survey of plant species biodiversities and abundance in Southeastern Nigeria was conducted between January 2012 and 2013 at Anambra State, Nigeria to determine the plant species biodiversities and abundance in three forest fringes viz: community, shrine and reserves using measures based on floristic, stratified random sampling, plotless measure and point centre quarter methods, respectively. Shannon-wienners index of diversity analysis proved that Umunze community forest was highest in biodiversity (0.95) with Afzelia africana as the most dorminant species (148.93) while Pterocarpus sp. has the highest importance value index (25.36). Achala forest reserve has Chlorophora exdelsa as the most dominant (686.09), while Tectora grandis recorded the highest importance value index (62.53). The dominant species in Iyiocha forest was Pterocarpus species (451.31), while Newbouldia levis has the highest importance value index. Regression analysis showed that at P<0.05, there is a significant relationship between species abundance and species diversity.
Key words: Ecology, survey, plants, biodiversities, abundance, Anambra.
INTRODUCTION
The scientific study of forest species and their interaction with the environment is referred to as forest ecology, while the management of forests is often referred to as forestry (Padoch et al., 1985). Primack (1991) noted that forest management has changed considerably over the last few centuries, with rapid changes from the 1980s onwards culminating in a practice now referred to as sustainable forest management. Forest ecologists concentrate on forest patterns and processes, usually with the aim of elucidating cause and effect relationships. Foresters who practice sustainable forest management focus on the integration of ecological, social and economic values, often in consultation with local communities and other stakeholders (Primack, 1991). Forests can be found in all regions capable of sustaining tree growth, at altitudes up to the tree line, except where natural fire frequency or other disturbance is too high, or where the environment has been altered by human activity.
Anthropogenic factors that can affect forests include logging, urban sprawl, human-caused forest fires, acid rain, invasive species, and the slash and bum practices of swidden agriculture or shifting cultivation (Momberg, 1992). The loss and re-growth of forest leads to a distinction between two broad types of forest, primary or old-growth forest and secondary forest. FAO (1991) reported that, there are also many natural factors that can cause changes in forests over time including forest fires, insects, diseases, weather, competition between species, etc. In 1997, the World Resources Institute recorded that only 20% of the world's original forests remained in large intact tracts of undisturbed forest.
However, Agbelusi and Afolayan (1987) stated that, over the past decades, the annual increase in timber exports by value, mostly from West Africa has exceeded 12%, and local and external demands are certain to increase further. The availability of commercial timber in forests at present in use is diminishing but there are possibilities of bringing untapped areas into production. Sustainable management of the forests that can meet the standard of the Millennium Development Goals is therefore sacrosanct.
More than 75% of these intact forests lie in three countries - the Boreal forests of Russia and Canada and the rainforest of Brazil. In 2006, this information on intact forests was updated using latest available satellite imagery (Ramesteiner, 1998).
Old-growth forest contains mainly natural patterns of biodiversity in established seral patterns, and they contain mainly species native to the region and habitat. The natural formations and processes have not been affected by humans with a frequency or intensity to change the natural structure and components of the habitat. Secondary forest contains significant elements of species which were originally from other regions or habitats.
In the United States, most forests have historically been affected by humans to some degree, though in recent years improved forestry practices has helped regulate or moderate large scale or severe impacts. However, Leakey and Newton (1994) stated that, the United States Forest Service estimates a net loss of about 2 million hectares (4,942,000 acres) between 1997 and 2020; this estimate includes conversion of forest land to other uses, including urban and suburban development, as well as afforestation and natural reversion of abandoned crop and pasture land to forest. However, in many areas of the United States, the area of forest is stable or increasing, particularly in many Northern states. The opposite problem from flooding has plagued national forests, with loggers complaining that lack of thinning and proper forest management has resulted in large forest fires (Leakey and Newton, 1994).
Momberg (1992) posited that, the concept of sustainable forest management has continued to evolve since 1992 through international forest policy dialogue within the Intergovernmental Panel on Forests (IPF), the Intergovernmental Forum on Forests (IFF) and the United Nations Forum on Forests (UNFF) and through a large number of country led eco-regional initiatives aimed at translating the concept into practice. These include the development of criteria for and indicators of sustainable forest management supported by international organizations including FAO, the International Tropical Timber Organization (ITTO), the United Nations Environment Programme (UNEP) and other members of the Collaborative Partnership on Forests (CPF) (Momberg, 1992). This work is set to determine the species richness, species abundance, species diversities of the sampled forests and thus provide an inventory of the available species in this basin; also to determine the current status of forest resources of Anambra State (a) categories, (b) size, (c) composition, (d) degree of deforestation and finally determine the extent to which these forest resources have been sustainably managed with particular reference to timber product extractions.
METHODOLOGY
The study area
The first thematic step taken to carry out this research was a preliminary/reconnaissance survey of the forests to be sampled. This entails a careful study of the areas in question to determine the heterogeneity and understand the techniques to be used in sampling the areas. Anambra State has five (5) forest zones which are based on the five agricultural zones of the state. They include: Awka zone, Nnewi zone, Abagana zone, Otuocha zone and Onitsha zone. Out of these five zones, three zones were selected for sampling. Egboka (1993) stated that, Anambra is a state in the south-eastern Nigeria. °Its name is an anglicized version of the original 'Oma Mbala', the name of the river now known as Anambra River which the state is named after. The state derives its name from the Anambra River, the largest, most southerly, left bank tributary of the River Niger.
With a total land area of 4,416 sq km, Anambra State is situated on a generally low elevation on the eastern side of the River Niger, shares boundaries with Kogi, Enugu, lmo, Abia, Rivers, Delta and Edo states. It lies within the following geographical locations: 5° 4S1N to 6° 4S1N and 6° 361E to 7° 081E (Egboka, 1993). It is bordered in the West by Delta State, on the North by Kogi State, on the east by Enugu State and on the South by Imo State.
The climate
The climate of Anambra State is an equatorial tropical rain forest type. It is characterized by two main seasons viz: the rainy (wet) season and the dry season. The rainy season is characterized by heavy thunder storms and occurs between the months of April and October, while the dry season extends from November to March annually (Nwosu, 2003).
The intensity of the rainfall is generally heavy during the rainy season, except in the month of August where there is a noticeable drop in rainfall, he asserted. This phenomenon is normally referred to as the August break and hence the double maxima of rainfall which is the characteristic of this pattern of rainfall. This rainy season is characterized by high temperature (25 to 33°C), and high relative humidity (85%) (Nwosu, 2003). In the course of his work, Nwosu (2003) also observed that the dry season is characterized by chilly and dry North east Monsoon or hamattan winds. This lowers temperature appreciably especially in the months of December and January. He noted that its main features are: excessive evaporation, low relative humidity, and general dry weather which results in the drying and loss of vegetal cover. He also noted that in most part of Anambra State, temperature is usually high over the year. Thus, the average minimum and maximum temperatures are about 25 and 32°C, respectively, while the annual rainfall is also very high with a mean of about 200 mm.
Distribution and geographical ranges of forests
Forests can be found in all regions capable of sustaining tree growth, at altitudes up to the tree line, except where natural fire frequency or other disturbance is too high, or where the environment has been altered by human activity.
The latitudes 10° north and south of the Equator are mostly covered in tropical rainforest, and the latitudes between 53°N and 67°N have boreal forest. As a general rule, forests dominated by angiosperms (broadleaf forests) are more species-rich than those dominated by gymnosperms (conifer, montane, or needlleaf forests), although exceptions exist (Michon and Bompard, 1987).
Forests sometimes contain many tree species only within a small area (as in tropical rain and temperate deciduous forests), or relatively few species over large areas (e.g., taiga and arid montane coniferous forests). Aumeerudy (1993) noted that, forests are often home to many animal and plant species, and biomass per unit area is high as compared to other vegetation communities. Much of this biomass occurs below ground in the root systems and as partially decomposed plant detritus. The woody component of a forest contains lignin, which is relatively slow to decompose when compared with other organic materials such as cellulose or carbohydrate.
Measures based on floristic
The species composition of each sampled forest was assessed floristically; this was accompanied by the amount or abundance of each species present at a site. It is useful to distinguish between abundance and richness, the latter being the number of species present on a particular area. However, the forest area was marked out and stratified, and then species measurement by girth was made of trees above one meter in height.
Stratified random sampling
This method of sampling, according to Moore and Chapman (1986) has been extensively used in disciplines other than ecology. They noted that it involves subdividing the field of study into relatively homogeneous parts and then sampling' each subdivision according to its area, or some other parameters.
Plotless measures
The use of plotless method was employed to estimate the density of the species. This design could also be used for collecting information on the species composition, growth and environmental factors. The type of plotless method that was employed is the point center quarter method.
The point center quarter method
In the point center quarter method, four distances were measured at each sampling point. Four quarters were established at the sampling point through a cross formed by two lines. One line is the compass direction and the second line running perpendicular to the compass direction through the sampling point. The line cross can also be randomly established by spinning a cross over each sampling point. The distance to the mid-point of the nearest tree from the sampling point is measured in each quarter.
The four distances of a number of sampling points are averaged and when squared are found to be equal to the mean area occupied by each tree. Cottam and Curtis (1956) tested the reliability of this method on several random populations by checking the result with the plot method. The estimates of the correct mean area per tree (MA) were found to apply to each of the different sets of mean distance. Therefore no correction factor is needed when the four quarter distances are averaged: MA = D2, where D = the mean distance of four points to the nearest tree distances taken in each of four quarters. The mathematical prove of the workability of this method has been given by Morisita (1954). According to Cottam and Cuttis (1954), the accuracy increases with the number of sampling points and a minimum of 20 points is recommended.
Newsome and Dix (1968) noted that one of the limitations of this method for field application is that an individual must be located within each quarter and an individual must not be measured twice. After sampling, the species diversity was calculated using the data that accrued from the sampling of the forests.Shannon-Winner index of diversity was used to analyze and determine the species diversity of each forest.
RESULTS
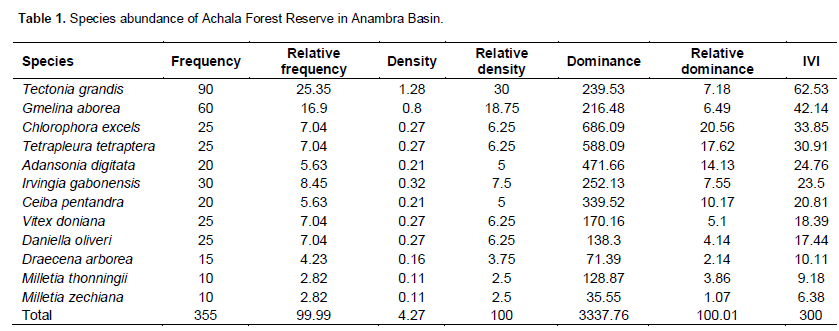
From Table 1, Tectonia grandis recorded the highest importance value index (63.53) while Milletia zechiana recorded the least important value index (6.38). T. grandis therefore becomes the abundant species of Achala forest reserve.
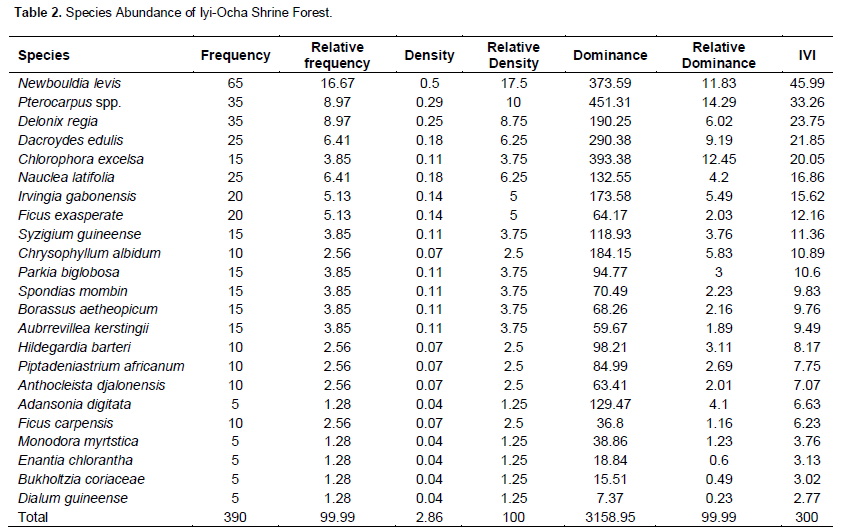
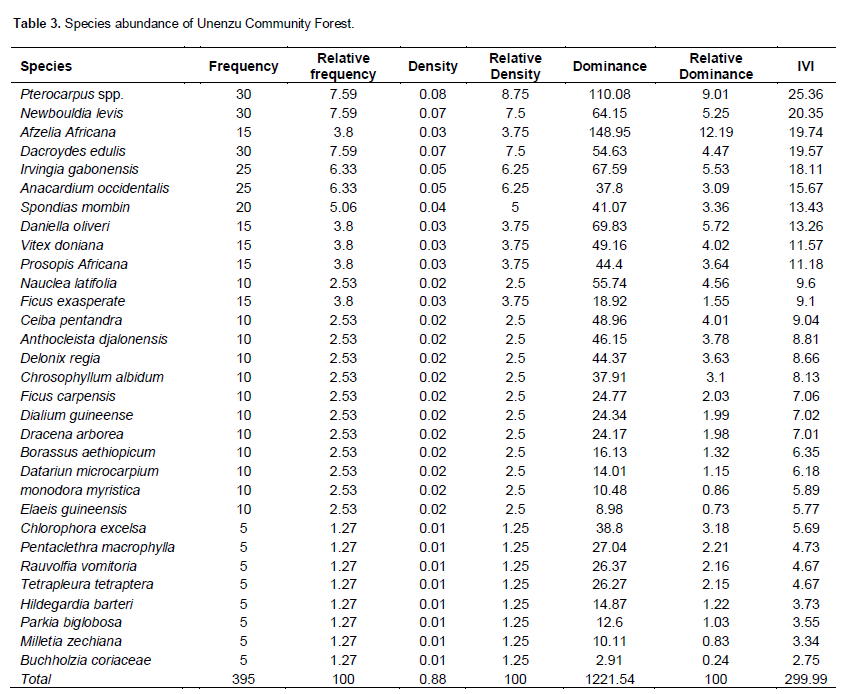
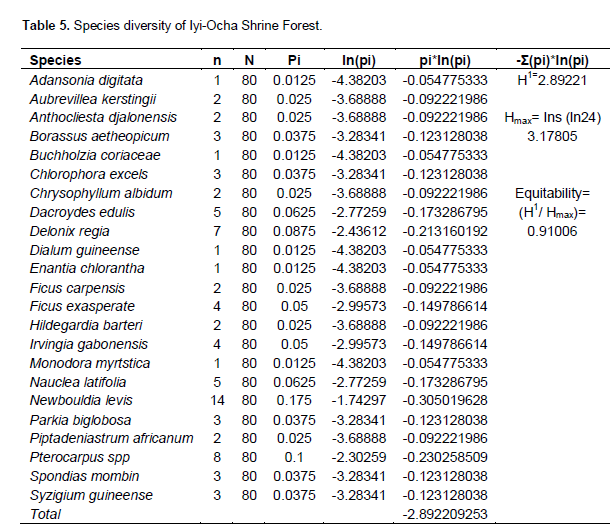
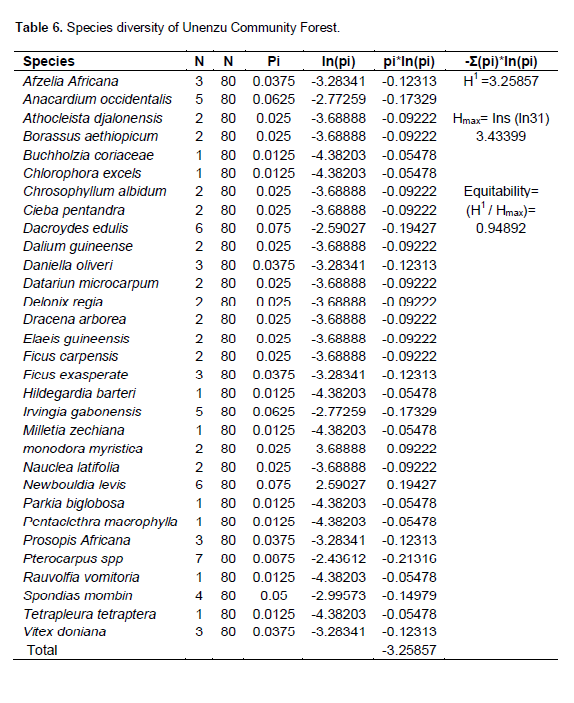
From Table 1, Newbouldia levis recorded the highest importance value index (45.99) while Dialum guineense recorded the least importance value index (2.77). N. levis therefore becomes the abundant species of Iyi-Ocha Shrine Forest.From Table 1, Pterocarpus spp. has the highest importance value index (25.36) while Buchholzia coriaceae has the least importance value index (2.75). Pterocarpus spp. therefore becomes the abundant species of Unenzu Community Forest.
DISCUSSION
In assessing the species abundance of Achala Forest Reserve, it was discovered that T. grandis was the most frequent (90%) followed by Gmelina aborea (60%). T. grandis was also found to be more dense (1.28) than others. However, the most dominant was Chlorophora excelsa (686.09) followed by Tetrapleura tetraptera (588.09). When the importance value index was determined, it was observed that T. grandis recorded the highest importance value index (62.53), while Milletia zachiana recorded the least importance value index (6.38). It becomes clear that T. grandis was the most abundance species in Achala Forest Reserve. However, from Table 2, Iyiocha Shrine Forest had N. levis as the most frequent (65%) followed by Pterocarpus species (35%) and Delonix regia (35%) respectively. Density followed the same pattern, N. levis (0.5), Pterocarpus species (0.3) and D. regia (0.3). The most dominant species was Pterocarpus species (451.31) while the least was Dialum guineense (7.37). Also from the table, N. levis recorded the highest importance value index (45.99) while D. guineense recorded the least importance value index. It became glaring that it is the most abundance species in Iyiocha Shrine Forest.
The species abundance of Unenzu Community Forest in Table 3 showed that Pterocarpus species and N. levis were the most frequent with 30% frequency each respectively. Records also showed that the most dense of the species in this forest was Pterocarpus species followed by N. levis and Dacroydes edulis with 0.07 density each. The most dominant of the species was Afzelia africana (148.95) followed by Pterocarpus species (110.08). Also, records showed that Pterocarpus species has the highest importance value index (25.36) while Buchholzia coriaceae has the least importance value index (2.75). It was clear that Ptericarpus species was the most abundance species in Unenzu Community Forest. However, Wright (1991) observed that abundance is contrasted, but typically correlate to incidence, which is the frequency with which the species occur in a sample. In his work to determine the abundance of species in the Nature Reserve Wisconsin, he noted that oak tree, gopherwood and Virgilia dominated the forest more than other species, though their quantitative measurements were not given. Damgaard (2009) have also worked extensively on species abundance on different forest resources and agreed that some species are actually more in abundance than others. They noted that one of the factors that could account for this was probably because majority could withstand extreme environmental condition as well as sustainable exploitation of the species. This is in agreement with the finding of this work in the sense that some of the dominant species have been sustainably exploited especially in the government regulated areas like the Forest Reserves. Barfet et al. (2001) have also worked extensively on species abundance on different forest resources and agreed that some species are actually more in abundance than others. They noted that one of the factors that could account for this was probably because majority could withstand extreme environmental condition as well as sustainable exploitation of the species. This is in agreement with the finding of this research work in the sense that some of the dominant species have been sustainably exploited especially in the government regulated areas like the Forest Reserves.
Colwell and Coddington (1994) also in their work on species abundance observed that the vast areas of flat or gently sloping land in the hot deserts of North America were dominated by a single species of shrub-like tree, Larrea tridentate, while grasses and forbs grow in the spaces between these trees. Their work contrasted heavily with these findings because despite the fact that a particular tree or two were more in abundance, yet most other trees could be seen juxtaposed within the forests. The observed difference could stem from the fact that their research was conducted in the desert while this research was conducted in a forested area.
Species diversities
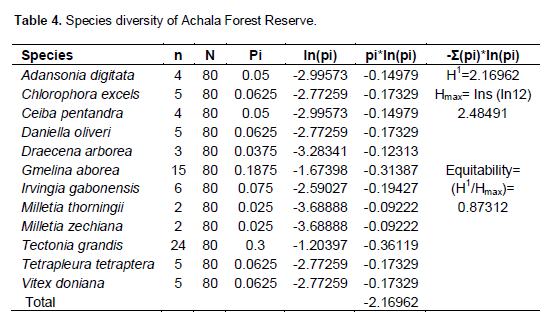
The analysis of the species diversities using Shannon Wiener index of diversity proved that Achala forest reserve has the diversity of 0.87; Iyiocha shrine forest has the diversity of 0.91, while Unenzu community forest has 0.94 species diversity. Unenzu community forest recorded highest in species diversity. Records also showed that Unenzu community forest has the highest number of tree species (32) as against 23 and 12 of Iyiocha and Achala, respectively (Table 4, 5 and 6).
The regression analysis proved that the t-value of the coefficient of the number of species is significant (P<0.05) indicating a significant relationship between number of species and species diversity. The coefficient of (0.005) implies that a percentage point increase in the number of species increase species diversity by 0.005. The number actually explains about 48.0% of species diversity. The p-value of the f-statistics is significant (P<0.05) indicating that the model is a good fit. Jost (2007), Tuomisto (2010) and Krebs (1999) all agreed that the observed species diversity is affected by not only the number of individual species, but also by the heterogeneity of the sample. They were also of the opinion that increasing the area sampled increases observed species diversity both because more individuals get included in the sample and because large areas were environmentally more heterogeneous than small areas. Their observation tallies with the present research work because virtually all the sampled forests were highly diverse. The discrepancies in the species diversities could also be attributed to environmental factors, forest management or soil conditions which were not measured.
Connell (1978) in one of his researches noted that a rich plant life forms cover organ Pipe National Monument in Southern Arizona. He observed that growth of Ocofillo species consisting of several slender branches 2 to 3 m tall springing from a common base, there was also Palo Verde trees with green bark and tiny leaves. According to Connell (1978), the most abundant was the Saguaro, a massive cactus that towers over all the other plants species. This agrees with this present research. Different plants species were observed though some were more in abundance and more frequent than others.
Whicker and Defling (1988) has been able to explain much of the variation in woody plant diversity and dominance by some tree species across Sonoran Desert landscapes by differences in soil age, frequency of land disturbance caused by soil erosion and soil depth. The key point here is that communities generally consist of many species that potentially interact in all the ways with one another.
Bush et al. (1989) concurred that species diversity increases with environmental complexity or heteroge-neity. They however noted that an aspect of environ-mental structure important to one group of organisms may not have a positive influence on another group. Consequently, one must be acquainted with the ecolo-gical requirements of species to predict environmental structure that affects the diversity. Conclusively, this ecological survey showed that there is variance in plant species composition, abundance and biodiversity between the areas studied and thus suggest there is a declining rate of these plant species which portend great importance to man and animals in our societies today and thus provide a baseline studies on the various status of these plant species population studies.
CONFLICT OF INTERESTS
The author(s) have not declared any conflict of interests.
REFERENCES
| Agbelusi EA, Afolayan TA (1987). The role of wildlife in the Nigerian economy, in Proceedings of the 17th Annual Conference of the Forestry Association of Nigeria, Ikeja, Nigeria (unpublished). pp. 15-27. | ||||
| Aumeeruddy Y (1993). Agroforests and protected forest areas: indigenous representations and agroforestry practices around Kerinci National Park, Sumatra, Indonesia. Ph.D. thesis, Universite Montpellier II, France. pp. 438. | ||||
| Bush, MD, Pipemo DR, Colivanx PA (1989). A-6000 year history Amazonian Maize cultivation. | ||||
|
Colwell RK, Coddington JA (1994), Estimating terrestrial biodiversity through extrapolation. Phylosophical transactions. Biol. Sci. 345:101-118. Crossref |
||||
|
Connell JH (1978). Diversity in tropical rain forest and coral reefs. Sci. 199:1302-1310. Crossref |
||||
|
Damgaard C (2009). On the distribution of plant abundance data. Ecol. Inform. 4(2):76-82. Crossref |
||||
| Egboka BCE (1993). Erosion, Gullies and Landslide Ravage in Anambra State.ASECA., Awka. 215pp. FAO (199Ia), Natural resource management and biodiversity. J. For. Woodland Resour. 10(2):3. | ||||
| Leakey RRB, Newton AC (1994). Tropical trees: the potential for domestication and the rebuilding of forest resources. HMSO, London. 284p. | ||||
| Michon G, Bompard JM (1987). The Damar Gardens (Shoreajavanica) in Sumatra. In: Proceedings of the Third Roundtable Conference on Dipterocarps, ed. A.G.J.H. Kostermans. UNESCO, Paris. pp. 3-17. | ||||
| Momberg F (1992). Indigenous knowledge systems: potentials for social forestry development. Resource management of land: Dayaks in West Kalimantan. MA thesis, Institute for Geography, Freie UniversiUit, Berlin. 212 p. | ||||
|
Padoch C, Chota Inuma J, Dejong W, and Unruh J (1985). Amazonian agroforestry: a market-oriented system in Peru. Agrofor. Syst. 3:47-58. Crossref |
||||
| Primack RB (1991), Timber, Tourist and Temples; Conservation and development in the Maya Forest of Belize, Guatemala and Mexico Island Press.Washington. D.C. pp. 459. | ||||
|
Ramesteiner E (1998). The Role of Governments in Forest Certification - A Normative Analysis Based on New Institutional Economics Theories. For. Policy Econ. 4:163-173. Crossref |
||||
|
Wright DH (1991). Correlations between incidences of abundance are expected by chance. J. Biogeograph. 18(14):463-466. Crossref |
||||
| Moore PD, Chapman SB (1986). Methods in Plant Ecology. Blackwell Scientific Publications. 581.5. | ||||
|
Cottam G, Curtis JT (1956). The use of distance measures in phytosociological sampling. Ecology, 37(3):451-460. Crossref |
||||
| Morisita M (1954). Estimation of population density by spacing method. Memoranda of the Faculty of. Science, Kyushu University, Series E (1):187-197. | ||||
|
Newsome RD, Dix RL (1968). The forests of the Cypress Rills, Alberta and Saskatchewan, Canada. The American Midland Naturalist. 80(1):118-185. Crossref |
||||
|
Colwell RK, Coddington JA (1994). Estimating terrestrial biodiversity through extrapolation. Philos. Trans. R. Soc. Lond. B. Biol. Sci. 345:101-118. Crossref |
||||
|
Jost L (2007). Partitioning diversity into independent alpha and beta components. Ecol. 88:2427-2439. Crossref |
||||
|
Tuomisto H (2010). A diversity of beta diversities: straightening up a concept gone awry. Part 1. Defining beta diversity as a function of alpha and gamma diversity. Ecograph. 33:2-22. Crossref |
||||
| Krebs CJ (1999). Ecological methodology. 2nd.ed.A Wesley Longman, NY. USA. | ||||
Copyright © 2024 Author(s) retain the copyright of this article.
This article is published under the terms of the Creative Commons Attribution License 4.0


