ABSTRACT
Stem rust (Puccinia graminis f. sp tritici) poses a major threat to wheat (Triticum aestivum L.) production worldwide. The interaction between wheat and pathogen in presence of favorable environment can cause a complete crop failure. This study was conducted with the objective to identify wheat genotypes with resistance to stem rust with high and stable yield under four environments in Kenya. Forty wheat genotypes were tested in two consecutive growing seasons, using an alpha lattice design with three replications. Host response to stem rust was recorded based on the modified Cobb scale. The disease severity was recorded on scale of 0 to 100%. The results of the coefficient of infection indicated that about 30% of genotypes were moderately resistant. Yield and disease data were subjected to statistical analyses to estimate the stability parameters. The top three genotypes in yield performance were G25, G18 and G29 with 2.07, 1.98 and 1.97 t ha-1 respectively. Considering both stem rust and yield stability G5, G16, G18, G24 and G36 were the best genotypes which could undergo further testing for future release.
Key words: Wheat, stem rust, resistance, stability, genotype × environment interaction.
Wheat (Triticum aestivum. L) is a staple food for 35% of the world's population (FAO, 2012) providing more than 21% of the required calories and 20% of protein. It is a central crop to achieving development in agriculture and the second most important cereal crop after maize in Kenya (Mahagayu et al., 2007). The crop is grown in approximately 150,000 ha of Kenyan land (FAO, 2012), and is basically used for domestic and commercial baking. In spite of these advantages, wheat production is still low due to unstable yield as well as incidences of diseases.
Stem rust, a fungal disease caused by Puccinia graminis f.sp tritici, is one of the most important wheat diseases in Kenya (Mwando et al., 2012). For three decades, the world had been free from stem rust (Singh et al., 2008) until 1999 when a new race Ug99 was identified in Uganda. This race was designated as TTKSK based on the North American rust nomenclature Roelfs, 1985). Since its discovery, Ug99 has spread to other countries of Africa, Yemen and Iran (Singh et al., 2011). Stem rust occurs frequently in warm and moist environments, which are typical of the wheat growing areas in Kenya (Wanyera et al., 2009). The growing of wheat in diverse Kenyan agro-ecological zones throughout the year (Green et al., 1970) creates a significant pool of airborne urediniospores which, coupled with favorable climatic conditions and the presence of host plants, favors rapid buildup of inoculum and occurrence of epidemics (Wanyera et al., 2009). Several resistance genes, for instance Sr31 have been deployed over years. There is however threat due to changing nature of stem rust to more virulent races. The striking virulence combination explains the widespread susceptibility of wheat varieties (Ravi et al., 2011).
Several measures are available for stem rust management, including cultural practices and chemical control. However, they are not fully effective or applicable due to their high cost considering the poor resource wheat farmers. Breeding for resistance is still the most economical and desirable method for controlling stems rust in wheat (Shehab El-Din et al., 1991; Gamalat and El-sawi, 2015). Extensive screening of global wheat varieties for resistance to Ug99 has been undertaken at key sites in Kenya (Singh et al., 2006). The International Centre for Maize and Wheat improvement (CIMMYT), International Centre for Agricultural Research in the Dry Areas (ICARDA) and Kenya Agricultural and Livestock Research Organizations (KALRO) are leading a global rust initiative to characterize the strain, to track its spread and to find new sources of resistance to the disease and incorporate them in new varieties (CIMMYT, 2005). The best long-term strategy to mitigate the threat from stem rust is to identify resistant sources among existing materials, or develop resistant wheat varieties that can adapt to the prevalent environments in countries under high risk, and release them after proper testing (Singh et al., 2006). Given that rainfall and other environmental factors are widely variable across locations and years, Genotype × Environment Interaction (GEI) need to be well characterized for better targeted genotype development and recommendation.
Apart from stem rust, wheat grain yield is highly influenced by production environments and breeders often determine stability of high yielding genotypes across environments before recommending stable genotypes for release (Sharma et al., 2012). Wheat breeders aim to develop new wheat varieties that are resistant to stem rust and consistently have high yield in a range of environments. In order to ensure consistent and high yields, new lines are developed, and tested for their yield performances in different environments (Mehmet and Telat, 2006). Genotype × environment interactions are of major importance, because they provide information about the effect of different environ-ments on genotype performance and have a key role in assessment of stability of the breeding materials (Moldovan et al., 2000). It affects breeding progress because it complicates the demonstration of superiority of any genotype across environments and the selection of superior genotypes (Ebdon and Gauch, 2002).
In addition, GEI reduce progress from selection due to low correlation between phenotypic and genotypic values (Alghamdi, 2004). Thus, understanding the causes of GEI would help in developing genotypes that show satisfactory performances in one to several environments. Various statistical methods have been proposed to determine the stability of new genotype. Among them are multivariate methods which include genotype main effect plus genotype by environment interaction (GGE) and biplot analysis (Yan, 2001) which have been used by Hintsa and Fetien (2013). Thus, the objective of this study was to identify wheat lines that are resistant to stem rust, with high and stable yields across environments.
Experimental sites and genotypes
The experiment was carried out in four environments; Njoro, Kinamba, Olkalau and Eldoret. Njoro lies on 0.33 S, 35.94 E at 2185 m above sea level. It receives 939 mm of rainfall annually and has a maximum temperature of 24.0°C. Kinamba lies on 0.41 N, 36.36 E at 2303 m above sea level with 978 mm annual rainfall and an average temperature of 13.9°C.
Olkalau is on 0.27 N, 36.37 E at 2404 m above sea level with 859 mm annual rainfall and average temperature of 14.2°C. Eldoret lies on 0.51 N, 35.28 E at 2073 m above sea level with annual average rainfall of 1103 mm and average temperatures of 16.6°C. These areas represent key wheat growing regions in Kenyan Rift Valley.
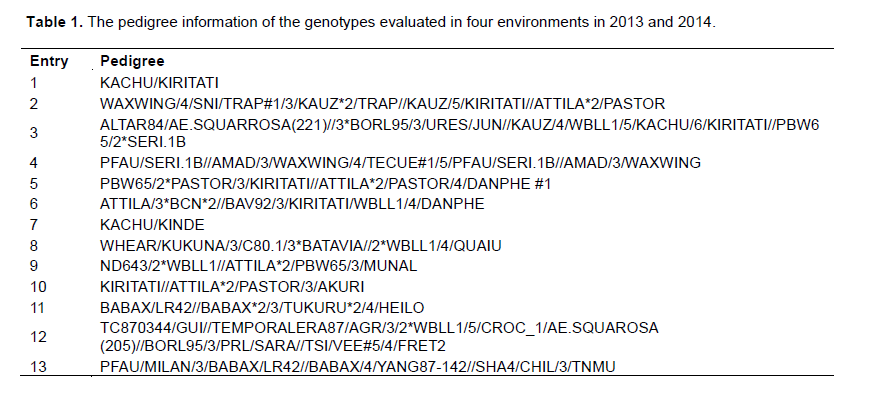
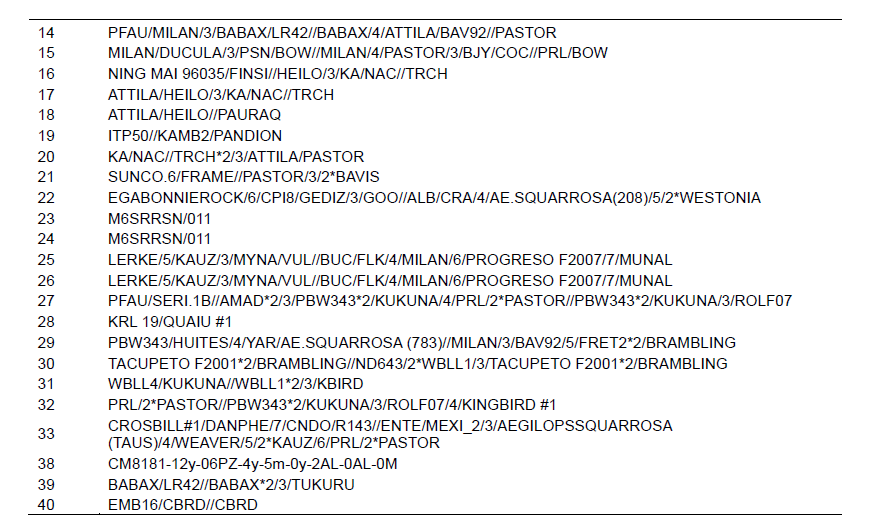
Thirty seven advanced lines from CIMMYT nurseries pre-selected for resistance to stem rust (Ug99) by KALRO wheat breeders were evaluated for reaction to stem rust and yield stability across the environments. These genotypes were selected from the lines screened by the Durable Rust Resistance Wheat project in 2012. The checks used in the trial were Robin, Eagle 10 and NJBWII, which are among the most popular commercial Kenyan varieties. The pedigree of the genotypes is presented in Table 1. The experiment was conducted in the year 2013 and 2014 growing seasons.
Experimental procedure
Forty genotypes were planted using a mechanical planter in an alpha lattice design (5 blocks with 8 units within block) with three replications per environment. Each entry was planted in a plot measuring 1.4 m by 6 m with 20 cm spacing. The plots were separated by path of 30 cm while blocks separated by 2 m path. Diammonium phosphate (DAP 18:46:0) was applied during planting at a rate of 125 kg ha-1 to supply 22.5 kg ha-1 of nitrogen and 25 kg ha-1 of phosphorus. Timely weed control was done using Buctril® MC (Bromoxy niloctanoate and MCPA Ethyl Hexyl Ester) which is a selective herbicide, at the rate of 225 kg ha-1.
Data collection and analysis
Disease (stem rust) severity and yield (t ha-1) data were recorded on all the test environments. Host response to stem rust was recorded based on the modified Cobb scale (Peterson et al., 1948). This scale combines several infection types; resistant (R), moderately resistant (MR), moderately susceptible (MS), combination of MR and MS (M), and susceptible (S). Severity was recorded on 0-100% scale where 0% was considered immunity while 100% was completely susceptible. The severity and field response for stem rust was converted to coefficient of infection (CI) by multiplying the severity with the arbitrary constant value for field response (Stubbs et al., 1986; Roelfs et al., 1992), where R=0.2, MR=0.4, M=0.6, MS=0.8, and S=1.
The plots were harvested and threshed separately. The grain was dried to 12% moisture and the weight converted to tha-1 for analysis. Yield and disease data was analyzed using GenStat computer software (Genstat 15th Edition, 2012). A combined analysis of variance for CI and yield was performed using linear mixed model following restricted maximum likelihood (REML) procedure. Genotypes, replicate and environments were considered fixed while blocks nested in replicates were considered as random for CI while blocks being fixed for yield. The following model was used:

Genotypic variance (Si2) was computed to determine disease stability as suggested by Lin et al. (1886). Genotypes with less than 10 CI values and those with greater than 1.8 t ha-1 were subjected to further analysis to determine their disease and yield stability using GGE. The lsd was calculated in by the following formula:
Lsd=average standard error of difference × t/device degree of freedom.
Where lsd is the least significant difference; the average standard error of difference was obtained from REML output while t is the value obtained from the t-table.
Genotypic response to stem rust
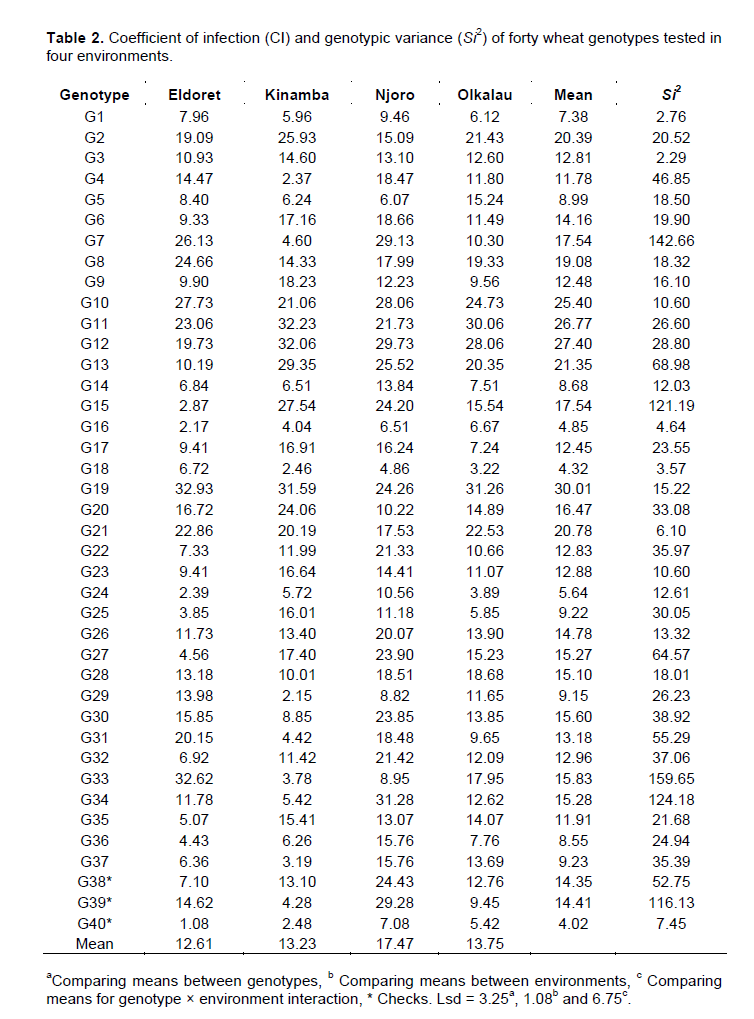
Significant (P<0.001) variation for CI was observed in genotype, environment and genotype × environment interaction (Data not shown). The CI and genotypic variance (Si2) of the forty genotypes are presented in Table 2. The lower the Si2 value the more stable a genotype is (Peterson, 1994). In this study, genotypes with CI values of 20 and below were considered stable for stem rust. Following this stability measure, 42% of the tested genotypes were considered stable for stem rust with genotypes G1, G3, G16 and G18 having the lowest value.
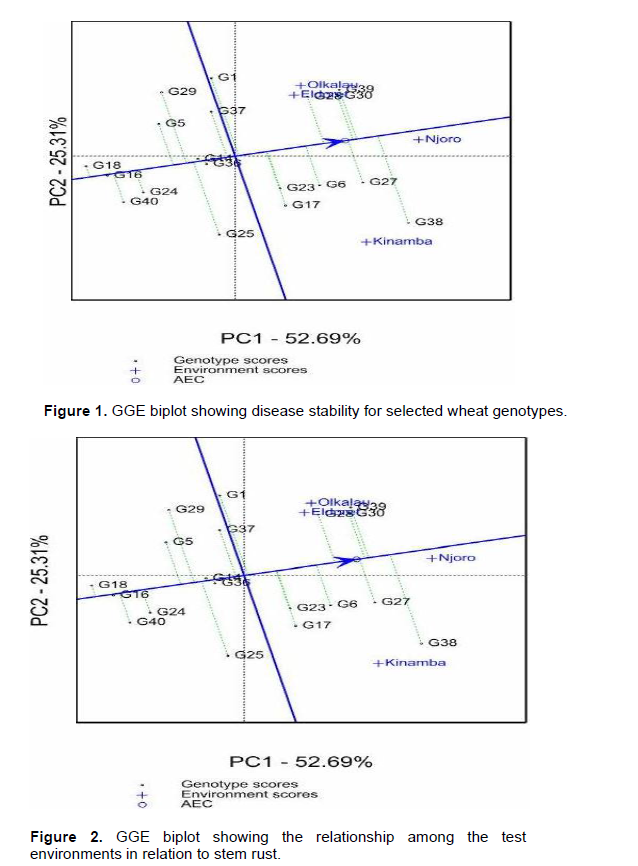
Eldoret (CI=12.61) recorded the lowest disease while Njoro (CI=17.47) had the highest disease scores. There was a slight difference between Kinamba and Olkalau with CI of 13.23 and 13.75 respectively. At 95% confidence level, Eldoret was found to be significantly different from Olkalau but not different from Kinamba. Njoro was significantly different from Eldoret, Kinamba and Olkalau at 95% level of confidence. Figure 1 shows the GGE biplot for the forty genotypes with respect to stem rust. The two PCs explained 78.00% (PC1=52.69% and PC2=25.31%) of the total variation. According to Rubiales et al. (2014), genotypes that appear to the left of the average line are considered the best in terms of resistance. Accordingly, genotypes G18, G16, G40, G24, G5, G29, G14, G36, G25 and G37 were considered resistant to stem rust. Genotypes G18 and G16 were to the extreme left of the average line hence were leading with low infection hence most resistant.
The above resistant genotypes had CI values less than the two checks G38 and G39. However, only G16 and G18 were better than the best check G40. Nonetheless, the three genotypes were not significantly different at 95% confidence interval.
According to GGE biplots, the projection of the genotype to the AEC (average environ-ment coordinate) line signifies stability. Genotypes closer to this line are more stable. Among the resistant genotypes, G18, G16, G24, G14, G36 and G40 had shorter projections hence considered stable for stem rust. The relationship between environments is important for researcher for future selection of trial sites. The vectors connecting each environment to the origin of the biplot gives a clear comparison of the test environments. Eldoret and Olkalau lie on the same projection, an indication of similar environments (Figure 2). Then as well, Njoro was similar to Olkalau, Eldoret and Kinamba. Nonetheless, Kinamba was different from Olkalau and Eldoret which is clearly shown by the obtuse angle between them. Njoro and Kinamba had the largest projections from the biplot origin hence the best environments for testing genotypes for stem rust.
Yield performance across environments
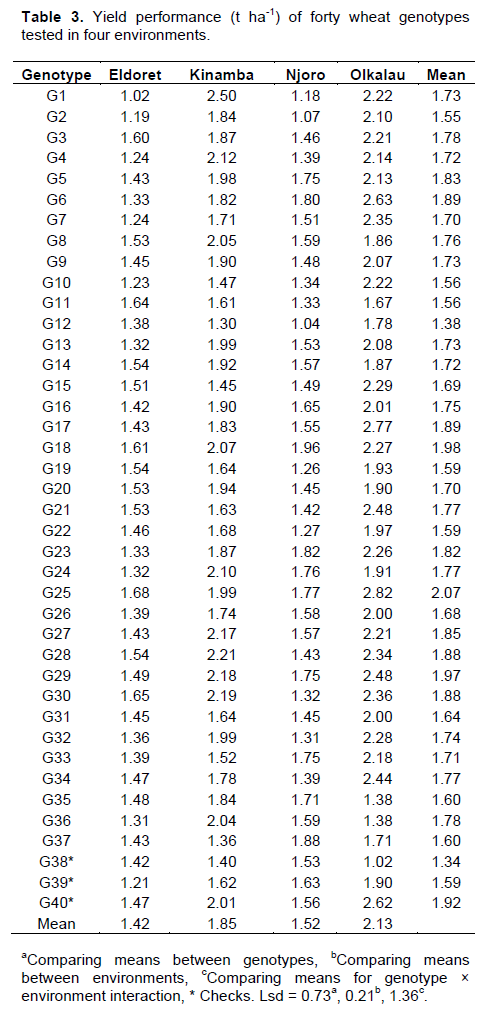
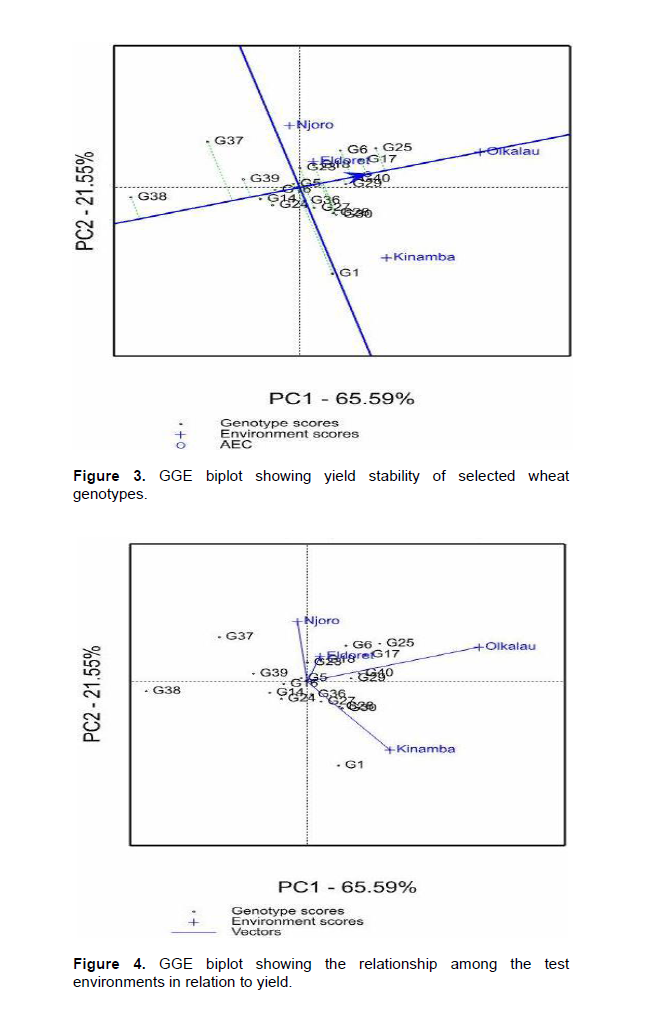
Significant (P<0.001) variation for environment was observed in yield (Data not shown), Olkalau recording the highest yield (Table 3). When the PC analysis for yield was fitted, the two PCs explained 87.14% (PC1 = 65.59% and PC2 = 25.31%) of the total variation. According to GGE biplots, genotypes on the right side of the average line are good average performers while closeness to the AEC represents stability. Genotypes G25, G17, G40, G29, G6, G18, G23, G36, G27, G28 and G30 were on the right side of the average line hence considered above average performers (Figure 3). Genotypes G16 and G5 were near the average line and were considered average performers. Among the genotypes with average and above average performance, G5, G16, G25, G17, G40, G29, G23, and G18 were closest to the stability line hence considered stable for yield. Figure 4 shows the relationship among test environ-ments in respect to yield. This was visualized by the line connecting each environment to the origin of the biplot (Vector). Environments closer to each other are more similar and therefore, Njoro and Eldoret were similar, Eldoret and Olkalau were similar and, Olkalau and Kinamba were similar.
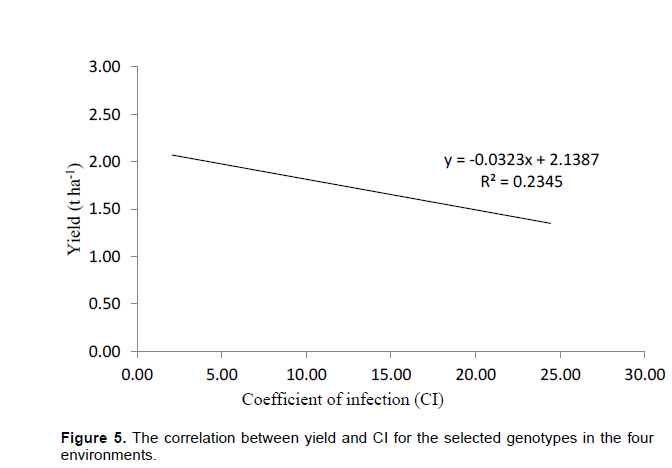
The obtuse angle between Olkalau and Njoro indicate that these environments were different. Kinamba was different from Njoro and Eldoret. Olkalau had the largest projection from the biplot origin. This makes it a good environment for selection of wheat genotypes since it had the largest contribution of GEI. There was a negative relationship between yield and disease (Figure 5).
Wheat production in Kenya is constrained by stem rust which can cause 100% yield loss in susceptible genotypes (Singh et al., 2009). Whereas resistance to the disease has been reported in some genotypes, lack of genotypes that combine sufficient resistance to stem rust and yield stability across environments has posed a new challenge (Singh et al., 2006).
Furthermore, the emergence of new stem rust races is a challenge in breeding and selection for the disease (Wanyera et al., 2006). Although there are recommended fungicide to reduce the disease pressure, these chemicals are not environment friendly and are not economical. Chemical control using fungicides, though an option is not sustainable due to high cost of recommended fungicides and their undesirable effect on environment (Wanyera et al., 2009). Just like yield, response of wheat to stem rust varies in different environments. This is due to the variation in weather conditions which influence the interaction between stem rust and wheat. In the Kenyan context, beside stem rust, variation in yield performance of wheat is known to result from variation in climate conditions.
Forty genotypes including three checks were screened for stem rust. Genotypes with low Si2 values and low mean CI are considered stable (Peterson, 1994). Although several genotypes had low mean infection, their Si2 values were high hence not considered stable. According to Letta and Tilahun (2007), means are not efficient measure of disease stability. As such, in addition to Si2, GGE biplots were used to determine resistance and disease stability. None of the genotypes was completely resistant or immune to stem rust.
This is an indication of the challenge in breeding for resistance to the disease. However, several genotypes were found to have some level of resistance. Results from the current study showed that genotypes with moderate resistance had low infection. Probably these could be having partial resistance which is attributed with additive or epistatic genes (Nzuve et al., 2013).
Partial resistance is known to be non-race specific, highly inheritable and durable (Singh et al., 2009).
GGE biplots was found to be adequate in determining disease stability according to Rubiales et al. (2014). The results of this study revealed that resistant genotypes had relatively high yield performance which explains the effect of the disease on yield. Stem rust causes shriveled grains thereby reducing wheat yield. It was also found that disease stability and yield stability are independent.
Some of the genotypes highly stable for yield, for instance G29, were unstable for disease. Although some of the genotypes were stable for both disease and yield, stability should be done for one trait independently even when studying several traits. The weak correlation between yield and CI indicated that apart from stem rust, there were other factors influencing the wheat yield. Considering stem rust resistance, yield and their stability, G16, G18 and G36 were the best genotypes which could be tested further for future release. Although genotypes F6, F17, F23, F27, F28 and F30 had high yield, their CI was below the average line hence moderately susceptible. These genotypes could probably be tolerant to stem rust and could be considered for further tests for future release.
The disease pressure in each environment influenced the average performance of individual genotypes as well as that of individual environment. There was a slight difference in disease pressure across the four test environments. The high disease pressure at Njoro could be attributed to build up of stem rust inoculum during the international screening of wheat materials which is carried out yearly by Durable Rust Resistant Wheat (DRRW) project. In this study, significance in genotype × environment in CI was an indication of inconsistency in genotype in response to the changing environment as a result of GEI. Similar results were observed by Mohammed (2009).
Stem rust is favored by warm and moist environment which is the characteristic of the test environments (Wanyera et al., 2006). Eldoret and Olkalau were similar for both stem rust and yield. This similarity shows that, while carrying out a multi-location trial, breeders can select one environment to be representative in the case of limited resources. Njoro and Kinamba had large projection from the biplot origin and would therefore be good sites for evaluation of wheat response to stem rust. These results were in agreement with Hintsa and Fatien (2013), in their study on wheat. Olkalau had the largest projection for yield hence highest contribution to GEI.
The field experiments allowed assessment of the response of genotypes to stem rust and their yield performance across environments. The differences observed on genotypes across various environments were an indication of the presence of GEI. The results of this experiment showed some promising genotypes that were stable for stem rust resistance, with high and stable yield. These genotypes, G5, G16, G18, G24 and G36 are potential lines which could be advanced for future release.
There is no conflict of interest between the authors or anybody else.
Thanks to Durable Rust Resistance in Wheat (DRRW) and Eastern Africa Agricultural Productivity Project (EAAPP) who supported this research. Sincere gratitude to CIMMYT for providing the wheat genotypes. Finally, thanks to the Kenya Agricultural and Livestock Research Organization (KALRO), Njoro for providing experimental sites and technical assistance.
REFERENCES
|
Alghamdi S (2004). Yield stability of some soybean across diverse environment. Pak. J. Biol. Sci. 7:2109-2114.
Crossref
|
|
|
|
CIMMYT (2005). Sounding the alarm on the global stem rust: An assessment of race Ug99 in Kenya and Ethiopia and the potential for the impact in neighboring regions and beyond. CIMMYT, Mexico.
|
|
|
|
Ebdon S, Gauch G (2002). Additive main effect and multiplicative interaction analysis of national turfgrass performance trials: Interpretation of genotype 3 environment interaction. Crop Sci. 42:489-496.
Crossref
|
|
|
|
Food and Agriculture Organization (FAO) (2012). Crop prospects and food situation.
View
|
|
|
|
Gamalat A, El-sawi S (2015). Inheritance of stem rust resistance and some yield components in crosses from five Egyptian wheat cultivars. Egypt J. Plant Breed. 19:71-87.
|
|
|
|
Genstat 15th Edition (2012). Computer assisted statistics text books (CAST). VSN international Ltd.
|
|
|
|
Green J, Martens W, Ribeiro O (1970). Epidemiology and specialization of wheat and oat stem rust in Kenya in 1968. Phytopathology 60:309-314.
Crossref
|
|
|
|
Hintsa G, Fetien A (2013). AMMI and GGE biplot analysis of bread wheat genotypes in the Northern part of Ethiopia. J. Plant Breed. Genet. 1:12-18.
|
|
|
|
Letta L, Tilahun A (2007). Stability analysis for selecting stem rust resistance in some Ethiopean durum wheat varieties. Afr. Crop Sci. Soc. 8:853-856.
|
|
|
|
Lin C, Binns M, Lefkovitch P (1986). Stability analysis: Where do we stand? Crop Sci. 26:894-899.
Crossref
|
|
|
|
Mahagayu C, Kamwaga J, Ndiema C, Kamundia W, Gamba P (2007). Wheat productivity constraints associated in the eastern parts of Kenya Timau division. Afr. Crop Sci. Soc. 8:1211-1214.
|
|
|
|
Mehmet A, Telat Y (2006). Adaptability performance of some bread wheat (Triticum aestivum L.) genotypes in the Eastern region of Turkey. Turk. Int. J. Sci. & Technol. 1(2):82-89.
|
|
|
|
Mohammed M (2009). Genotype x Environment Interaction in Bread Wheat in Northern Sudan Using AMMI Analysis. Am. Eurasian J. Agric. Environ. Sci. 6:427-433.
|
|
|
|
Moldovan V, Moldovan M, Kadar R (2000). Item from Romania. S:C:A Agricultural Research Station.
|
|
|
|
Mwando KE, Tabu IM, Otaye OD, Njau PN, Majd E, Mehrabian S, Ismail I, Desa NN, Taupek NN, Kaur J, Kumar V (2012). Malt Quality and Stem Rust Resistance of Selected Barley Genotypes in Kenya. Int. J. Agric. Sci. Res. 2(1):51-63.
|
|
|
|
Nzuve F, Tusiime G, Bhavani S, Njau P, Wanyera R (2013). Studies of the genetics of inheritance of stem rust resistance in bread wheat. Afr. J. Biotechnol. 12:3153-3159.
|
|
|
|
Peterson F, Campbell B, Hannah E (1948). A diagrammatic scale for estimating rust intensity on leaves and stems of cereals. Can. J. Res. 26:496-500.
Crossref
|
|
|
|
Peterson R (1994). Agricultural field experiments: Design and analysis. Marcel Dekker Inc., New York, USA.
|
|
|
|
Ravi S, David H, Huerta-Espino J, Jin Y, Bhavani S, Hurrera-foessel S, Singh P, Singh S, Govindan V (2011). The emergence of Ug99 races of the stem rust fungus is a threat to the world wheat production. Annu. Rev. Phytopathol. 49:465-481.
Crossref
|
|
|
|
Roelfs A (1985). Wheat and rye stem rust. In. The cereal rusts Vol. II; Diseases, distribution, epidemiology, and control. Roelfs, A. P. And Bushnell, W. R. Academic press, Ordlando, 606.
Crossref
|
|
|
|
Roelfs A, Singh P, Saari E (1992). Rust diseases of wheat: Concepts and methods of disease management. CIMMYT, Mexico.
|
|
|
|
Rubiales D, Flores F, Emera A, Kharrat M, Amri M, Rosa-Milna M, Sillero J (2014). Identification and multi-environment validation of resistance against broomerapes (Orobanche crenata and Orobanche foetida) in faba bean (Vicia faba). Field Crops Res. 166:58-65.
Crossref
|
|
|
|
Sharma R, Alexey M, Hans B, Beyhan A, Mesut R, Sanjaya R (2012). Yield stability analysis of winter wheat genotypes targeted to semi-arid environments in the international winter wheat improvement program. Int. J. Plant Breed. 171:53-64.
|
|
|
|
Shehab-El-Din M, Abd-Alla A, El-Fadly G, Abd E, Latif H (1991). Genetics of Triticum aestivum: Puccinia graminis tritici interaction. J. Agric. Res. Tanta Univ. 17:426-437.
|
|
|
|
Singh R, Hodson P, Huerta-Espino J, Jin Y, Njau P, Wanyera R, Herrera-Foessel A, Ward R (2008). Will stem rust destroy the world's wheat crop? Advan. Agron. 98:271-309.
Crossref
|
|
|
|
Singh R, Hodson P, Huerta-Espino J, Jin Y, Bhavani S, Njau P, Herrera-Foessel S, Sing P, Singh S, Govindan V (2011). The emergence of Ug99 races of stem rust fungus is a threat to world wheat production. Annu. Rev. Phytopathol. 49:465-481.
Crossref
|
|
|
|
Singh R, Hodson P, Jin Y, Huerta-Espino J, Kinyua G, Wanyera R, Ward W (2006). Current status, likely migration and strategies to mitigate the threat to wheat production from race Ug99 (TTKS) of stem rust pathogen. CAB reviews: Perspectives in agriculture, veterinary science, nutrition and natural resources. 1(54):1-13.
Crossref
|
|
|
|
Singh R, Huerta-Espino J, Bhavani S, Singh D, Singh K, Herrera-Foessel A, Njau P, Wanyera R, Jin Y (2009). Breeding for minor gene-based resistance to stem rust of wheat. Proceedings of Borlaug Global Rust Initiative, C. D. Obregon, Mexico.
|
|
|
|
Stubbs W, Prescott M, Saari E, Dubin J (1986). Cereal disease methodology manual. Centrointernacinal de maitrigo, (CIMMYT) Mexico, pp. 21-22.
|
|
|
|
Wanyera R, Kinyua G, Jin J, Singh P (2006). The spread of stem rust caused by Puccinia graminis f. sp. Tritici, with virulence on Sr31 in wheat in Eastern Africa. Plant Dis. 90:113.
Crossref
|
|
|
|
Wanyera R, Macharia K, Kilonzo M, Kamundia W (2009). Foliar fungicides to control wheat stem rust, race TTKS (Ug99), in Kenya. Plant Dis. 93:929-932.
Crossref
|
|
|
|
Yan W (2001). GGE biplot: A windows application for graphical analysis of multi-environment trial data and other types of two-way data. Agron. J. 93:1111-1118.
Crossref
|