ABSTRACT
Niger (Guzoita abyssinica) is traditionally very important in the production of oil and as an oilseed crop in Ethiopia. The level of Niger genetic diversity is not studied at molecular level particularly with microsatellite markers which are cost effective, informative and co-dominant. In this study, contrasting samples of 65 Ethiopian Niger germplasm accessions collected from diversified eco-geographic regions were studied with eleven polymorphic EST derived SSR markers. Based on dissimilarity matrix ranging from 0.056 to 0.75, the accessions were grouped into three major and six sub clusters, showing the wealth of genetic diversity for exploitation in future breeding programs. The EST derived SSR markers used in this study also revealed high polymorphic information content (PIC) ranging from 0.2624 to 0.3677, the average being 0.3308 which indicate the usefulness of the primers in Niger germplasm characterization in the future by providing basic breeding information for breeders. The mean number of major allele frequency, gene diversity and heterozygosity using power marker v3.25, showed a value of 0.69, 0.42 and 0.50, respectively. The number of private alleles using GenAlEx 6.41 is 66 alleles with mean of 9 alleles per locus. Thus, utilizing EST SSR marker for diversity study lays basic foundation to understand the genetic distance of crop verities and greatly contributes for further improvement and preservation.
Key words: Alleles, dendrogram, diversity, EST-SSR markers, heterozygosity, locus, Niger and polymorphic information content (PIC).
Niger (Guzoita abyssinica, 2n=30) is belongs to the plant family “Asteraceae”. It is one of the most valuable oil-seed crops in Ethiopia (Getinet and Sharma, 1996). Niger grows in water-logged soils where other oil-seed crops fail, and its cultivation is beneficial for soil conservation and rehabilitation. Scientific community gives a little
attention for Niger and hence Niger is renowned as “neglected and underutilized oil crops” (Getinet and Sharma, 1996). It is widely cultivated in Ethiopia today but has received only limited attention from agricultural scientists and modern breeding techniques have yet to be applied to its improvement. Niger (G. abyssinica) is traditionally very important in the production of oil and as an oilseed crop in Ethiopia, less systematically in India, Africa and Asia (Getinet and Sharma, 1996). It has been grown in Ethiopia since at least the 2nd millennium BC and probably much earlier (Boardman, 1999; Boardman, 2000). It is indigenous to Ethiopia, a center of its diversity.
In most places, Niger is widely cultivated in an intercropping condition which may render an opportunity for morphological variation. Consequently, it hides from improvement using modern breeding techniques. Any crop improvement program starts with identification of variability among the genotypes. Niger has been characterized morphologically (Bulcha et al., 2005). It was hypothesized that the domesticated crop, G. abyssinica probably evolved from the wild type Guizotia scabra ssp. Schimperi (Petros et al., 2007). Besides the morphological based characterization of Niger, studies using molecular markers such as ISSR (Petros et al., 2007) and RAPD (Geleta et al., 2007) have also been conducted to assess the genetic diversity existing among Niger accessions. According to (Dempewolf et al., 2010a) identification of SSR from EST library of G. abyssinica was in place. This led to the first insight in developing SSR, which was not known before.
Microsatellites (SSRs) are quite many in eukaryote genomes. They offer supreme information about the genetic diversity of the crop; they are hypervariable, locus specific, multi-allelic, co-dominant, rapid, low cost and independent from environmental factors (Pejio et al., 1998). They have wide genetic application in the study of genetic diversity, genotyping, finding connections among collections emanating from diverse geographical origin and gene pool, and identifying core collections to launch easy management and effective utilization of genetic resources (Alemayehu, 2007).
This study was, therefore, aimed at studying the genetic diversity of 65 Niger accessions using 11 EST-SSR markers to improve its production and productivity, and conservation as assessing genetic diversity of Niger at molecular level is a paramount importance for future breeding program. Previous efforts to characterize diversity of Niger populations using anonymous genomic SSR markers was not informative to reveal the levels of intra- and inter-population diversity (Geleta et al., 2007) and the major disadvantage associated with the anonymous genomic SSR is the high cost of development and time- consuming process. In the present study, 11 EST derived SSR markers were used to trace the genetic diversity and evolutionary patterns of 65 Niger accessions to reach at better understanding of the origin.
The detailed material and methods used to evaluate the genetic diversity of 65 Niger germplasms using 11 EST- SSR markers is clearly described as follows.
Germplasm collection/study area
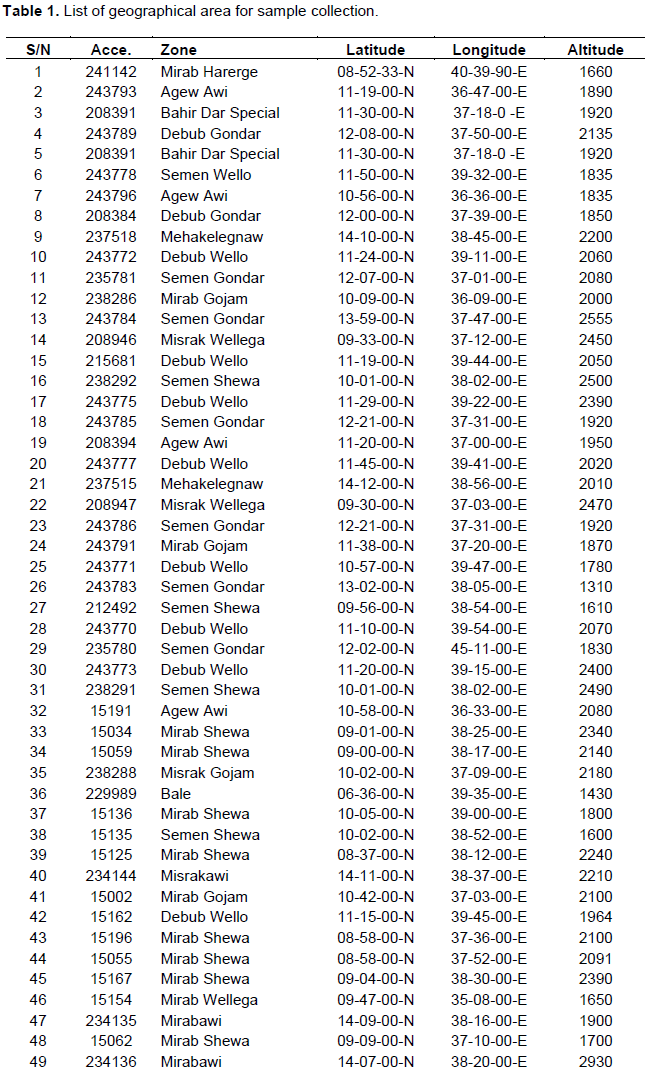
In this study, 65 accessions of Niger were collected from different agro ecologies of Ethiopia (Table 1). The places of sampling area were systematically selected. Most of the samples were collected from North Gondar, South Gondar, West Gojjam, East Gojjam, West Showa, and North showa, South Wello, Bale, West Wellega, East Wellga, Awi and West Harergia (Table 1).
Selection of markers
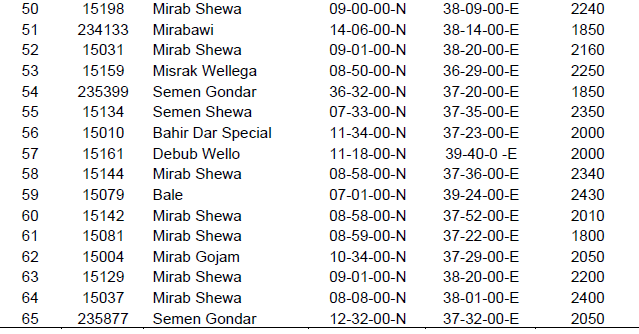
There is inconsistency between the choice of markers in terms of cost, time, inheritance of marker, quantity of DNA required, technical labour and degrees of polymorphism, precision of genetic distance estimates and the statistical power of tests. The SSRs were still the preferable markers in assessing genetic diversity, genetic mapping and marker-assisted selection of important traits as SSRs are multi-allelic, easily detectable by PCR, abundantly distributed in genome and codominantly inherited (Gupta and Varshney, 2000).Thus, the certain number and length of SSRs were probable to reflect the evolutionary history in particular species and its relatives. EST derived SSRs markers have higher rate of transferability across related species and genera than anonymous genomic SSRs (Guo et al., 2006, Mishra et al., 2012), and hence are preferable for phylogenetic studies and QTL mapping. In this study, based on the above mentioned promising property SSR markers are selected. Markers that are used in this study are described below in the table.
Sample preparation
The collected planting materials were planted in green house for two weeks. Fresh young leaf materials from three to five leaf numbers were selected to extract DNA. The leaves that were targeted for DNA extraction were taken from young seedlings. The leaf sample was taken from the most upper part, which are active regions undergoing mitosis. The dirty materials and fungal infection or any other contaminant on the surface of leaf materials were removed using 70% ethanol.
DNA extraction
After ten days of collection, DNA was extracted from each fresh and dried leaf following modified CTAB method (Doyle and Doyle, 1990). The dried leaf was grinded using Geno Grinder (MM-200, Retsch). Based on the procedures, cells were fractionated and DNA was extracted. The presence of the genetic material was checked via running the mixes of 5 µL of gDNA and 3 µL of 6X loading dye containing gel red in 0.8% of agarose gel for 30 min at 100 volt, in 1xTAE buffer using Junyl electrophoresis apparatus. The presence and absence of extracted genomic DNA was checked via transilluminator (3uv bench top, M-20 transilluminator). The quantity and purity of DNA was confirmed by Nano drop spectrophotometer (ND-8000, Thermoscitnific). Following the amount purified, proper concentration of DNA was determined for further use. DNA was stored in the refrigerator till the next use. The DNA extracted from different samples was coded carefully. DNA sample from the autonomous organelles, nuclear and chloroplast was included for the case of tracing evolutionary origin of G. abyssinica.
Polymerase chain reaction and acquisition of markers
The primers (Table 2) were obtained from published article (Dempewolf et al., 2010a). It was ordered and purchased from companies. The SSR region was amplified using proper PCR condition and reaction mixtures by using master cycler (Pros, eppendorf). A proper 96 well PCR plate with an allowed reaction mixture was in place. The touchdown PCR techniques were used with a program of 94°C for 4 min, 94°C for 45 s, 60 to 55°C for 1 min and 72°C for 1 min 30 s running for 9 cycle, and 94°C for 45 s, 55°C for 1 min and 72°C for 1 min 30 s running for 26 cycle and eventually, 72°C for 5 min final extension was suggested for all EST-SSR markers used (Cubry et al., 2008). The total reaction volume and volume for each reactant including the volume of Taq DNA Polymerase was determined following the most promising PCR reaction mixture that used in article (Cubry et al., 2008).
Gel electrophoresis
Gel electrophoresis was used to analyze the presence and absence of genomic DNA and PCR product. Simple sequence repeat were analyzed using polyacrylamid gel electrophoresis, to compute the size and number of alleles (Wang et al., 2009). The accuracy of the PCR experiment was checked and yield of the PCR product was properly quantified in 1.2% agarose gel. 40% of (29:1, acrylamid: bis acrylamid solution) Polyacrylamid gel was used to count alleles and see patterns of SSR in the genome of the entire varieties using vertical electrophoresis apparatus (Cleaver, CS500 volt).
Scoring and data analysis
The clear and visible amplified PCR products were scored for presence (1) and absence (0) and the data were subjected to analysis using diverse tools of statistics and bioinformatics softwares. Dendrogram was constructed using Darwin 6.0 software (Perrier et al., 2003; 2006). A dendrogram was constructed using neighbour joining (NJ) as implemented in the same software. The number of alleles, gene diversity and polymorphism information content (PIC) were calculated using Power Marker V3.25 (Liu and Muse, 2005), Observed heterozygosity was calculated using Arlequin V3.1, and the number of private alleles were calculated using GenAlEx 6.41.
SSR amplified product and PIC statistics
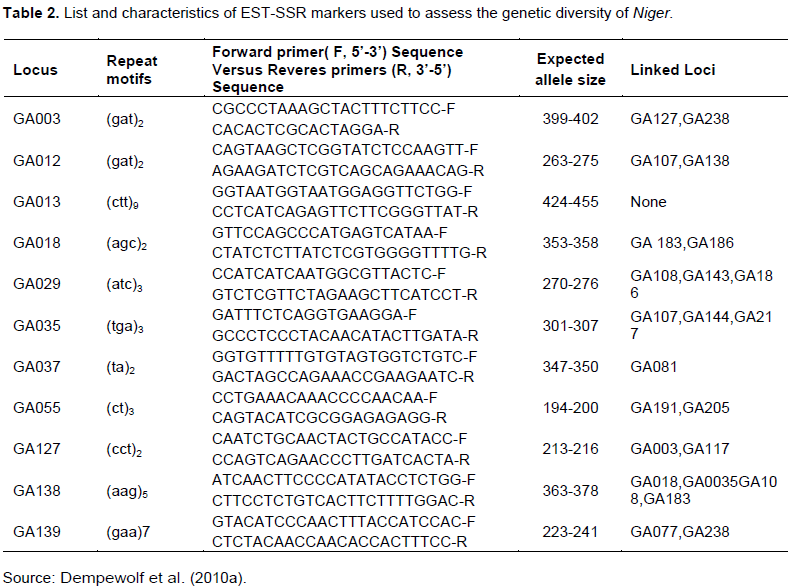
In this study, the genetic relationships of 65 Niger germplasm were analyzed using 11 Expressed Sequence Tagged derived Simple Sequence Repeats (EST-SSRs) markers. 19 SSR markers were obtained from published articles (Dempewolf et al., 2010a), and screened to select 11 of them which were polymorphic with understandable and solid band for statistics on 65 germplasm, and produced 66 total numbers of alleles with an average of 9 alleles per locus. Locus GA037 showed greater allele frequency, gene diversity and PIC. Whereas GA003 showed lower allele frequency, gene diversity, heterozygosity and PIC (see Table 3).
Dendrogram constructed using EST-SSR markers
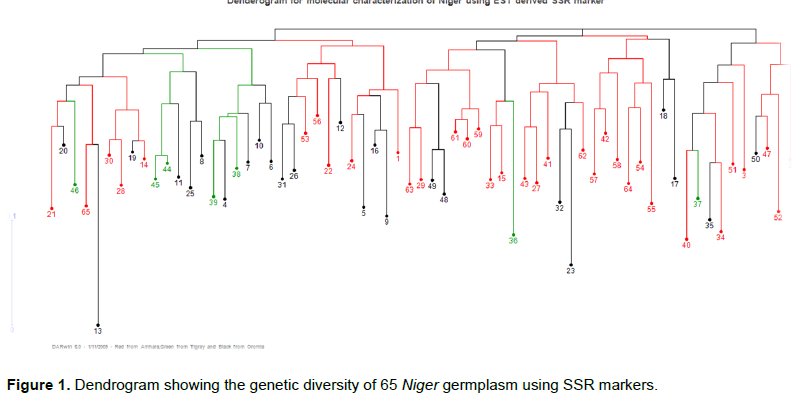
Based on the dissimilarity matrix the entire accessions were grouped in to three major clusters and six sub clusters. The minimum and maximum dissimilarity values for the analyzed accessions were 0.056 and 0.75 respectively. The phylogenetic tree constructed using Jaccard coefficients (Figure 1). The dendrogram was shown with three different colours (Red= for accessions collected from Tigray regions, Green= from Amhara and Black= from oromia region) which is used to indicate the location of major Niger growing area in Ethiopia.
All the 11 EST-SSR markers used in this study are polymorphic (100%). Gupta et al. (2003) identified only 55% of 20 EST-SSR markers used were polymorphic among 52 wheat accessions. Eujayl et al. (2002) reported a lower level of polymorphism (25%) when 42 EST-SSR markers screened against 64 durum wheat germplasm lines. This clearly indicates that the percentage of polymorphism depends on number and nature of the material used under analysis.
In the present study, data analysis was carried out with 11 EST-SSR markers by following SMM model which assumes that each mutation (insertion and deletion) creates a new allele. A similar pattern of allele scoring was observed with genomic SSR markers in Folkertsma et al. (2005).
In total, 11 EST-SSR markers produced 66 alleles with an average of 9 alleles per locus (Table 3). This is the maximum number of alleles per markers reported using EST-SSR markers in any cereals to date. In case of tall fescue grass, an average of 2.78 alleles/marker were reported (Saha et al., 2004), while 1.8 alleles/marker in bread wheat (Gupta et al., 2003) with 20 EST-SSRs, 4.5 alleles/markers in durum wheat with 42 EST-SSRs (Eujayl et al., 2002), 3 alleles/markers in 54 barley accessions using 38 EST-SSR markers (Thiel et al., 2003), and 4.6 alleles/marker in Crotalaria species (Wang et al., 2006). Compared to results obtained with neutral genomic SSRs, the average number of alleles per marker detected in this study is comparable to that found in limited size core collection (Caniato et al., 2007), or on geographically limited studies (e.g. Barnaud et al., 2007; Deu et al., 2008), but is lowest than found on the same material (Billot et al., 2013).
The PIC values of markers can provide an estimate of discrimination power in a set of accessions by taking not only the number of alleles, but also the relative frequencies of each allele (Smith et al., 2000). The average PIC value of EST-SSR markers (0.3308) was a bit higher in this references set of Niger in comparison with previous studies using EST-SSR markers for genetic diversity analysis in other crops, e.g., 0.443 in bread wheat (Gupta et al., 2003), 0.45 in barley (Thiel et al., 2003). However, the average PIC value was lower compared to PIC values of genomic SSR markers in sorghum [0.62 in both studies of Agrama and Tuinsta (2003), and Caniato et al. (2007)]. However, this is higher than PIC value reported by Folkertsma et al. (2005) using 100 guinea race accessions and 21 genomic SSR markers and Ali et al. (2008) using 72 sorghum accessions with 41 SSR markers. This is on par with PIC (0.54) reported by Wang et al. (2009) in a study involving 96 sweet sorghum lines and 95 SSRs. High PIC values and large number of alleles per markers can also be attributed to the nature of the Niger materials that is studied. SSR markers containing dinucleotide repeats produced more alleles and hence, greater PIC values (Table 3). These results were in harmony with previous studies by Smith et al. (2000), Agrama and Tuinstra (2003), Casa et al. (2005), and Deu et al. (2008).
Genetic diversity analysis with proper genotyping using EST-SSR marker will help the breeders to mine trait-specific alleles and facilitate an effective way of identifying the gene for different agronomic traits. The present study showed the presence of considerable variations among Niger genotypes. The presence of this considerable variation among Niger genotypes has great promise as parents to obtain promising heterotic expression in F1’s and may create considerable variability in the segregating populations.
The authors have not declared any conflict of interests.
REFERENCES
|
Agrama HA, Tuinstra MR (2003). Phylogenetic diversity and relationships among sorghum accessions using SSRs and RAPDs. Afr J. Biotechnol. 10:334-340.
Crossref
|
|
|
|
Alemayehu TN (2007). Genetic diversity of Coffea arabica L. collections using Microsatellite (SSRs) Markers. EJAST 1(1): 63-79.
|
|
|
|
|
Ali ML, Rajewski JF, Baenziger PS, Gill KS, Eskridge KM, Dweikat L (2008). Assessment of genetic diversity and relationship among a collection US sweet sorghum germplasm by SSR markers. Mol. Breed. 21:497-509.
Crossref
|
|
|
|
|
Barnaud A, Deu M, Garine E, McKey D, Joly H (2007). Local genetic diversity of sorghum in a village in northern Cameroon: structure and dynamics of landraces. Theor. Appl. Genet. 114:237-248.
Crossref
|
|
|
|
|
Billot C, Ramu P, Bouchet S, Chantereau J, Deu M, Gardes L, Noyer JL, Rami JF, Rivallan R, Li Y, Lu P, Wang T, Folkertsma RT, Arnaud E, Upadhyaya HD, Glaszmann JC, Hash CT (2013). Massive sorghum collection genotyped with SSR markers to enhance use of global genetic resources. PLoS ONE. 8:e59714.
Crossref
|
|
|
|
|
Boardman SJ (1999). The agricultural foundation of the Aksumite empire, Ethiopia. Plants and People in Africa. Recent Archaeobotanical Evidence. New York. Plenum Publishing Corp. Pp.137-147.
Crossref
|
|
|
|
|
Boardman SJ (2000). Archaeobotany. Archaeology at Aksum, Ethiopia, 1993-7. (ed D.W. Phillipson) . The British Institute in Eastern Africa and the Society of Antiquaries, London. Pp. 363-368.
|
|
|
|
|
Bulcha W, Misteru T, Nigussie A, Adunga W, Million F, Adefris T (2005). Review of Genetics and Breeding Research on Noug (Guzoita abyssinic (L.f) Cass.) undertaken over the period of 1999 – 2003. Holetta Agricultural Research Center. Highland Oil Crops Improvement Program.
|
|
|
|
|
Caniato FF, Guimaraes CT, Schaffert RE, Alves VM, Kochian LV, Borem A, Klein PE, Magalhaes JV (2007). Genetic diversity for aluminum tolerance in sorghum. Theor. Appl. Genet. 114(5):863-876.
Crossref
|
|
|
|
|
Casa AM, Mitchell SE, Hamblin MT, Sun H, Bowers JE, Paterson AH, Aquadro CF, Kresovich S (2005). Diversity and selection in sorghum: simultaneous analyses using simple sequence repeats. Theor. Appl. Genet. 111(1):23-30.
Crossref
|
|
|
|
|
Cubry P, Musoli P, Legnate H, Pot D, De Bellis F, Poncet V, Anthony F, Dufour M, Leroy T (2008). Diversity in coffee assessed with SSR markers: structure of the genus Coffea and perspectives for breeding. Genome 51:50-63.
Crossref
|
|
|
|
|
Dempewolf H, Nolan C, Katherin L, Mulatu G, Mickale S, ZHAO L, Megan L, Endeshaw B, Johansen M, Quantin C, Lorin H (2010a). Establishing genomic tool and resource for guzotia abyssinica (L.f) Cass, the development of a library of expressed sequence tags, microsatellite loci, and the sequencing of its chloroplast genome. Mol. Ecol. Resour. 10:1046-1058.
Crossref
|
|
|
|
|
Deu M, Sagnard F, Chantereau J, Calatayud C, Hérault D, Mariac C, Pham J-L, Vigouroux Y, Kapran I, Traore PS, Mamadou A, Gerard B, Ndjeunga J, Bezancon G (2008). Niger-wide assessment of in situ sorghum genetic diversity with microsatellite markers. Theor. Appl. Genet. 116:903-913.
Crossref
|
|
|
|
|
Doyle JJ, Doyle JL (1990). Isolation of plant DNA from fresh tissue. Focus 12:13-15.
|
|
|
|
|
Eujayl I, Sorrells ME, Wolters P, Baum M, Powell W (2002). Isolation of EST-derived microsatellite markers for genotyping the A and B genomes of wheat. Theor. Appl. Genet. 104:399-407.
Crossref
|
|
|
|
|
Folkertsma RT, Rattunde FH, Chandra S, Soma Raju W, Hash CT (2005). The pattern of genetic diversity of Guinea-race Sorghum bicolor (L.) Moench landraces as revealed with SSR markers. Theor. Appl. Genet. 111:399-409.
Crossref
|
|
|
|
|
Geleta M, Bryngelsson T, Bekele E, Dagne K (2007). Genetic diversity of Guizoita abyssinica (L.f.) Cass. (Asteraceae) from Ethiopia as revealed by random amplified polymorphic DNA (RAPD). Genet. Resour. Crop Evol. 54:601-614.
Crossref
|
|
|
|
|
Getinet A, Sharma SM (1996). Niger (Guizotia abyssinica) (L.f.) Cass. In: Promoting the Conservation and Use of Underutilized and Neglected Crops. Rome, Italy. IPGRI. 5:59.
|
|
|
|
|
Guo W, Wang W, Zhou BA, Zhang T (2006). Cross-species transferability of Garboreum-derived EST-SSRs in the diploid species of Gossypium. Theor. Appl. Genet. 112:1573-1581.
Crossref
|
|
|
|
|
Gupta PK, Rustgi S, Sharma S, Singh R, Kumar N, Balyan HS (2003). Transferable EST -SSR markers for the study of polymorphism and genetic diversity in bread wheat. Mol. Gen. Genomics 270:315-323.
Crossref
|
|
|
|
|
Gupta PK, Varshney R (2000). The development and use of microsatellite markers for genetic analysis and plant breeding with emphasis on bread wheat. Euphytica 113(3):163-185.
Crossref
|
|
|
|
|
Liu K, Muse SV (2005). PowerMarker: Integrated analysis environment for genetic markers data. Bioinformatics 21(9):2128-2129
Crossref
|
|
|
|
|
Mishra RK, Gangadhar BH, Nookaraju A, Kumar S, Park SW (2012). Development of EST-derived SSR markers in pea (Pisum sativum) and their potential utility for genetic mapping and transferability. Plant Breed. 131:118-124.
Crossref
|
|
|
|
|
Pejio I, Ajmone-Marsan P, Morgante M, Kozumplic V, Castiglione P, Taramino G, Motto M (1998). Comparative analysis of genetic similarity among maize inbred lines detected by RFLPs, RAPDs, SSRs and AFLPs. Theor. Appl. Genet. 97:1248-1255.
Crossref
|
|
|
|
|
Perrier X, Flori A, Bonnot F (2003). Methods for data analysis. In. Hamon P, Seguin M, Perrier X, Glaszmann JC (eds) Genetic diversity of cultivated tropical plants. Science Publishers, Montpellier, Inc. and CIRAD. Pp. 31-63.
|
|
|
|
|
Perrier X, Jacquemoud-Collet JP (2006). DARwin software. http://darwin.cirad.fr/darwin
|
|
|
|
|
Petros Y, Merker A, Zeleke H (2007). Analyses of genetic diversity of Guizotia abyssinica from Ethiopia using inter simple sequence repeat markers. Hereditas 144:18-24.
Crossref
|
|
|
|
|
Saha MC, Mian MAR, Eujayl I, Zwonitzer JC, Wang L, May GD (2004). Tall fescue EST -SSR markers with transferability across several grass species. Theor. Appl. Genet. 109:783-791.
Crossref
|
|
|
|
|
Smith JSC, Kresovich S, Hopkins MS, Mitchell SE, Dean RE, Woodman WL, Lee M, Porter K (2000). Genetic diversity among elite sorghum inbred lines assessed with simple sequence repeats. Aust. J. Crop Sci. 40:226-232.
Crossref
|
|
|
|
|
Thiel T, Michalek W, Varshney RK, Graner A (2003). Exploiting EST databases for the development and characterization of gene-derived SSR-markers in barley (Hordeum vulgare L.). Theor. Appl. Genet. 106:411-422.
Crossref
|
|
|
|
|
Wang ML, Mosjidis JA, Morris JB, Dean RE, Jenkins TM, Paderson GA (2006). Genetic diversity oftalaria germplasm assessed through phylogenetic analysis of EST-SSR markers. Genome. 49:707-715.
Crossref
|
|
|
|
|
Wang ML, Zhu C, Barkley NA, Chen Z, Erpelding JE, Murray SC, Tuinstra MR, Tesso T, Pederson GA, Yu J (2009). Genetic diversity and population structure analysis of accessions in the US historic sweet sorghum collection. Theor. Appl. Genet. 120:13-23.
Crossref
|
|
|
|
|
Wang X, Rinehart TA, Wadl PA, Spiers JM, Hadziabdic D, Windham MT, Trigiano RN (2009). A new electrophoresis technique to separate microsatellite alleles. Afr. J. Biotechnol. 8(11):2432-2436.
|
|