ABSTRACT
Efforts to boost maize productivity can be undertaken through systematic management of heterosis. Combining ability test is a critical step towards identifying a heterotic group of new parental lines. Different heterotic grouping methods has been used by different researchers. Among these, SCA and hybrid mean, hybrid index, combined use of amplified fragment length polymorphism (AFLP), SSR markers and heterotic group’s specific and general combining ability (HSGCA) are the major grouping methods. This study aimed to (i) assign maize inbred lines into heterotic groups and (ii) compare efficiency of different grouping methods. An experiment with 21 maize inbred lines crossed to two testers with known heterotic groups was conducted in 2017. The hybrid and parent experiments were tested together and laid out side by side. This study identified good heterotic grouping procedure. The breeding efficiency of HSGCA was higher by 31.6, 11.0 and 9.6% over joint SCA and hybrid mean, SCA and hybrid index methods, respectively. While the hybrid index method was more efficient than joint SCA and hybrid mean and SCA by 20.1 and 1.3% respectively, the SCA grouping method was more efficient than joint SCA and hybrid mean method by 18.5%. The highest (37%) and lowest (28.1%) breeding efficiency value were scored by HSGCA and hybrid index heterotic grouping method, respectively. Based on the result, HSGCA grouping method was more efficient. The variable heterotic grouping of the 21 newly developed QPM lines in this study indicated that different heterotic grouping methods have different efficiency in grouping the germplasms.
Key words: General combing ability, heterotic-group, inter-group, specific combing ability, within-group, Zea mays.
Maize (Zea mays L.) is one of the five major cereals (also including wheat, teff, barley and sorghum) in terms of production volume, area coverage and household consumption (Tsedeke et al., 2015; CSA and WB, 2015).
It accounts for 27% of Ethiopia’s total cereal production and is critical for food security for smallholder subsistence farmers. Roughly nine million smallholders account for 95% of the national maize production (Tsedeke et al., 2015; CSA, 2012). Over the last two decades, the maize sector in Ethiopia has experienced an unprecedented transformation. Maize yields have doubled from around 1.6 t/ha in 1990 to more than 3.7 t/ha in recent years, the highest level in sub-Saharan Africa after South Africa (FAOSTAT, 2019). Important causes for the increased productivity include increased availability and use of modern inputs (e.g., modern varieties and fertilizer), better extension services and increasing demand (Tsedeke et al., 2015). Despite the recent progress in productivity, yield levels in Ethiopia are still very low relative to what they could be. According to the Global Yield Gap Atlas (GYGA, 2019), the water-limited yield potential of maize in Ethiopia is on average 12.5 t/ha, implying that farmers realize only around 30% of that potential.
Hybrid maize is one of the prosperous technology that farmers adopted in Ethiopia due to its promising yield. Therefore, continuous yield increase should be guaranteed through exploitation of heterosis and hybrid vigor to meet future needs of the country. The classification of inbreeds into heterotic groups is a precondition to facilitate the exploitation of heterosis in maize (Bidhendi et al., 2012). Melchinger and Gumber (1998) defined a heterotic group “as a group of related or unrelated genotypes from the same or different populations, which display similar combining ability (CA) and heterotic response when crossed with genotypes from other genetically distinct germplasm groups. By comparison, the term heterotic pattern refers to a specific pair of two heterotic groups, which express high heterosis and consequently high hybrid performance in their cross.
The concept of heterotic groups and patterns is fundamental to hybrid breeding theory and practice (Reif et al., 2005). Grouping germplasm into divergent heterotic groups is advantageous due to (i) a higher mean heterosis and hybrid performance and (ii) a reduced specific combining ability (SCA) variance and a lower ratio of SCA to general combining ability (GCA) variance (Reif et al., 2005). Heterotic groups and patterns among inbred lines helps to identify the best hybrid combinations using information obtained from field crosses, mainly using diallel or topcrosses to testers (Han et al., 1991; Terron et al., 1997), pedigree information, morphological traits, and molecular markers (Smith and Smith, 1992). The magnitude of the combining ability effect plays a crucial role in heterotic grouping, since it indicates the types of gene action as a preliminary indicator of heterotic expression (Singode et al., 2017). Maximum heterosis can be exploited if the breeding program uses inbred lines having significant positive GCA effect for grain yield and classified in opposing heterotic group (Annor et al., 2020). Phenotypic descriptors and molecular markers have been widely used in crop diversity studies to measure genetic distances (Darvishzadeh, 2012). Molecular markers are a powerful tool to delimit heterotic groups and to assign inbred lines into existing heterotic groups (Abebe et al., 2004).
One of the major purposes of maize hybrid breeding is to develop hybrids with high grain yield (Fan et al., 2009). To develop a high yielding maize hybrid, a breeder usually makes hundreds of crosses among selected inbred lines. The better chance of obtaining superior hybrids can be achieved when the breeder decides to make crosses between lines from different maize heterotic groups. However, because of unlimited genetic combinations between any two inbred lines, no heterotic group classification method can be perfect. Thus, a good heterotic group classification method can be defined as one whose classified heterotic groups allow inter-heterotic group crosses to produce more superior hybrids than the within-group crosses (Fan et al., 2009). Heterotic patterns have a strong impact in crop improvement because they predetermine to a large extent the type of germplasm used in a hybrid breeding program over a long period of time (Melchinger and Gumber, 1998). The objectives of the study were to classify the tropical inbred lines into heterotic groups and to compare the efficiency of heterotic grouping methods.
Study sites
The study was conducted at three locations in the highland agroecology of Ethiopia including; Ambo, Arsi-Negele (transition highland) and Kulumsa Agriculture Research Centers in the 2017 main cropping season (May to December).
Experimental materials
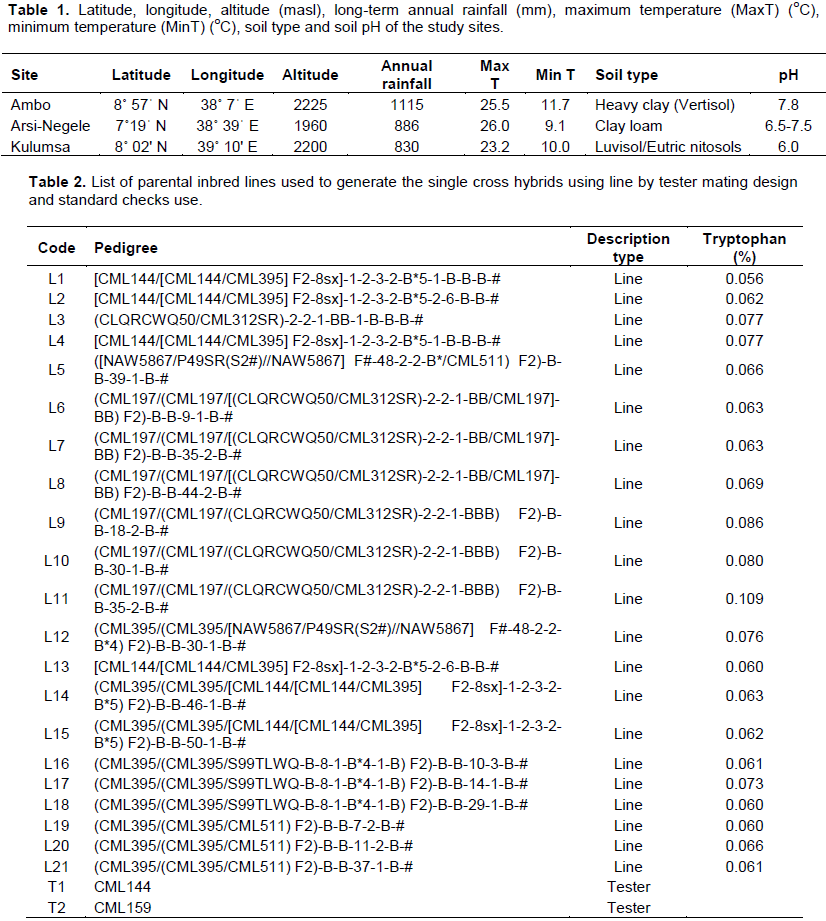
Twenty-one highland QPM inbred lines, named hereafter as lines (L1 to L21) and two elite QPM inbred lines (CML159 and CML144), named hereafter as testers (T1 and T2, respectively), constituted the basic genetic materials of this experiment (Table 1). From the 21 inbred lines and the two testers, 42 F1 hybrids were generated at Ambo Highland Maize Breeding Program (AHMBP).
Two separate but interrelated experiments were laid side by side during the main cropping season (May to December) of 2017 GC as described below. In the 1st experiment, the 42 F1 hybrids along with three standard checks: one QPM (AMH852Q) and two CM (Jibat and AMH853), designated as hybrid check, were tested. In the 2nd experiment, the 21 inbred lines (L1 to L21), the two testers (T1 and T2) and one elite CM highland inbred line (FS67), designated inbred parent check, were tested at two locations (Ambo and Arsi-Negele Agricultural Research Centers) presented in Table 2.
Heterotic group’s specific and general combining ability effects and their use in classifying maize lines into known heterotic groups
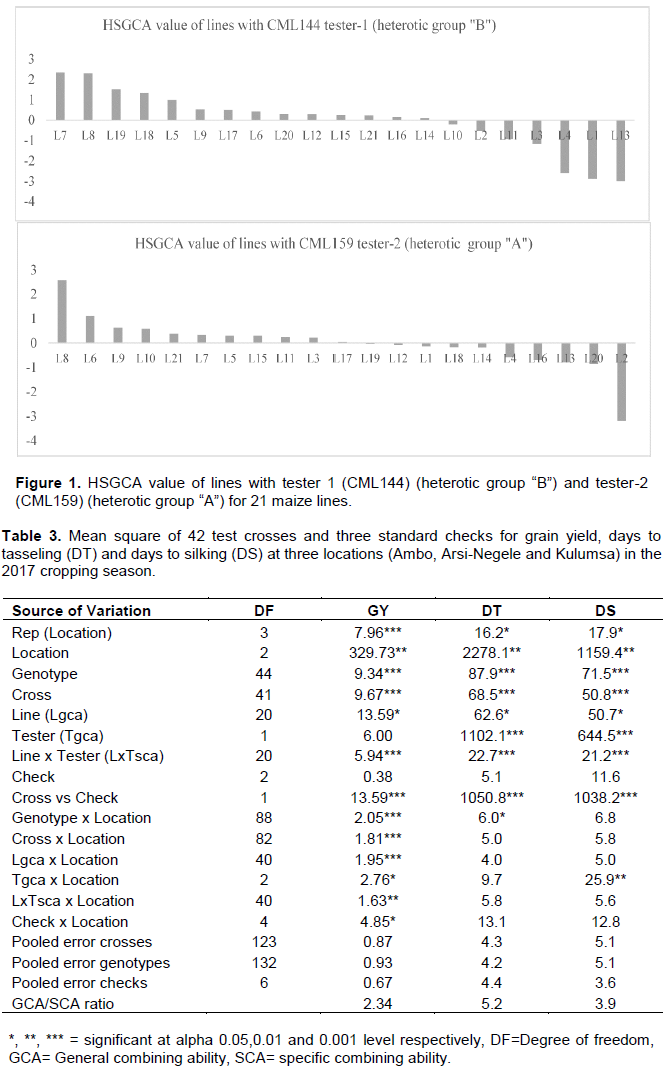
The calculated HSGCA effects for grain yield of the 21 maize inbred lines and the two testers (CML144 and CML159) are shown in Figure 1. The following procedure was followed for classifying 21 maize lines into the known maize heterotic groups using the HSGCA method according to Fan et al. (2009).
Step 1: We placed all inbred lines with negative HSGCA effects into the same heterotic groups as their tester. The inbred lines were classified into the two known heterotic groups (Table 3). At this step, a line might be assigned to more than one heterotic group.
Step 2: If an inbred line was assigned to more than one heterotic group in Step 1, we kept the line in the heterotic group if its HSGCA had the smallest value (or largest negative value) and removed it from other heterotic groups.
Step 3: If a line had a positive HSGCA effect with all representative testers, we were cautious to assign that line to any heterotic group because the line might belong to a heterotic group different from the two testers.
Data analysis
The data obtained from field measurements was organized and analyzed using SAS statistical package (SAS, 2002). Analysis was conducted using the model of RCBD after confirming the non-significance of block effect, which implied there was uniformity among blocks. Accordingly, to test for the presence of variation among crosses and inbred lines for the trait in question; variance and CA analysis was carried out for individual locations and across locations. The details of data analysis are subsequently presented.
Analysis of variance
Individual and across locations data were subjected to analysis of variance using PROC GLM procedure in SAS software version 9.0 (SAS, 2002). In the analysis, treatments were used as a fixed factor, while replications and locations were considered as random factors. This was specified using RANDOM statement in the PROC GLM model. Combined analysis was done for traits that showed significant difference at each location analysis after testing homogeneity of error variances. In combined analysis, the variation among genotypes, crosses and checks effects were tested against their respective interaction effect with location. Interaction effect of each source of variation by location was tested as per the expected mean square (MS) of error estimate.
Combining ability analysis
The LxT analysis was done for traits that showed statistically significant differences for L, T and LxT in each environment and across environment using the adjusted means based on the method described by Kempthorne (1957). GCA and SCA effects for grain yield and other traits were calculated using a LxT model.
The F-test of MS due to lines and testers was tested against LxT interaction but crosses were compared against MS due to error for individual locations (Singh and Chaudhry, 1985). In case of across locations analysis, the F-test for the main effects such as crosses, lines, testers and LxT interaction MS were tested against their respective interaction with the location. The MS attributable to all the interactions with the locations were tested against pooled error MS. The effect of location was tested by replication within environment as an error term. Significances of GCA and SCA effects of the lines and crosses were determined by t-test using standard errors of GCA and SCA effects. The main effects due to LxT were considered as GCA effects while, LxT interaction effects were represented as the SCA. The estimate of GCA effect considered for traits showed significant MS by both line GCA and tester GCA or only by line GCA. Similarly, SCA effect presented the traits which had significant SCA MS.
I = (MH-MT)/MT
where, I= hybrid index, MH= mean value of each hybrid, MT=mean value of each tester. Lines with hybrid index values less than 1.05 are classified under the same group.
Heterotic group’s specific and general combining ability computation
SCA = Cross mean (Xij) – Line mean (X.j) – Tester mean (Xi.) + Overall mean (X..)
GCA = Line mean (X.j) – Overall mean (X..).
HSGCA = Cross mean X ij – Tester mean (Xi.) = GCA + SCA.
where X ij is the mean yield of the cross between ith tester and jth line, Xj. is the mean yield of the ith tester and X.j is the mean yield of jth line.
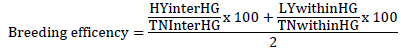
The best classification method was identified based on the breeding efficiency proposed by Fan et al. (2009) and modified by Badu-Apraku et al. (2016). The equation for estimating the breeding efficiency is as shown below according to Annor et al. (2020):
Where, HYinterHG = number of high yielding inter-heterotic group hybrids, TNinterHG = total number of inter-heterotic group hybrids, LYwithinHG = number of low yielding within-heterotic group hybrids, TNwithinHG = total number of within heterotic group hybrids.
To compare the breeding efficiency, first all hybrids were divided into three groups on the basis of their grain yields according to Fan et al. (2009).
Analysis of variance for grain yield combined across three locations showed that mean square due to locations, crosses, and crosses × locations were significant at P = 0.001 (Table 3). SCA, SCA × location and GCA x location were also significant at the 0.01 level and GCA at the 0.05 level. The significant difference for cross by location interaction suggested that the crosses behaved differently at the three locations, presupposing selection of specific hybrids that performed best in each of the three locations. Regarding phenological traits, mean square due to genotype and crosses were highly significant (p < 0.01) for days to tasseling (DT) and days to silking (DS). All the mean squares of the partition of cross or both GCA and SCA had significant differences for DT and DS. The relative importance of GCA to SCA ratio was greater than one for all the three traits (Table 3). The higher value of GCA to SCA ratio, which is a greater unit for GY, DT and DS, indicated that additive type of a gene action gave a higher contribution to genetic variation than non-additive type of the gene action (Table 3). Similarly, Berhanu (2009), and Arifin et al. (2018) reported significant variation among genotypes, GCA, SCA and the higher contribution of additive gene action for the genetic variation for grain yield. In contrast, Abiy (2017) reported no significant variation among genotypes for GCA and SCA but this other reported the higher proportion of GCA over for the research conducted at Ambo.
Heterotic grouping of inbred lines
Heterotic grouping designates broad classes in maize with diverse genetic base that are complimentary and result in expression of heterosis after crossing (Melchinger and Gumber, 1998). A hybrid breeding program needs to organize its germplasm into heterotic groups (Hallauer et al., 1998; Reif et al., 2007) to ease its operation and increase genetic gain. In heterotic grouping, if lines expressed negative SCA effect when crossed to a certain tester, this implies that both the line and the tester belong to the same heterotic group, while the reverse is true when the SCA effect is positive (Vasal et al., 1992).
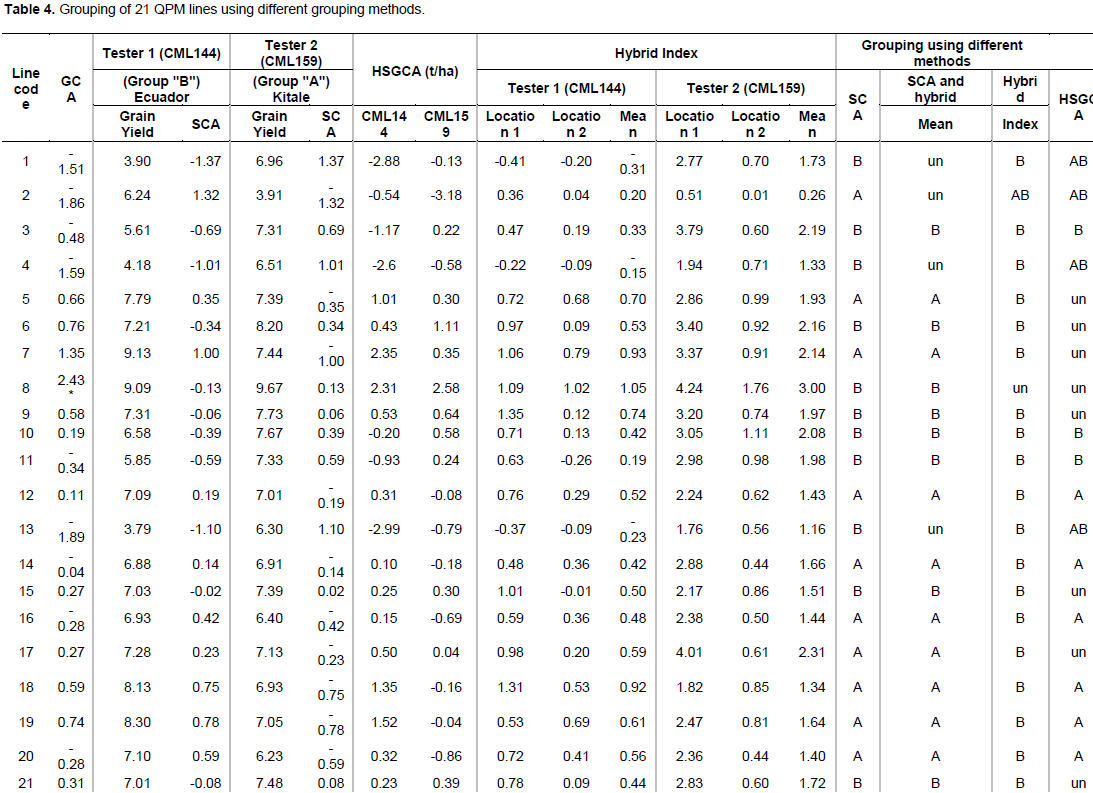
In this study, 21 newly generated QPM lines (with unknown heterotic group) were crossed to two testers of known heterotic group: tester 1 (CML144, HGB) and tester 2 (CML159, HGA). To group the 21 lines, four methods were followed: SCA, SCA and hybrid mean jointly and hybrid index. The heterotic grouping of 21 inbred lines using different methods is presented in Table 4.
a) Using SCA: 11 of the 21 inbred line, viz. L1, L3, L4, L6, L8, L9, L10, L11, L13, L15 and L21 that showed positive SCA effect when crossed with CML159 (HGA) and negative SCA effect with CML144 (HGB) were classified as group “HGB” (Table 4). The other 10 inbred lines viz. L2, L5, L7, L12, L14, L16, L17, L18, L19 and L20 that showed positive SCA effect when crossed with CML144 (HGB) and exhibited negative SCA effect when crossed with CML159 (HGB) were classified under “HGA” (Table 4).
b) Based on SCA and hybrid mean jointly, nine lines were grouped under “HGA”, eight lines under group “HGB” and the other four lines (L1, L2, L4 and L13) grouped as unknown.
c) Using hybrid index method, 19 lines were grouped under “HGB” and one line (L2) was grouped under both heterotic groups (“HGA” and “HGB”). The hybrid index method, fail to indicate the HG of L8 because its hybrid index value was higher than 1.05%. But it was grouped under “HGB” using its SCA and hybrid mean.
Considering the intersection of the four different methods (SCA, SCA and hybrid mean jointly, hybrid index and HSGCA), three lines (L3, L10 and L11) were grouped under “HGB”. Considering four methods intersections, no lines were grouped under “HGA”. Under three methods intersections (SCA, SCA and hybrid mean jointly, and hybrid index), four lines (L6, L9, L15 and L21) were grouped under “HGB”. Taking the intersection of three grouping methods: SCA, joint SCA and hybrid mean and HSGCA methods, L12, L14, L16, L18, L19 and L20 fall under “HGA”. L1, L4, L13 fall under “HGB” using SCA and hybrid index. L8 was grouped under “HGB” using SCA and joint SCA and hybrid mean methods and unknown under hybrid index and HSGCA methods. Considering two methods SCA and SCA and hybrid mean, three lines (L5, L7 and L17) fall under “HGA”. L2 was grouped under “HGAB) based on hybrid index and HSGCA grouping methods. Using HSGCA grouping method, six lines (L12, L14, L16, L18, L19 and L20) were grouped under “HGA”, three lines (L3, L10 and L11) under HGB, four lines (l1, L2, L4 and L13) under “HGAB” and for eight lines (L5, L6, L7, L8, L9, L15, L17 and L21) the group was unknown. The three lines (L3, L10 and L11), which are grouped under “HGB” by HSGCA, also fall under the same heterotic group “HGB” across the four heterotic grouping methods, consistently. This can be settled by applying molecular marker based heterotic grouping. Previous studies by Legesse et al. (2009) using population, Gudeta et al. (2015) and Abiy (2017) using inbred line testers, separated inbred lines into different heterotic groups based on grain yield SCA values only. However, this study used different methods to reduce the chance of misclassification of lines into heterotic groups. The failure of the three heterotic grouping methods except SCA methods to classify some inbred lines into the heterotic groups of the two testers, suggested that those inbred lines belonged to heterotic groups other than those of the two testers.
Comparison of heterotic grouping methods for combined analysis
Methodically, the heterotic grouping following SCA vs SCA and hybrid mean matches very well. These two methods deviated only in grouping four of the lines. The four heterotic grouping methods were matched only three times for 21 lines. However, divergence of grouping following the hybrid index-based method diverted much from the grouping done following SCA, joint SCA and hybrid mean and HSGCA methods. Hybrid index-based grouping matched with SCA based method only in ten of the 21 times, implying that the classification following these two methods agrees only by about 48%. The disagreement between the hybrid index-based and the joint SCA and hybrid mean method was wider; only in seven of the 21 times (33%) their grouping matched each other. The hybrid index method also showed the widest disagreement with HSGCA only in 3 of 21 times (14%) for their grouping with each other. The hybrid index-based method matched with the other two methods only in identifying lines grouped under HGB. The hybrid index-based method nearly grouped 19 of the new QPM lines under HGB. The four heterotic grouping methods were matched only with the grouping of three of the lines from 21 lines. The three grouping methods (SCA, joint SCA and hybrid mean and HSGCA) were matched in grouping nine of 21 lines (43%); whereas, the other three methods in combination (SCA, joint SCA and hybrid mean and hybrid index) were matched in 6 of 21 lines (27%). The four lines of which their grouping was unknown by the SCA and hybrid index methods was shifted to HGAB by the HSGCA method. In the reverse, the seven lines which were assigned into their heterotic grouping even if their grouping was varied across each method (SCA, SCA and hybrid method, hybrid index) were not grouped under any heterotic grouping by the HSGCA method. This implies that using a single method might not be enough to group the maize lines clearly into their heterotic groups. Generally, based on the heterotic grouping result, HSGCA method appears to be the more stringent than the other methods, and is followed by the hybrid index method. This implied that the task of heterotic grouping of materials should be supported by other supported methods like molecular methods to get a clear classification of the germplasms.

Comparison of heterotic grouping methods across sites using the breeding efficiency
Under four heterotic grouping methods, the number of crosses considered for grain yield comparison was varied. The crosses which were from lines heterotically undefined were not considered under each heterotic grouping methods. Based on this, the total of 42, 32, 38 and 18 crosses were divided into three grain yield variation ranges under each of the heterotic grouping methods, respectively. Under each of the heterotic grouping methods, five crosses for each SCA and joint SCA and hybrid mean methods, one cross for hybrid index and two crosses under HSGCA method had high mean grain yield > 8 t/ha, which are assigned to grain yield Group 1. Under lowest yielding (grain yield Group 3) with mean grain yield < 6.9 t/ha, 12, 4, 24, and 5 crosseshad lowest grain yield for each grouping method in respective order; and the rest of 24, 22, 10 and 11 hybrids were assigned to grain yield Group 2 (grain yield in between 6.9 and 8.0 t/ha) (Table 5). Crosses were later divided into inter-group and within-group crosses based on the heterotic groups of the lines used in a cross formation. Inter-group crosses are the crosses formed using lines from two different heterotic groups and the within-group crosses are the crosses between lines within the same heterotic group.
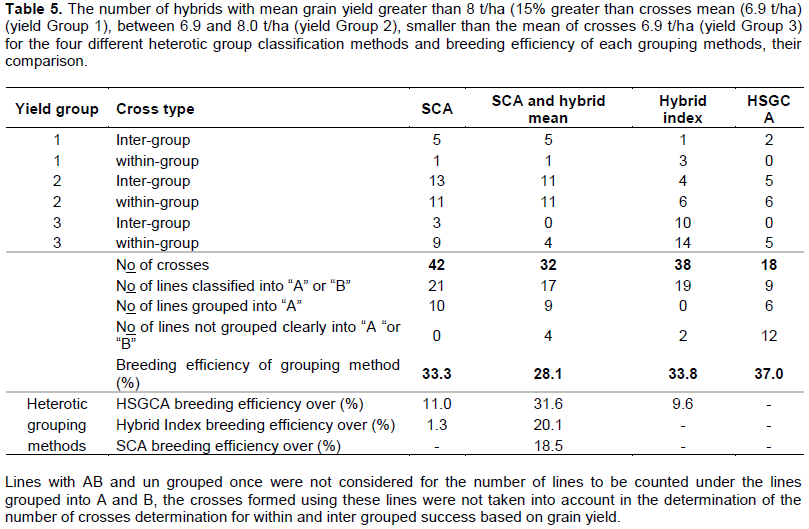
Based on the breeding efficiency definition, the SCA method identified five, SCA and hybrid mean gave five, hybrid index one and HSGCA two high yielding hybrids from a total of 21, 16, 15, and 7 inter-group crosses under each grouping method. Under each of the methods, the high top yielders among the hybrids were: SCA 23.8, joint SCA and hybrid mean 31.3, hybrid index 6.7% and HSGCA 28.6% (Table 5). The breeding efficiency value of each method was 33.3, 28.1, 33.8 and 37.0% for SCA, joint SCA and hybrid mean, hybrid index and HSGCA, respectively (Table 5). HSGCA was more efficient than the other three heterotic grouping methods (Table 5). Joint SCA and hybrid mean method was less efficient than the HSGCA, Hybrid index and SCA methods by 31.6, 20.1 and 18.5% in breeding efficiency, respectively. The highest efficient method (HSGCA) showed higher breeding efficiency by 31.6, 11.0 and 9.6% over joint SCA and hybrid mean, SCA and hybrid index methods, respectively. This highest efficiency of HSGCA heterotic grouping method compared with the other methods indicated that the HSGCA method was more effective in classifying the inbred lines into heterotic groups. This result confirmed that the HSGCA method was the most reliable for grouping the parental lines into heterotic groups for the development of productive and stable hybrids as well as synthetic varieties. Hence, crossing inbred lines from opposite HSGCA heterotic groups could result in more productive hybrids. Furthermore, the inbred lines classified into the same heterotic group by the HSGCA method could be recombined to form heterotic populations that could be improved through recurrent selection for extraction of inbred lines and synthetics for use in breeding programs in the tropics. The result of this study was in line with the findings of Fan et al. (2009), Badu-Apraku et al. (2015),
Amegbor et al. (2017) and Annor et al. (2020) who reported that the HSGCA was the most efficient for classifying inbred lines under drought, low N and optimal environments. The classification of the inbred lines into four heterotic groups based on the most efficient method, HSGCA indicated that there was a broad genetic diversity among the set of inbred lines used in the present study.
In order to maximize heterosis during hybrid variety development using these inbred lines, one parent should come from the inbred lines belonging to heterotic group “HGB” while the other parent should be from the inbred lines belonging to heterotic group “HGA”. In the case of the development of synthetic varieties, inbred lines belonging to the same heterotic group should be used.
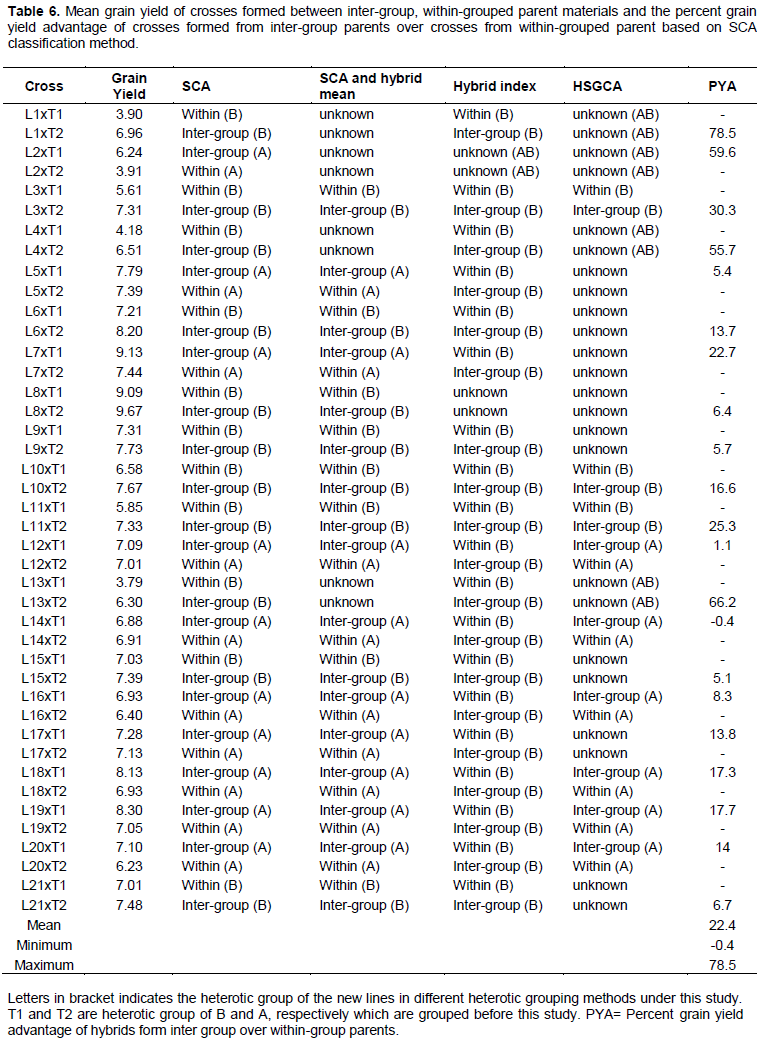
The overall percent grain yield of crosses from inter-grouped parents exceeded the mean performance of crosses from within-grouped parents by 22.4%. The highest and lowest percent grain yield from inter-grouped parents was 78.5 and -0.4, respectively. These highest and lowest values were obtained through the advantage of crossing L1xT2 over L1xT1 and L14xT1 over L14xT2, respectively (Table 6). The theory of higher chance to obtain higher grain yield from crosses formed from parents under different heterotic groups may not always be true because under this study, we found crosses formed from parents of inter-grouped lines provided inferior performance compared with crosses formed from within-group parents. For example, L14xT1 from inter-grouped parents had lower mean grain yield performance (less by 0.4%) compared with the same line (L14) crossed with T2 (crosses from within-group parents). This line (L14) showed a negative GCA effect with the value of -0.04) (Table 4) and T1 which is grouped under the opposite side of the line (L14) based on the three grouping methods had negative GCA effect with value of 0.15. However, T2 had positive GCA effect with the value of 0.15. Hence, the inferior performance of the hybrid (L14 x T1) developed from the within-grouped parents might be due to the negative GCA effect, which showed both the line and tester found in different heterotic group. This result suggested that, to obtain high heterosis, combining germplasms from different heterotic groups might not guarantee that it will yield a high performance. Therefore, breeders should be careful while choosing germplasms and making crosses. Based on this, the breeders need to see the GCA effect of each germplasm in addition to their heterotic group while developing hybrids, OPV and other maize varieties. Annor et al. (2020) also suggested that to get the maximum heterosis, the breeding program should use inbred lines with significant positive GCA effects for grain yield; and should be classified into opposing heterotic groups by using the HSGCA method for hybrid or synthetic variety development. There was also a cross formed from within-group parents that had relative nearest performance with a cross formed from inter-group parents. For example, L8xT1 and L12xT2, which were the hybrids developed from the parents found under the within-group category. These two lines (L8 and L12) were grouped under the tester group (within) based on two heterotic grouping methods (SCA and joint SCA and hybrid mean) for both lines. L12 was grouped within the group of “HGA” by the HSGCA method; but line (L8) was unknown based on the other two methods (Hybrid index and HSGCA). The L12 group assignment was unknown by the hybrid index method. This hybrid (L8xT1) from within-grouped parents showed relative inferior yield less by 6.4% compared with grain yield obtained from the other hybrid (L8 x T2) developed from the same female parent, which is crossed with the other tester found in the other heterotic group (Table 6). The L12xT2 cross had lower mean grain yield by 1.1% developed from within-grouped parents compared with the cross (L12 x T1) developed using inter-grouped parents. The relative smaller difference of the cross performance from hybrids developed using inter-grouped parents (L12 x T1) compared to the hybrid (L12 x T2) formed using within grouped parents might be due to the negative GCA effect of tester (T1). It may be that the higher grain yield obtained from L8 crossed with both testers in different groups was due to the highest GCA effect (2.43) showed by the new line (L8) compared with other new lines and testers tested under this study (Table 4). This indicates that, there is the possibility to obtain higher grain yield from crosses formed using within grouped materials. Similarly, Fan et al. (2009) reported the existence of the chance to obtain crosses with high grain yield from within grouped maize in bred lines. On the other hand, this result tells us researchers should see the other way to use these materials for OPV varieties development because development of OPV is also the other good option to exploit germplasm in a different way. This is because OPVs are also helpful for the final users in reducing the seed cost that would incur if hybrid seed was purchased.
From 21 crosses developed from inter-grouped parents, 12 of them were obtained from 12 lines each crossed with T2. From these 12 crosses, seven of them were developed from lines and tester (T2) which had positive GCA effect; whereas, the remaining five crosses were from five lines with negative GCA effect with T2. From the other 21 crosses developed from inter-grouped parents, nine of them were developed from nine lines each crossed with tester 1 (T1). From nine crosses developed from lines with T1, four lines had negative GCA effect and the other five crosses were from lines with positive GCA effect crossed with T1, which had negative GCA.
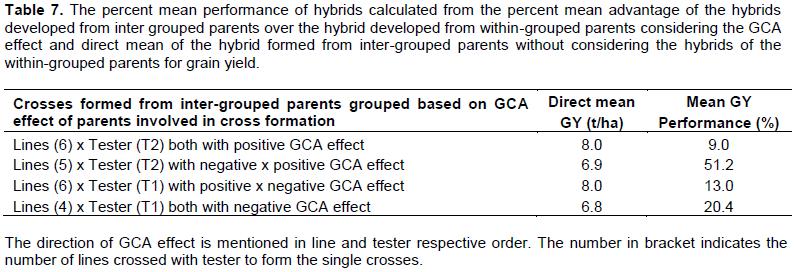
The highest mean performance of hybrids (51.2%) was obtained from inter-grouped parents over the hybrids from within-grouped parents, which were developed from the female parents (lines) with negative GCA effect crossed with male (tester with positive GCA effect) (Table 7). The second higher value (20.4%) was obtained from the hybrids developed from female and male parents both with negative GCA effect. Even if the percent mean grain yield advantage obtained from lines which had positive, the GCA effect crossed with tester with positive GCA effect was the lowest (9%) (Table 7), the mean performance of the hybrids was higher while considering individual hybrids for grain yield (Table 6). This might be due to the relative higher GCA effect in magnitude from the female parent side in addition to its GCA effect to the positive side.
Regarding the direct grain yield comparison considering only the hybrids formed from the inter-grouped parents, or excluding the 21 hybrids developed using within-grouped parents, six hybrids formed from six lines which had positive GCA effect crossed with the tester (T2) with positive GCA having mean grain yield of 8.0 t/ha. The other set of six hybrids developed from six lines with positive GCA, each crossed with a tester (T1) with negative GCA, also had 8.0 t/ha performance. The other five hybrids generated by crossing five lines, which showed negative GCA effect and tester (T2) with positive GCA effect, had a mean value of 6.9 t/ha for GY. The other set of four hybrids formed from lines, which had a negative GCA effect crossed with tester (T1) with negative GCA, had the mean GY value of 6.8 t/ha. This direct mean GY performance comparison results of hybrids, formed from inter-grouped parents, showed that to get hybrids with good performance for grain yield, either both male and female parents of the hybrid should have positive significant GCA effect or at least the female parent should be with positive GCA effect. In addition, to realize this result, the basic criterion of both parents should come from different heterotic pool. Because as we see the hybrids formed from six lines with positive GCA and one tester with positive GCA showed equal GY (8.0t/ha), compared with the other set of six hybrids developed from lines which had positive GCA effect crossed with the other one tester with negative GCA effect (Table 7). Similarly, Annor et al. (2020) also suggested that, to get the hybrids or OPV with high heterosis for grain yield, the breeding program should use inbred lines, which had significant positive GCA effect; and the lines should be classified under an opposing heterotic group. This conclusion is supported by the lower mean GY performance obtained from hybrids developed from female parents, which had negative GCA effect when crossed with male parents with negative and positive GCA effects (Table 7).
For grouping new maize germplasms into a heterotic group, it is advisable to consider a range of different methods. The variable heterotic grouping of the 21 newly developed QPM lines in this study indicated that different heterotic methods have different efficiencies of grouping the germplasms. The HSGCA method was more efficient than the other heterotic grouping methods. The Joint SCA and hybrid mean method was less efficient, followed by the SCA method. The HSGCA method looks more seriously limited than the others, because a high number of the lines failed under unknown conditions for the heterotic grouping. To make the grouping of materials clearer, use of molecular methods might be more productive. Moreover, classifying new germplasms into their group based on the data collected from field experiments imply that integrated use of different methods can increase the chances of separating the germplasm into their heterotic group. The result of this study indicated the possibility of getting a high yielding hybrid by crossing parents from the same heterotic group. In so doing, the breeder should take care to make crosses and evaluate them. The breeder should also consider the parents, which are found within the same group, and had good GCA for OPV variety development. The results indicate that, to get the high grain yield from hybrids or any other kinds of varieties, considering the GCA effect for each germplasm has a significant role in addition to their heterotic group. The direct mean GY performance comparison for hybrids developed from inter-grouped parents showed that, to get hybrids with good performance, either both male and female parents of the hybrid should have positive GCA; or at least the female parent should be with positive GCA effect in addition to fulfilling the basic criterion of both parents coming from a different heterotic pool, mostly.
The authors have not declared any conflict of interests.
The authors appreciate CIMMYT for granting the scholarship through the Nutritious Maize for Ethiopia (NuME) Project, the Ethiopian Institute of Agricultural Research (EIAR) for financial support to conduct the research. Great thanks go to Hawassa University for hosting the study. The staffs of Ambo and Kulumsa Research Centers Maize Research Sections are highly acknowledged for their support in field trial management and data collection, especially for their facilitation and contribution in hybrid formation and seed preparation. The author is deeply indebted to Mr. Demewoz Negera, staff of CIMMYT-Ethiopia, for the kind technical support throughout the study period as well as Mr. Antenane Abeiy, NuME project manager, for facilitating administrative issues related to the scholarship and to all CIMMYT-Ethiopia staff. Thanks to all EIAR- Hawassa maize research staff for their support in field trial management and data collection.
ETHICS APPROVAL AND CONSENT TO PARTICIPATE
The researchers have obtained permission from funding institution CIMMYT and EIAR. Accordingly, the information under this article had been developed in collaboration with CIMMYT, Ethiopian Institute of Agriculture Research investigators and university instructor.
Funding was provided by CIMMYT and Ethiopian Institute of Agriculture Research (EIAR). The lion share of funding was by CIMMYT.
REFERENCES
|
Abebe M, Melake-Berhan A, Ingelbrecht ACI, Adepoju A (2004). Grouping of tropical mid-altitude maize inbred lines on the basis of yield data and molecular markers. Theoretical and Applied Genetics 108:1582-1590.
Crossref
|
|
|
|
Abiy BG (2017). Combining ability of highland maize (Zea Mays L.) inbred lines using line x tester analysis. M.Sc. Thesis. College of Agriculture, Hawassa university, Hawassa, Ethiopia 121p.
|
|
|
|
|
Amegbor IK, Badu-Apraku B, Annor B (2017). Combining ability and heterotic patterns of extra-early maturing white maize inbreds with genes from Zeadiploperennis under multiple environments. Euphytica 213(1):1-16.
Crossref
|
|
|
|
|
Annor B, Badu-Apraku B, Nyadanu D, Akromah R, Fakorede MAB (2020). Identifying heterotic groups and testers for hybrid development in early maturing yellow maize (Zea mays) for sub-Saharan Africa. Plant Breeding 139(4):708-716.
Crossref
|
|
|
|
|
Arifin NS, Nugraha AA, Waluyo B, Ardiarini NR, Azrai M (2018). Grouping in heterotic pool of maize inbred lines based on numerical and graphical analysis of combining ability. SABRAO Journal of Breeding and Genetics 50(4):475-493.
|
|
|
|
|
Badu-Apraku B, Fakorede MAB, Gedil M, Talabi AO, Annor B, Oyekunle M, Aderounmu M (2015). Heterotic responses among crosses of IITA and CIMMYT early white maize inbred lines under multiple stress environments. Euphytica 206(1):245-262.
Crossref
|
|
|
|
|
Badu-Apraku B, Fakorede MAB, Talabi AO, Oyekunle M, Akaogu IC, Akinwale RO, Aderounmu M (2016). Gene action and heterotic groups of early white quality protein maize inbreeds under multiple stress environments. Crop Science 56:183-199.
Crossref
|
|
|
|
|
Berhanu T (2009). Heterosis and combining ability for yield, yield related parameters and stover quality traits for food-feed in maize (Zea Mays L.) adapted to the mid-altitude agroecology of Ethiopia. MSc.Thesis. Haramaya University, Haramaya. Ethiopia P 199.
|
|
|
|
|
Bidhendi MZ, Choukan R, Darvish F, Mostafavi K, Majidi E (2012). Classifying of Maize Inbred Lines into Heterotic Groups using Diallel Analysis. International Journal of Biological, Biomolecular, Agricultural, Food and Biotechnological Engineering 6(7):556-559.
|
|
|
|
|
CSA (Central Statistics Agency) (2012). Agricultural Sample Survey 2011/2012 (2004 E.C.). Volume IV. Report on Land Utilization (Private Peasant Holdings, Meher Season). Statistical Bulletin 532, Addis Ababa.
|
|
|
|
|
Central Statistics Agency (CSA) and the World Bank (WB) (2015). Ethiopia Socioeconomic Survey (ESS) - 2013/14 Survey Report (Workshop Version). Addis Ababa: CSA.
|
|
|
|
|
Darvishzadeh R (2012). Phenotypic and molecular marker distance as a tool for prediction of heterosis and F1 performance in sunflower (Helianthus annuus L.) under well-watered and water-stressed conditions. Australian Journal of Crop Science 6(4):732-738.
|
|
|
|
|
Fan XM, Zhang YM, Yao WH, Chen HM, Tan J, Xu CX, Han XL, Luo LM, Kang MS (2009). Classifying Maize Inbred Lines into Heterotic Groups using a Factorial Mating Design. Agronomy Journal 101:106-112.
Crossref
|
|
|
|
|
FAOSTAT (2019). Crop area, production and yield by country.
View. Accessed on 20 September.
|
|
|
|
|
Gudeta N, Dagne W, Habtamu Z (2015). Heterosis and combining ability of highland quality protein maize inbred lines. Maydica 60:1-12.
|
|
|
|
|
GYGA (2019). Global Yield Gap and Water Productivity Atlas. Available at
View. Accessed 12 September.
|
|
|
|
|
Hallauer AR, Russell WA, Lamkey KR (1988). Corn breeding. In: Sprague GF, Dudley JW (Eds.). Corn and corn improvement. 3rd ed. Agronomy Monograph No. 18. ASA, CSSA, and SSSA, Madison, Wisconsin pp. 463-564.
Crossref
|
|
|
|
|
Han GC, Vasal SK, Beck DL and Elis E (1991). Combining ability of inbred lines derived from CIMMYT maize (Zea mays L.) germplasm. Maydica 36:57-64.
|
|
|
|
|
Kempthorne O (1957). An introduction to genetic statistics. John Wiley, New York.
|
|
|
|
|
Legesse Weldae, Pixley KV, Botha AM (2009). Combining ability and heterotic grouping of highland transition maize inbred lines. Maydica 54(1):1-9.
|
|
|
|
|
Melchinger AE, Gumber RK (1998). Overview of heterosis and heterotic groups in agronomic crops. In: Lamkey KR, Staub JE (Eds.), Concepts and Breeding of Heterosis in Crop Plants. CSSA, Madison, WI. pp. 29-44.
Crossref
|
|
|
|
|
Reif JC, Gumpert FM, Fischer S, Melchinger AE (2007). Impact of interpopulation divergence on additive and dominance variance in hybrid populations. Genetics 176(3):1931-1934.
Crossref
|
|
|
|
|
Reif JC, Hallauer AR, Melchinger AE (2005). Heterosis and heterotic patterns in maize. Maydica 50:215-223.
|
|
|
|
|
Singh RK, Chaudhry BD (1985). Biometrical Methods in Quantitative Genetics Analysis. 2nd ed. Kalyani Publishers, New Delhi, India.
|
|
|
|
|
Singode A, Manivannan A, Ahmad B, Srivastava E, Mahajan V (2017). Heterotic grouping in early maturing Indian maize lines. International Journal of Agriculture Innovations and Research 6:57-62.
|
|
|
|
|
Smith JSJ, Smith OS (1992). Fingerprinting crop varieties, Advances in Agronomy 47:85-129.
Crossref
|
|
|
|
|
Statistical Analysis System (SAS) institute (2002). The SAS system for windows. Version 9.0. SAS Inst., Cary, NC.
|
|
|
|
|
Terron A, Preciado E, Cordova H, Mickelson H, Lopez R (1997). Determinacion del patron heterotico de 30 lineas de maiz derivadas dela poblacion 43SR del CIMMYT," Agron. Meso americana 8:26-34.
Crossref
|
|
|
|
|
Tsedeke A, Bekele S, Abebe M, Dagne W, Yilma K, Kindie , Menale K, Gezahegn B, Berhanu T, Tolera K (2015). Factors that transformed maize productivity in Ethiopia. Food Security 7(5):965-981.
Crossref
|
|
|
|
|
Vasal SK, Srinivasan G, Crossa J, Beck DL (1992). Heterosis and combining ability of CIMMYT's sub-tropical and temperate early maturing maize germplasm. Crop Science 32(4):884-890.
Crossref
|
|