ABSTRACT
Grain sorghum (Sorghum bicolor) has a great potential for use as food and beverage in developing countries. However, information regarding the effect of the agro-ecological environments on the grain quality attributes of selected sorghum lines desirable for malting and brewing and for baking in Kenya, is lacking. The experiments of this study were conducted at different environmental locations in Kisumu, Siaya and Busia Counties of Kenya. Nine sorghum lines were sown in plots in Randomized Complete Block Design (RCBD) and replicated three times. Panicles from two central rows of each plot were harvested at physiological maturity to provide grains that were used for proximate analysis. The percentage crude protein, tannin and starch content were determined. The amount of starch varied with sorghum lines and growing environments, ranging between 29.7 and 80.2%. SDSAI × ICSR43 line recorded tannin content in the range of 8.00 to 24.33 mg/100 ml tannic acid equivalents. Crude protein content and starch ranged 8.9 to 15.4% and 29.7 to 80.2%, respectively across environments. The combined analysis showed that the growing environment variously affected the nutritional and anti-nutritional content of sorghum lines. This implies that breeders should consider stability of the quality parameters that define commercial utilization of these sorghum lines.
Key words: Sorghum lines, lower midland zone (LM), starch, crude protein, tannins.
Grain sorghum (Sorghum bicolor L. Moench) has considerable potential for use as a human food and as raw material for lager and stout beer, and in baking. Commercial processing of sorghum grains into value-added food and beverage products is an important driver for economic development in the developing countries (Taylor et al., 2004). In malting and brewing, the quality aspect of sorghum grains that is important includes amylose, amylopectin, starch, protein, and tannin contents. Each of these quality attributes play a considerable role in the quality of beer obtained after brewing (Schnitzenbaumer and Arendt, 2014).
Sorghum grown for food has been reported to have health benefits protecting against colon cancer due to presence of antioxidants (Darvin et al., 2015). Sorghum grains are further preferred for fighting obesity due to its high tannin content that lowers digestibility. The growing demand for sorghum globally is attributed to its diversified uses including food products, malted beverages and ethanol production (Oyediran et al., 2017). Recent studies have shown that sorghum can be fortified with legumes to create cereal-based diets rich in protein (Okoye et al., 2017). Wheat flour has been the most important ingredient of bread for many years; however, sorghum is gaining popularity as an alternative for wheat in bread making. The composite flour made from sorghum for baking biscuits has high nutritional value (Rao et al., 2018).
The quality of sorghum grain is affected by factors such as genotype, climate, soil type, and fertilizer supply, among others; which can affect its chemical composition and the nutritive value (Ebadi et al., 2005). Johnson (2005), working on the influence of corn and sorghum characteristics on wet milling and nixtamalization, found that high temperatures and water stress result in lower starch concentrations. Wallwork et al. (1998) indicated that if a short period of high temperature occurs at a certain point in the grain filling period, it may affect one or more components, which are being synthesized concurrently, resulting in a different composition of the mature grain. High temperatures and moisture stress can limit the amount of grain fill operating through the metabolism of starch in the grain. Bleidere and Sterne (2008) working on spring barley reported that hot and dry conditions occurring during the cell division period in starchy endosperm resulted in shortening the cell division period, thus influencing the accumulation of starch; hence, low starch and higher protein. This is because the accumulation of starch is more sensitive to high temperatures than to the accumulation of nitrogen, which frequently determines increases in the grain nitrogen proportion, and thus results in higher protein contents (Schelling et al., 2003).
The release of new sorghum lines suitable for malting and brewing, and for use in baking, is of great significance to emerging farmers in Kenya who would wish to venture into sorghum production for commercial purposes. Industrial sorghum has a ready market and is likely to provide farmers with better returns. However, information regarding the effect of the agro-ecological environments on the grain quality attributes of sorghum desirable for malting and brewing and for baking in Kenya, is lacking. The acquisition of good quality grain is fundamental to produce acceptable food and beverage products from sorghum. Thus, the study was carried out to determine the effect of agro-ecological environment on the grain quality of selected sorghum lines for industrial uses, in order to advise sorghum farmers on sustainable production of quality grains.
Study location
Nine sorghum lines were grown at Masumbi and Sagam counties, both in the Lower Midland (LM) zone 1, in long and short rainy seasons, respectively, and at Mundika (LM 2) in both long and short rainy seasons in 2014. The short rainy season was between March and July while the long rainy season was experienced between September and December, 2014. Masumbi (00° 01ˈ 73.0ˈˈ N, 034° 21 ˈ 87.4ˈˈ E), located in Maranda Division at an altitude of 1370 m above sea level, is in Lower Midland (LM 1) zone. Dominating soils are well-drained, moderately deep to very deep, dark red to strong brown, friable clay; and in many places shallow (Jaetzold et al., 2005). Mundika (00° 24ˈ 56.6ˈˈS, 034° 07ˈ 93.1ˈˈE) is in the LM 2 zone characterized by well-drained, shallow to moderately deep, yellowish red to dark redish brown, friable, gravely sandy clay to clay soils (Jaetzold et al., 2005). The rainfall variability in this subzone is high, and hence the reliability is low. Sagam (0° 03ˈ20.86ˈˈ N, 034° 32 ˈ31.06ˈˈ E) is in LM 1 zone at 1387 m above sea level. Dominating soils are moderately well drained, moderately deep to deep, (very) dark brown, firm clay; in many places slightly calcareous and/or cracking clay; with a humic topsoil (Jaetzold et al., 2005). This zone receives an average annual rainfall of 1450 to 1650 mm where 60% reliability of the growing periods during the 1st and 2nd rainy seasons is more than 190 and 130 to 150 days, respectively (Jaetzold et al., 2005). In Sagam (LM 1), the annual temperature range is 21.2 to 22.8°C.
Experimental design and treatments
The experiment was set up in a Randomized Complete Block Design (RCBD) with nine experimental units each measuring 4 m by 2.5 m and replicated three times. A path of 1.5 m separated the replicates. Each experimental unit had four rows of a specific sorghum line. The treatments were the five sorghum lines suitable for baking and four suitable for malting and brewing, evaluated at the four agro-ecological environments. These lines are SDSAI X ICSR 43, IS 9203, IS25561, IS 25557, Sima, Gadam, Serena, Siaya # 2-3 and Abaleshya. Sima, Gadam, and Serena were used as the controls for the line identified for malting and brewing (SDSAI X ICSR 43), while Siaya #2-3 and Abaleshya were the checks for lines identified for use in baking (IS 9203, IS25561 and IS 25557).
Agronomic management
Land was disc ploughed and harrowed to fine tilt. Sorghum was sown at onset of rainy season at a seed rate of 8 kg ha-1 on 18th March and 10th September, 2014 for first and the second season, respectively. The inter row spacing for the drills was 60 cm at a planting depth of 2.5 to 4 cm. Due to low nitrogen (0.11 to 0.17%) and phosphorous (5.5 to 9.8 ppm) levels in these soils, there was a uniform fertilizer application in all the plots. Nitrogen was applied using Calcium Ammonium Nitrate at the rate of 40 kg N ha-1 split into two applications of 20 kg N ha-1 at planting and top dressed with 20 kg N ha-1. Phosphorous was added at planting using Triple Super Phosphate at a rate of 17.2 kg P2O5 ha-1. Two weeding operations were carried out, with the first weeding being done at 2 to 3 weeks after seedling emergence. After the first weeding the crop was thinned to a spacing of 60 cm (inter row) by 10 cm (intra row). The second weeding was carried out when the crop was about 45 cm high. Harvesting was done when the crop had reached physiological maturity approximately 16 weeks after sowing for the first season and 14 weeks for the second season.
Sample collection
Harvesting of panicles from the two inner rows per plot was done at physiological maturity. It involved cutting the panicles at the collar of the top-most leaf using secateurs. Samples were put in well-labelled bags. Panicles were then sun dried for 2 weeks to moisture content of 13% followed by threshing and winnowing to obtain clean grains. The grains were thereafter milled finely to pass through a 1 mm sieve. The flour obtained was used for proximate analysis.
Proximate analysis
Determination of crude protein content
Total nitrogen and protein was determined using the Kjeldahl method (AOAC, 1999). One-tenth gram finely milled sorghum grains were weighed and transferred into a digestion tube. Selenium catalyst mixture weighing 1 g was mixed with the samples and 5 ml of 96% sulphuric acid was added into the tube. The tubes were then heated cautiously in the digester at the fume cupboard until the digest was clear. The sample was transferred to a 100 ml volumetric flask, and distilled water was added into a 100-ml graduated flask up to the mark. Boric acid indicator solution of 5 ml was then transferred to a 100-ml conical flask containing 5 drops of mixed indicator, and then placed under the condenser of the distillation apparatus. 10 ml of the clear supernatant liquid of the digest was then transferred into the apparatus, and 10 ml of 46% sodium hydroxide added and then rinsed again with distilled water. Distillation then commenced. After the first distillation, drops reached the boric acid indicator solution, and colour changed from pink to green. A total of 150 ml of the distillate was collected. The solution was titrated with 0.0174 N sulphuric acids until the colour changed from green to pink. The sample was replicated three times for each sorghum line. Total N was determined using the formula:
% N = (a × N × Mw × 100 / b × c) × 100
where a = ml of sulphuric acid used for titration of the sample, N = Normality of sulphuric acid (0.0174), Mw = Molecular weight of N2 (0.014), c = ml digest taken for distillation (10 ml), b = g sample taken for analysis (0.1 g), and % Crude Protein = 6.25 × % N.
Determination of tannin content
Tannins content was determined through Folin-Denis method (Schanderl, 1970). Powdered flour (0.5 g) was weighed and transferred to a 250-ml conical flask followed by addition of 75 ml of water. The flask was heated gently and boiled for 30 min and then centrifuged at 2000 rotations per minute for 20 min. The supernatant was collected in a 100-ml volumetric flask. 1 ml of the sample extract was transferred to a 100-ml volumetric flask containing 75 ml water. 5 ml of folin reagent and 10 ml of 35% sodium carbonate solution were added and then diluted to 100 ml with water. The sample was shaken and the absorbance read at 700 nm after 30 min. A graph was prepared using 0 to 100 mg tannic acid, where 1 ml contained 100 mg tannic acid. The sample was replicated three times for each sorghum line. The tannin content of the sample was calculated as tannic acid equivalent from the standard curve.
Determination of starch
Percent starch content was determined by the Anthrone method (Hodge and Hofreiter, 1962), whereby 0.2 g of milled grain sample was homogenized in 80% hot ethanol to remove sugars. The residue was then centrifuged and retained. The residue was dried well over a hot water bath. To the residue, 5.0 ml of distilled water and 6.5 ml of 52% perchloric acid was added and then extracted at 0°C for 20 min. The supernatants were centrifuged, pooled and made up to 100 ml. 0.1 ml of the supernatant was pipetted out and made up to the volume of 1 ml with distilled water. The standards were prepared by taking 0.2, 0.4, 0.6, 0.8 and 1 ml of the working standard solution and the volume made up to 1 ml in each tube with water. 4 ml of Anthrone reagent was then added to each tube and the sample heated for 8 min in a boiling water bath. Each sample was cooled rapidly and the intensity of green to dark green colour was read using a spectrophotometer at 630 nm. The sample was replicated three times for each sorghum line. The glucose content in the sample was determined using the standard calibration graph and then the value was multiplied by a factor of 0.9 to arrive at the starch content.
Data analysis
Data were subjected to analysis of variance using SAS version 8.1 (Littel et al., 2002). Means were separated according to Least Significant Difference (LSD) whenever the sorghum line effects were significant (P ≤ 0.05).
Crude proteins
There were significant differences in the crude protein content in the different sorghum lines. Results showed that the protein content of the sorghum lines evaluated ranged from 8.93 to 13.79, 10.32 to 15.35, 9.08 to 14.64, and 9.36 to 12.38% when grown in a long rainy season in Mundika (LM 2) and Masumbi (LM 1) and during short rainy season in LM 2 and Sagam (LM 1), respectively (Table 1). Some inbred and hybrid lines of sorghum in Kansas (Hicks et al., 2002) and African sorghum lines (Aba et al., 2005) had a similar crude protein range of 10.3 to 16.5% and 10 to 16.45%, respectively. Genetic variability of sorghum accessions was reported to contribute to the variation in crude protein content of the accessions evaluated (Chavan et al., 2009; Ng’uni et al., 2012).
In this study, the growing environment had an affect on accumulation of crude protein in some of the sorghum lines evaluated (Table 1). Among the lines suitable for malting, SDSAI × ICSR43 line maintained statistically similar amounts of crude protein in all the test environments, whereas Gadam and Serena showed a drop in crude protein when cultivated in Sagam (LM 1). Sima, in contrast, yielded higher crude protein when grown in Masumbi (LM 1) and in the long rainy season in LM 2, while a low crude protein content was produced upon growing the line during short rainy season in LM 2 and in Sagam (LM 1).
Among the lines suitable for baking, lines IS 25557 and Siaya #2-3 were the only two lines that showed interaction with the environment in which they were cultivated in terms of crude protein content (Table 1). IS 25557 line had low crude protein when grown in Sagam (LM 1), while Siaya #2-3 yielded high crude protein when cultivated in LM 2 during the short rainy season, moderately high crude protein when grown in Masumbi (LM 1) and lowest amount was obtained when the line was grown in LM 2 during the long rainy season. Protein content and composition vary due to genotype and water availability, temperature, soil fertility and environmental conditions during grain development (Hulse et al., 1980; Ebadi et al., 2005). The protein content of sorghum variety is important if the variety is to be designated as grain sorghum for malting and brewing purposes (FAO, 1995; Beta et al., 1995). This is because proteins degradation by proteolytic enzymes to peptides and amino acids (Jones, 2005a, b) provides energy for the yeasts during the fermentation process leading to production of alcohol. Kiprotich et al. (2014) reported that desirable protein contents of sorghum for malting and brewing should be within the range of 5 to 10%. SDSAI × ICSR43 line recorded 10.32% crude protein when grown in LM 1 during the long rain season, which was not significantly different from amount of crude protein yielded in the rest of the test environments. This shows that the new variety SDSAI × ICSR43 can be adopted by breweries due to its superior qualities in terms of yield and quality attributes.
Tannins
The tannin content of the sorghum lines ranged between 8.00 and 70.00 mg/100 ml tannic acid equivalents (Table 2). This is consistent with Kiprotich et al. (2014) who reported similar ranges of 6.88 to 79.89 mg/100 ml tannic acid among locally grown sorghum genotypes in Kenya. The SDSAI × ICSR43 line had a tannin content that ranged between 8.00 to 24.33 mg/100 ml tannic acid equivalents depending on the growing environment. Relative to the check lines, the tannin content of SDSAI × ICSR43 line was 45.27% lower than for Sima when grown in Mundika (LM 2) during the short rainy season. Growing the lines in Masumbi (LM 1), SDSAI × ICSR43 line had 39.56, 46.27 and 54.32% less tannin than Sima, Gadam and Serena, respectively. During the long rainy season in LM 2, lowest amounts of tannins were obtained for SDSAI × ICSR43 than the check lines; while planting these lines in Sagam (LM 1) their tannin content was statistically analogous.
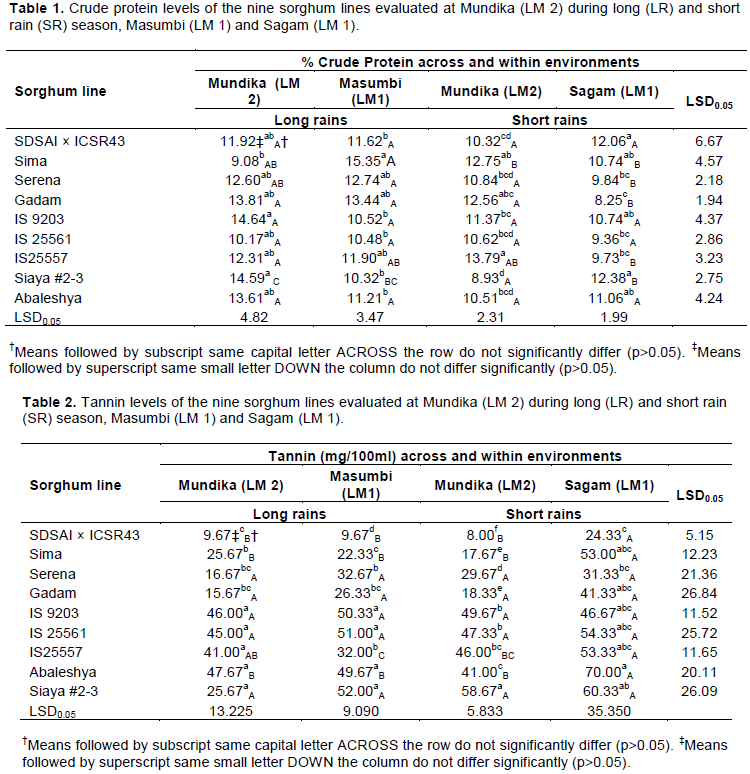
Sorghum lines suitable for baking had tannin levels ranging from 41.00 to 70.00 mg/100 ml tannic acid equivalents (Table 2). No significant statistical variation in tannin content was observed among the sorghum lines when grown in LM 2 during the short rainy season and in Sagam (LM 1). However, evaluating the lines during the long rainy season in LM 2, Siaya #2-3 recorded the highest amount of tannins, while IS 25557 had the lowest amount of tannins relative to other lines when evaluated at Masumbi (LM 1). High tannin sorghums are desirable in making food products due to their palatability (Awika et al., 2004). Good quality breads containing tannin sorghum bran have high antioxidant and dietary fiber levels, with a natural dark brown colour and excellent whole grain flavor (Gordon, 2001). In addition, healthy bread mixes containing tannin sorghum bran, barley flour, and flax seed have been developed (Rudiger, 2003).
The combined analysis showed that the agro-ecological environment was the main source of variation in tannin content of sorghum lines, particularly SDSAI × ICSR43, IS 25557, Abaleshya and Sima (Table 2). Trikoesoemaningtyas et al. (2015) reported similar findings on sorghum lines evaluated in Indonesia. Taleon et al. (2012) on evaluating black sorghum found that the total flavonoid content was affected strongly by
environment, mainly due to the differential effect of abiotic factors such as light and temperature, and differential intensity of fungal infection. Wu et al. (2016) indicated that tannin biosynthesis in the sorghum grains might be inhibited under the higher growing temperature. However, in this study all sorghum lines evaluated recorded higher amount of tannins when grown in an environment that received the highest maximum daily temperature of 28°C, among the test environments. Similar findings were reported by Wang and Zheng (2001) working on strawberry where the individual phenolics of strawberry increased when growth temperature increased from 18/12 to 30/22°C (day/night). Kiprotich et al. (2014) recommended that sorghum grains suitable for malting and brewing should not have tannin levels greater than 18.13 mg/100 ml since high tannin levels poses a challenge during the brewing process. Tannins inhibit the activity of alpha amylase (Alonso et al., 2000), and this lowers hydrolysis of starch that is essential for brewing. This study has shown that growing SDSAI × ICSR43 in LM 1 (Sagam) during the short rainy season causes a drastic increase in tannin content for the line, thus affecting its suitability for use in brewing. Cultivation of SDSAI × ICSR43 in LM 1 and LM 2 during the long rainy season and LM 2 during the short rainy season produces quality grains for malting and brewing with regard to tannin levels. This suggests it requires about 846.4 mm of rainfall during the crop growing period and an average minimum and maximum temperature of 20 and 28°C to obtain the optimum grain quality for malting and brewing.
Starch
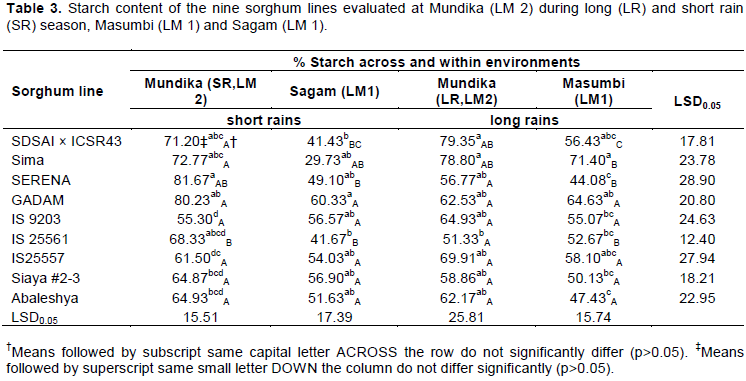
The sorghum lines evaluated had starch content ranging from 29.73 to 80.23% (Table 3). Generally, the malting and brewing sorghum lines had relatively higher amounts of starch compared to the lines suitable for baking. This confirms the findings by Almodares and Sepahi (1996) that the cultivar of sorghum affects the levels of sorghum non-structural carbohydrates. SDSAI × ICSR43 line yielded similar amounts of starch as the check lines in all the test environments. On the other hand, an environmental effect on starch content was noted on lines SDSAI × ICSR43, Sima and Serena, while Gadam maintained a comparable amount of starch in all the test environments. Sorghum grain starch accumulation is subject to environmental factors since it is a quantitatively inherited trait (Bing et al., 2014). The SDSAI × ICSR43 line yielded the highest amount of starch when grown in Mundika (LM 2), both in long and short rainy seasons, moderate amount in Masumbi, and lowest amount when grown in Sagam. Lines Sima and Serena when grown in Sagam (LM 1) and Masumbi (LM 1), respectively, produced lowest amount of starch.
All the lines suitable for baking did not differ in the amount of starch within each growing environment (Table 3). In addition, genotype by environment effect was only observed with IS 25561 line whereby in Mundika (LM 2) during the short rainy season the highest starch content was realized; whereas in the other test environments lower amounts of starch were recorded that were statistically similar across the environments. Many researchers have reported the effect of growing environment on the chemical composition of sorghum grain and other cereals (Beta and Corke, 2001; Tester and Karkalas, 2001; Matsuki et al., 2003; Kiprotich et al., 2014; Trikoesoemaningtyas et al., 2015). However, the current study has shown that variation in starch content among sorghum lines suitable for use in baking was rather based on genotype than the growing environment.

Similar findings on genetic variations in starch content were reported in triticale (× Triticosecale) (Burešová et al., 2010) and in wheat (Triticum aestivum L.) (Labuschagne et al., 2007; Massaux et al., 2008).
The combined analysis showed that growing environment affected the nutritional and anti-nutritional content of sorghum lines with different magnitudes. The variances due to sorghum lines were higher for starch content and protein, but the variability observed for tannin content were mostly due to the agro-ecological environment of cultivation. The presence of genotypes × environmental interaction resulted in differential nutritional values of sorghum grains over environments. The results indicated that while conducting yield stability trials, breeders should not only focus on agronomic characters and yield potential, but should also consider stability of the quality parameters that define commercial utilization of these sorghum lines.
This study, therefore, recommends that during the long rainy season, lower midland zone (LM) 1, is ideal for the cultivation of line SDSAI ×ICSR43. This zone produces grains of required quality in terms of their usage in malting and brewing. Lower midland zone 2 is a stable environment for cultivation of the sorghum lines evaluated.
The authors have not declared any conflict of interests.
The authors acknowledge Kenya Agricultural Productivity and Agri-business Programme for funding the research. The Department of Crops, Horticulture and Soil Sciences in Egerton University is also thanked for providing facilities that ensured smooth running of the project.
REFERENCES
|
Aba DA, Abu E, Chindo PS, Marle PS, Maigida DN, Ogungbile AO (2005). Characterization of Some Released Sorghum Varieties for Food and Industrial Utilization in Nigeria. Agricultura Tropica Et Subtropica 38:1-6.
|
|
|
|
Almodares A, Sepahi A (1996). Comparison among sweet sorghum cultivars, lines and hybrids for sugar production. Annual Review of Plant Physiology 10:50-55.
|
|
|
|
|
Alonso A, Aguirre A, Marzo F (2000). Effect of extrusion and traditional processing methods on anti-nutrients and in vitro digestibility of protein and starch in faba bean and kidney beans. Food Chemistry 68(2):159-165.
Crossref
|
|
|
|
|
Association of Analytical Communities (AOAC) (1999). New method for determination of nitrogen in organic substances. Association of Analytical Communities, International. Maryland, USA 22:366-383.
|
|
|
|
|
Awika JM, Rooney LW, Waniska RD (2004). Anthoycanins from black sorghum and their antioxidant properties. Food Chemistry 90:293-301.
Crossref
|
|
|
|
|
Beta T, Corke H (2001). Genetic and environmental variation in sorghum starch properties. Journal of Cereal Science 34:261-268.
Crossref
|
|
|
|
|
Beta T, Rooney LW, Waniska RD (1995). Malting characteristics of sorghum cultivars. Journal of Cereal Science 72:533-538.
|
|
|
|
|
Bing YI, Zhou YF, Gao, MY, Zhang Z, Yi HAN, Yang GD, Wenjuan XU Huang RD (2014). Effect of drought stress during flowering stage on starch accumulation and starch synthesis enzymes in sorghum grains. Journal of Integrative Agriculture 13:2399-2406.
Crossref
|
|
|
|
|
Bleidere M, Sterne D (2008). Genetic and environmental effect on the grain quality of spring barley. Agronomijas Vestis 11:33-39.
|
|
|
|
|
Burešová I, SedláÄková I, FamÄ›ra O, Lipavský J (2010). Effect of growing conditions on starch and protein content in triticale grain and amylose content in starch. Plant, Soil and Environment 56: 99-104.
Crossref
|
|
|
|
|
Chavan VD, Patil JV, Shinde MS (2009). Nutritional and Roti Quality of Sorghum Genotypes. Indonesian Journal of Agricultural Science 10:80-85.
Crossref
|
|
|
|
|
Darvin P, Joung YH, Nipin SP, Kang DY, Byun HJ, Hwang DY, Yang YM (2015). Sorghum polyphenol suppresses the growth as well as metastasis of colon cancer. Journal of Functional Foods 15:193-206.
Crossref
|
|
|
|
|
Ebadi MR, Pourreza J, Jamalian J, Edriss MA, Samie AH, Mirhadi SA (2005). Amino acid content and availability in low, medium and high tannin sorghum grain for poultry. International Journal of Poultry Science 4:27-31.
Crossref
|
|
|
|
|
Food and Aagriculture Organization (FAO) (1995). Sorghum and Millet in Human Nutrition. FAO Food and Nutrition Series NO. 27, Food and Agriculture Organization of the United Nations, Rome.
|
|
|
|
|
Gordon LA (2001). Utilization of sorghum brans and barley flour in bread. M.S. Thesis, Texas A&M University, College Station, TX.
|
|
|
|
|
Hicks C, Tuinsra MR, Pederssen JF, Kofoid KD (2002). Genetic analysis of feed quality and seed weight of sorghum inbred lines and hybrids using analytical methods and NIRS. Euphytica 127:31-40.
Crossref
|
|
|
|
|
Hodge JE, Hofreiter BT (1962). Methods in carbohydrates chemistry. Academic Press. New York pp. 380-394
|
|
|
|
|
Hulse JH, Lating EM, Pearsoin OE (1980). Sorghum and the millets: their composition and nutritive value. Academic Press. International Development Research Centre, Ottawa, Canada 997 p.
|
|
|
|
|
Jaetzold R, Schmidt H, Hornetz B, Shisanya C (2005). 2nd ed. Farm management handbook of Kenya Vol. II, Natural Conditions and Farm Management/ Busia, Siaya and Kisumu counties. GTZ, and Ministry of Agriculture, Kenya.
|
|
|
|
|
Johnson WB (2005). The influence of corn and sorghum characteristics on wet milling and nixtamalization performance. Analytical Chemistry 15th ed. AOAC, Inc., Arlington, VA.
|
|
|
|
|
Jones BL (2005a). Endoproteases of barley and malt. Journal of Cereal Science 42:139-156.
Crossref
|
|
|
|
|
Jones BL (2005b). The endogenous endoproteinase inhibitors of barley and malt and their roles in malting and brewing. Journal of Cereal Science 42:271-280.
Crossref
|
|
|
|
|
Kiprotich FK, Cheruiyot EK, Mwendia CM, Wachira FN, Owuoche JO (2014). Biochemical quality indices of sorghum genotypes from East Africa for malting and brewing. African Journal of Biotechnology 13(2):313-321.
Crossref
|
|
|
|
|
Labuschagne MT, Geleta N, Osthoff G (2007). The influence of environment on starch content and amylose to amylopectin ratio in wheat. Starch-Starke 59:234-238.
Crossref
|
|
|
|
|
Littel RC, Ramon C, Waiter S, Rudoff J (2002). SAS for linear models. 4th edition. Cary NC: Statistical Analysis System Institute.
|
|
|
|
|
Massaux C, Sindic M, Lenartz J, Sinnaeve G, Bodson B, Falisse A, Dardenne P, Deroanne C (2008). Variations in physicochemical and functional properties of starches extracted from European soft wheat (TriticumaestivumL.) the importance to preserve the varietal identity. Carbohydrate Polymers 71:32-41.
Crossref
|
|
|
|
|
Matsuki J, Yasui T, Kohyama K, Sasaki T (2003). Effects of Environmental Temperature on Structure and Gelatinization Properties of Wheat Starch. Cereal Chemistry 80:476-480.
Crossref
|
|
|
|
|
Ng'uni D, Geleta M, Hofvander P, Fatih M, Bryngelsson T (2012). Comparative genetic diversity and nutritional quality variation among some important Southern African sorghum accessions [Sorghum bicolor (L.)Moench]. Australian Journal of Crop Science 6:56-64.
|
|
|
|
|
Okoye JI, Ene GI, Ojobor CC (2017). Chemical composition and functional properties of Sorghum-African yam bean flour blends. Sky Journal of Food Science 6:21-26.
|
|
|
|
|
Oyediran WO, Omoare AM, Osinowo OA (2017). Contributive Roles of Sorghum Production to Food Security and Economic Empowerment of Rural Farming Households in Katsina State, Nigeria. Canadian Journal of Agriculture and Crops 2(1):42-49.
Crossref
|
|
|
|
|
Rao BD, Kulkarni DB, Kavitha C (2018). Study on evaluation of starch, dietary fiber and mineral composition of cookies developed from 12 sorghum cultivars. Food Chemistry 238:82-86.
Crossref
|
|
|
|
|
Rudiger C (2003). The formulation of a nutraceutical bread mix using sorghum, barley, and flaxseed. M.S. Thesis, Texas A & M University, College Station, TX.
|
|
|
|
|
Schanderl SH (1970). Methods in food analysis. M. A. Joslyn (ed), Academic Press, New York P 354.
|
|
|
|
|
Schelling K, Born K, Weissteiner C, Kunbauch W (2003). Relationships between yield and quality parameters of barley (Hordeum vulgare L.) and phenological and meteorological data. Journal of Agronomy and Crop Science 189:113-122.
Crossref
|
|
|
|
|
Schnitzenbaumer B, Arendt EK (2014). Brewing with up to 40% unmalted oats (Avena sativa) and sorghum (Sorghum bicolor): a review. Journal of the Institute of Brewing 120:315-330.
Crossref
|
|
|
|
|
Taleon V, Dykes L, Rooney LW (2012). Effect of genotype and environment on flavonoid concentration and profile of black sorghum grains. Journal of Cereal Science 56:470-475.
Crossref
|
|
|
|
|
Taylor JR, Schoberb, TJ Bean SC (2004). Novel food and non-food uses for sorghum and millets. USDA-ARS, GMPRC, Manhattan.
|
|
|
|
|
Tester RF, Karkalas J (2001). The effects of environmental conditions on the structural features and physico-chemical properties of starches. Starch 53:513-519.
Crossref
|
|
|
|
|
Trikoesoemaningtyas WD, Sopandie D, Tesso T (2015). Genotypes X environment interaction effect on nutritional quality of sorghum lines in Indonesia. Ekin Journal of Crop Breeding and Genetics 1-2:26-31
|
|
|
|
|
Wallwork MAB, Logue SJ, MacLeod LC, Jenner CF (1998). Effects of a period of high temperature during grain filling on the grain growth characteristics and malting quality of three Australian malting barleys. Australian Journal of Agricultural Research 49:1287-1296.
Crossref
|
|
|
|
|
Wang SY, Zheng W (2001). Effect of plant growth temperature on antioxidant capacity in strawberry. Journal of Agricultural and Food Chemistry 49:4977-4982.
Crossref
|
|
|
|
|
Wu G, Johnson SK, Bornman JF, Bennett SJ, Singh V, Simic A, Fang J (2016). Effects of Genotype and Growth Temperature on the Contents of Tannin, Phytate and In Vitro Iron Availability of Sorghum Grains. PLoS One 11:1-12.
Crossref
|
|