ABSTRACT
Wheat growth and yield response were evaluated in a greenhouse experiment using two major soils, Nitosols and Vertisols. Sorption capacities of the soils and crop response were employed to determine the availability of nutrients in the two soils. Eight fertilizer treatments (Optimum (Opt.),Optimum-N, Optimum-P,Optimum-K,Optimum-S,Optimum-B,Optimum-Zn and control) in Nitosols and six fertilizer treatments (Optimum, Optimum-N, Optimum-P, Optimum-S, Optimum-B and control) in Vertisols were arranged in completely randomized design (CRD) with five replications using wheat variety (Digalu) as a test crop. Deficiency in total N, available P, S and B was observed in the two soils. Besides, K and Z in Nitisols were less than three times the critical values. The result indicated that applications of optimum fertilizer significantly (P<0.05) increased plant height, spike length, number of seeds per spike, straw yield, grain yield and total biomass yield. Similarly, it resulted in an increase in grain yield of 75 and 68% over the controls in Nitosols and vertisols respectively. Omission of N, P, S, and B were resulted in grain yield reduction by 65.6, 23.4, 4.7, and 3.1% in Nitosols and by 69.4, 22.4, 14.1, and 15.3% in vertisols. Omission of K and Zn in Nitisols also causes up to 9.4 and 4.7% grain yield reduction. Thus, external supplies of these nutrients could be recommended for optimum production of wheat.
Key words: Grain yield, Nitisols, nutrient concentrations in plants, soil nutrient contents, Vertisols.
Cereal crops are the largest group in terms of their share in area cultivated, production, productivity and consumption in Ethiopia (CSA, 2018). Wheat is one of the major cereals widely grown in the highlands of Ethiopia. The country is the second largest wheat producer in sub-Saharan Africa, next to South Africa (ECEA, 2008). Wheat ranks fourth after teff (Eragrostis tef), maize (Zea mays) and sorghum (Sorghum bicolor) in area coverage and total production (CSA, 2018). Wheat production has grown significantly following several government programs and initiatives implemented to drive agricultural growth and food security in the country. Ethiopian wheat production is estimated at 4.5 million tonnes in 2018/19 and almost 1.65 million hectares were dedicated to wheat cultivation (GAIN, 2019). According to Global Agricultural Information Network (GAIN, 2019) report yields are close to 2.7 tons per hectare. However production still falls short of meeting domestic needs and the country remains a net importer of wheat.
Soil fertility depletion is a major constraint to agricultural production and food security worldwide, particularly in wheat and rice production areas of the developing world (Tan et al., 2005). Similarly, one of the basic limiting factors for cereal crop yield including that of wheat in Ethiopia is poor soil fertility (Louis, 2010). The problem is more serious in the highlands where most of the human and livestock population is inhabited (Hailu, 2010). Nitisols and Vertisols are among the most extensive agricultural soils in the Ethiopian highlands but soil degradation threatens their productive capacity (Hillette et al., 2015; Eyasu, 2017). The most recent survey indicates the extent of Nitisols coverage is about one million hectares accounting for 31% of the agricultural lands in the Ethiopian highlands (Elias, 2016). Nitisols are among the most productive agricultural soils along with Vertisols, Luvisols, and Planosols (Stocking, 1988). Vertisols also cover 13 million hectares of land mass, while more than half (8.6 million ha) of the Vertisols are found in the central highlands of the country (Debele, 1985; Jutzi et al., 1987). Ethiopia ranks third in Vertisols abundance in Africa after Sudan and Chad (Jutzi et al., 1987). In addition to the high P fixing characteristics of Vertisols (Abunyewa et al., 2004), lack of response to P application on central highland Vertisols of Ethiopia may be due to deficiency of nutrients other than P.
Previously, only nitrogen (N) and phosphorus (P) were considered to be the limiting nutrients in Vertisols of Ethiopia (Mamo et al., 1988). However, many soils in the highlands of Ethiopia are poor in available plant nutrients and organic matter content (Mamo et al., 2002). Hence, the national gross nutrient depletion rate was estimated to be -122 kg N ha−1, −13 kg P ha−1 and −82 kg K ha−1 (Haileslassie et al., 2005). The field level nutrient balances on Nitisols from southern Ethiopia (−102, −45 and −67 kg ha−1 for N, P and K respectively) are even more threatening (Elias, 2002). Soil erosion also contributes significantly to soil fertility depletion, as the rates of losses are estimated to be 130 tons ha−1 for cultivated fields, which is one of the highest in Africa (FAO, 1986; Elias, 2016). Nitrogen and phosphorus are not the only yield constraining factors, but others such as S, Zn, B, Fe, Cu and K-deficiencies are also common soil fertility problems due to the low inherent soil fertility status and/or poor management (Tegbaru. 2015). Mining of nutrients due to low and unbalanced fertilizer application favored the emergence of multi nutrient deficiencies in Ethiopian soils (Desta, 1984, Abiye et al., 2004). The recent national soil fertility survey conducted by Ethiopian Agricultural Transformation Agency (ATA) revealed that in addition to nitrogen and phosphorus, potassium, sulfur, and zinc deficiencies are widespread in Ethiopian soils, while some soils are also deficient in boron and copper (ATA, 2013). These all potentially limit crop productivity despite continued use of nitrogen and phosphorus fertilizers as blanket recommendation over decades.
The nutrients usually applied as a fertilizer for crop production in Ethiopia are nitrogen and phosphorus in the form of Urea and DAP (Hillette et al., 2015). However, if the level of any one of the other essential nutrients falls below the critical level, the yield response to nitrogen and phosphorus would be seriously affected. Therefore, in order to set priorities among the different plant nutrients, it is important to identify the status of the limiting nutrients in various soils. Thus, this research was carried out to evaluate wheat growth and yield response to most essential nutrients under Nitisols and Vertisols from central highlands of Ethiopia.
Description of the study area
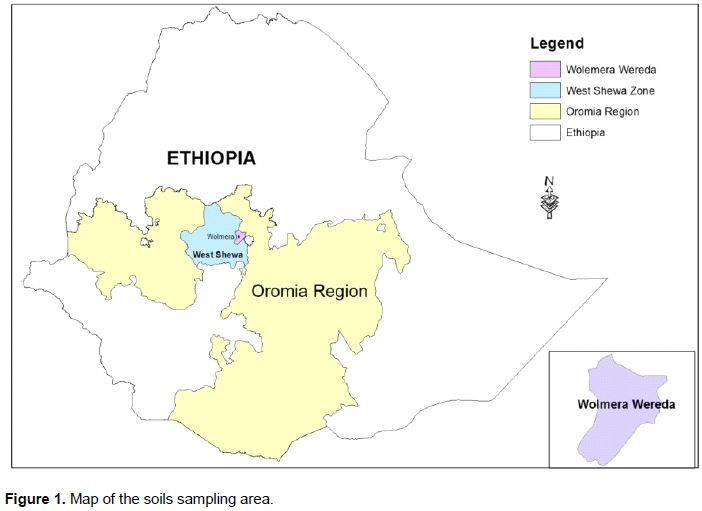
Pot experiment was conducted under greenhouse conditions at National Soil Testing Center in Addis Ababa, Ethiopia using soil samples collected from Wolmera district of Oromia Regional State, central Ethiopia. The soils used for the study were classified as Nitisol and Vertisol, covering large production areas of central highlands of Ethiopia (Debele, 1985; Jutzi et al., 1987; Elias, 2016). Wolmera is one of the districts in West Shewa Zone of Oromia Regional State, Ethiopia (Figure 1). It is located at about 30 km west of Addis Ababa on the main road to Ambo city. It is situated at an altitude of 2000 to 3380 m above sea level. The area receives an average annual rainfall of 1067 mm and average temperature of 18°C (BoA, 2013).
Soil sampling, preparation and analysis
Soil samples (0-20 cm depth) were randomly taken from 40 sampling points, 20 each for Nitisols and Vertisols using an auger. The soil samples were bulked into two composite samples, one each for Nitisols and Vertisols. The composite samples were then homogenized and crushed for a pot trial in the greenhouse experiment. Sub-samples were taken from the composites, air-dried and ground with mortar and pestle to pass through a 2 mm sieve and subjected to physicochemical analyses and sorption study. For determinations of organic carbon (OC) and total nitrogen (TN), however, a 0.5 mm sieve was used.
Soil particle size was done by using the modified sedimentation hydrometer procedure (Bouyoucos, 1951), bulk density (BD) was determined according to BSI,(1975) and soil water holding at filed capacity and permanent wilting point was determined according to the procedure outlined by Van Reeuwijk (1993). Soil pH and electrical conductivity (EC) were measured in the supernatant suspension of a 1:2.5 soil:water mixture by using a pH meter and EC meter, respectively (Van Reeuwijk, 1993). Soil organic carbon was determined by using wet oxidation method of Walkley and Black (Walkley and Black, 1934), while total nitrogen was analyzed by wet-oxidation procedure of the Kjeldahal method (Bremner and Mulvaney, 1982). Available phosphorus was determined by Olsen method (Olsen and Sommer, 1982). Exchangeable basic cations and cation exchange capacity (CEC) of the soils were determined by leaching the soils with neutral 1M ammonium acetate (Van Reeuwijk, 1993). The exchangeable cations, calcium (Ca) and magnesium (Mg), in the leachate were determined by Atomic Absorption Spectrophotometer (AAS), whereas potassium (K) and sodium (Na) were determined by flame photometer. Sulfate was determined turbid-metrically using barium sulfate precipitation method (Motsara and Roy, 2008). Available micronutrients iron (Fe), manganese (Mn), zinc (Zn) and copper(Cu) contents of the soils were extracted by diethylenetriaminepentaacetic acid (DTPA) method (Lindsay and Norvell, 1978) and the contents of each in the extract were determined by atomic absorption spectrophotometer. The concentration of water-soluble boron was determined by hot water extraction (Watson, 2011).
Preparation of sorption solutions
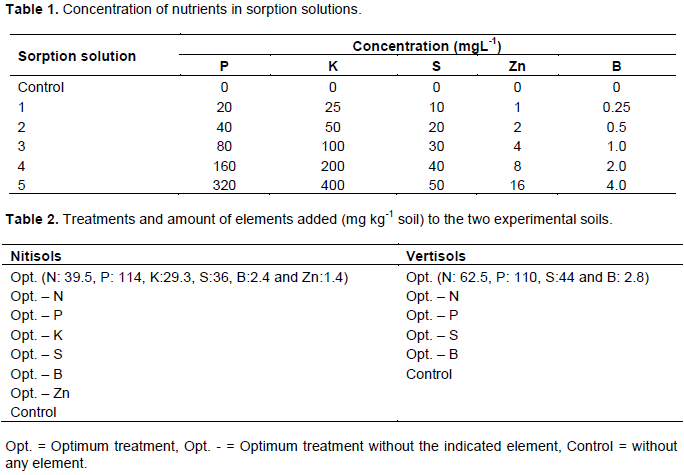
The laboratory analysis result of the soil samples showed that total N, available P, S, and B are deficient in both soil types. In addition, K and Zn in Nitisols were below three times the critical levels of the respective elements, while the other nutrients were found to be sufficient for crop production. Based on the analysis result sorption solutions for phosphorus (P), sulfur (S), boron (B), potassium (K) and zinc (Zn) were prepared and the amount of a particular element necessary to bring the level to three times its critical level was determined from the sorption solution curves. A series of five sorption solutions were prepared in polyethylene bottles with a control in replications. The actual amounts were varying according to the concentration of a particular element in the soil (Table 1).
Ten gram of soil sample along with 10 ml of sorption solution was added to each bottle, while 10 ml of distilled water was added for the control. Then, the bottles were gently shake to ensure complete mixing of the solution with the soil and allowed to air dry. The air dried samples were extracted and analyzed for the elements. A sorption curve was constructed for each element by plotting the amount of element extracted against the added amount. These sorption curves were used to determine the optimum amount of element to be added in the treatments of the greenhouse experiment except for N. N was added based on the recommendations given by Holeta Agricultural Research Center (150 DAP and 100 Urea per hectare for Nitisols and 150 DAP and 200 Urea per hectare for Vertisols) (personal communication). The critical levels used for the nutrients were phosphorus, 12 mg; potassium, 121 mg; sulfur 10 mg, zinc, 0.5 mg and boron 0.5 mg per kg of soil (Havlin et al. 2010; Landon, 2014).
Experimental design and treatments
The treatments were determined by using soil analysis and sorption results, except for N, for both soils. Three kilogram of the composite soil sample was placed on the plastic sheet and measured amounts of nutrients as per the treatments (Table 2) were applied and mixed thoroughly before filling the plastic pots (20 cm × 14.5 cm × 16 cm). Plastic pots filled with soils were watered to the field capacity three days before seed sowing. Wheat variety Digalu, obtained from Holeta Agricultural Research Center, and that is commonly used by the farmers in the study area, was used as a test crop. Six seeds of wheat were sown in each pot and thinned to four plants at two weeks after germination. The pots were kept in a greenhouse and watered using deionized water regularly to maintain moisture level at about field capacity. Under each pot, a saucer was placed to collect drainage losses of the nutrients. The treatments were arranged in a completely randomized design (CRD) with five replications.

Plant data collection and sample analysis
Plant data collection
Eight weeks after germination, two replications were randomly selected and the plants in each pot were sampled for determination of nutrient contents in the shoot. Nutrient uptake by the shoot for each treatment was determined quantitatively by multiplying shoot dry weight of each treatment by the respective nutrient content of the shoot. At maturity growth parameters including plant height, spike length, spike number, total biomass and grain yield were measured from the remaining three replications. Plant height was measured from the ground level to the tip of the spike using a ruler. Spike length was measured from its base to the tip. Spike number was determined by counting the number of fertile spikes per plant using the four plant samples and number of seeds per spike was counted. Total biomass yield was determined by weighing the total above ground plant biomass before threshing to separate the grain. Grain yield was measured by taking the weight of the grains threshed from each plant after adjusting the grain moisture content to 12.5%. Straw yield was calculated as the difference between the total above ground plant biomass and grain yield. Plant tissue samples (grain and straw) from each pot were put in envelopes and oven dried at 70°C to constant weight and finely ground using a stainless steel grinder to pass through 0.5 mm mesh sieve and analyzed for nutrient concentrations.
Plant sample analysis
Plant samples were analyzed following dry ashing method, whereby the plant material is calcinated in a muffle furnace, dissolved in nitric acid, and filtered for the determination of nutrient elements. The concentration of P in the filtrate was determined by spectrophotometer using the vanado-molybdate method, and K was determined by a flame photometer, whereas Ca, Mg, and micronutrients were determined by atomic absorption spectrophotometer (Wolf, 1982). B was measured colorimetrically using Azomethine-H (Sippola and Ervio, 1977). N in the plant material was analyzed by wet-oxidation of the modified Kjeldahl procedure (Nelson and Sommers, 1973). S was determined by di-acid digestion method as described by Motsara and Roy (2008).
Statistical analysis
The data collected from greenhouse experiment and laboratory analysis were subjected to analysis of variance using SAS statistical software version 9.2 (SAS, 2008). Duncan’s multiple range tests was used to separate significantly differing treatment means at P < 0.05.
Selected physical and chemical properties of the experimental soils
Soil physical properties
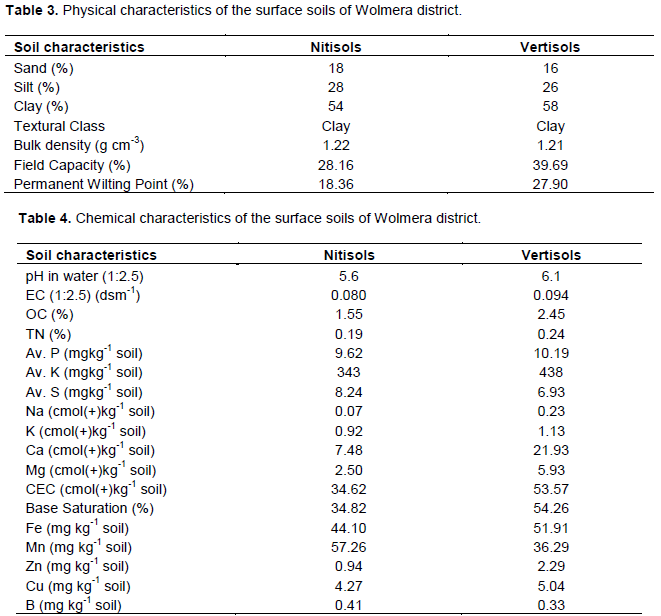
The surface soils (0-20 cm depth) of the experimental sites were dominated by clay fraction, which is 54% for Nitisols and 58% for Vertisols (Table 3). The relatively high clay content observed in this study agrees with the findings of (Abebe et al., 2013; and Hillette et al., 2015), which showed high clay contents for Nitisols and Vertisols. The high clay content indicates better water and nutrient holding capacity of the soils. The bulk density of the two soils were very similar and within the optimum range for mineral soils (1.21 - 1.22 g cm-3). According to the rate established by Handreck and Black (1984), the bulk density values of both soils do not restrict root penetration and are suitable for plant growth. The soil moisture contents at field capacity and permanent wilting point were 28.16 and 18.36% for Nitisols and 39.69 and 27.90% for Vertisols, respectively. These moisture contents are considered suitable for plant growth and soil microbial activity. However, the soil moisture content of Nitisol was lower than that of Vertisol by 40.9% at field capacity and by 51.9% at wilting point. Thus, this requires further study to elucidate weather the wheat crop response could be similar with such moisture content difference between the two soils.
Soil chemical properties
As per the ratings established by Tekalign (1991) for Ethiopian soils, the soil pH is moderately acidic for Nitisols and slightly acidic for Vertisols (Table 4), which is favorable for most crops. The electrical conductivity of both study soils were low (Table 4), indicating that these soils contain low levels of soluble salts and thus, the problem of salinity is not expected. The organic carbon and total N contents of both soils (Table 4) could be grouped under moderate range, based on the ratings of soil test values established by Tekalign (1991). However, the total organic carbon and total N contents of Vertisols were higher than that of Nitisols by 58.1 and 26.3%, respectively. Available P was low for both soils (<12 mg kg−1) according to the rating of Havlin et al. (2010), while low for Nitisols and medium for Vertisols according to Cottenie (1980), who classified <10 mg kg−1 of soil available P as low and between 10 and 17 mg kg−1 of soil as medium. The present results are in agreement with the findings of Getachew et al. (2015) and Hillette et al. (2015). Available S contents for both soil types were found to be low according to Havlin et al. (2010) but in medium range according to Horneck et al. (2011). The results are in agreement with the findings of Assefa et al. (2015a) who reported S deficiency in central highlands of Ethiopia.

The exchangeable Ca followed by Mg was the dominant cations in both soil types. Relatively higher values of exchangeable Ca and Mg were recorded for Vertisols as compared to Nitisols (Table 4). Similarly, higher value (27.7%) of exchangeable K was recorded for Vertisols as compared to Nitisols. The concentrations of basic cations (Ca, Mg and K) in the two soil types were in adequate ranges for crop production and responses of crops to applications of fertilizers containing these elements may not be expected, except for K in Nitisols (Landon, 2014). According to the rating of Landon (2014), cation exchange capacities (CEC) of the studied soils were high for Nitisols and very high for Vertisols. The very high value of CEC in Vertisols is mainly due to both high clay and organic matter content of the soil. The status of micronutrients was found to be sufficient in both soil types, except boron in both soil types and zinc in Nitisols (Table 4).
Soprtion characteristics of Nitisols and Vertisols
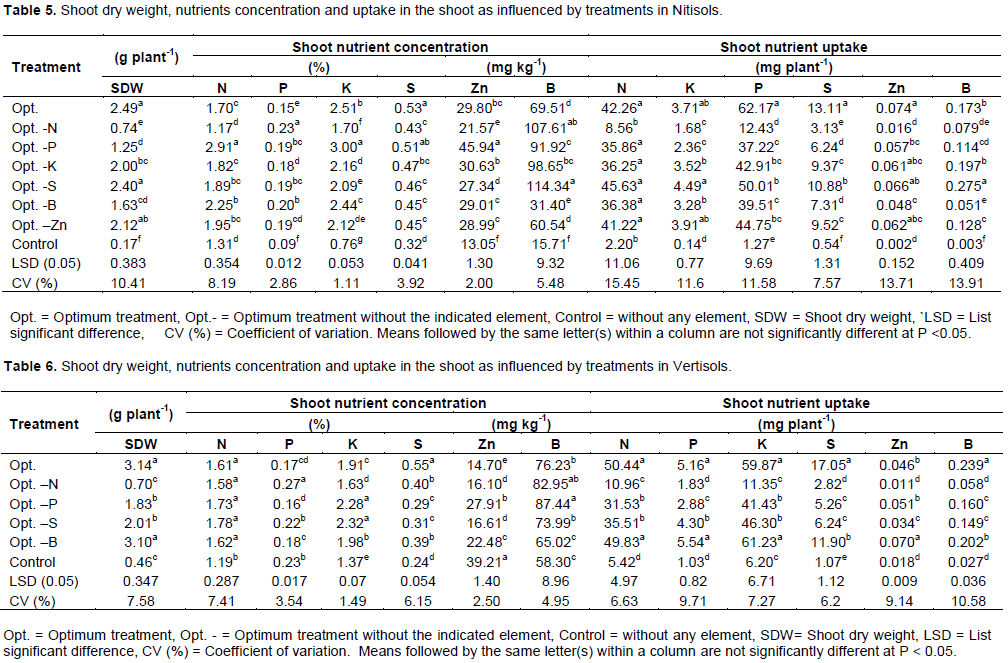
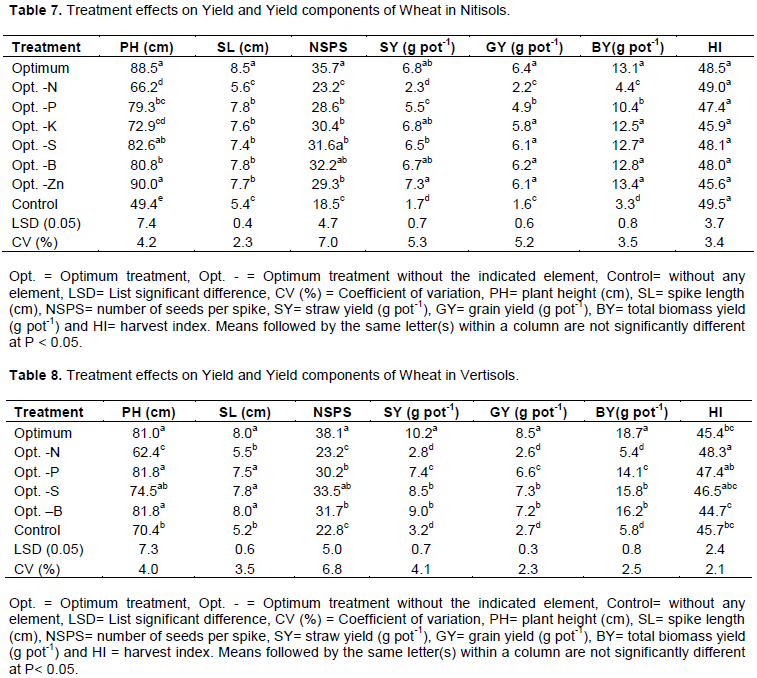
The results showed that both Nitisols and Vertisols have a relatively strong sorption capacity for P, S and B, while Nitisols also had a strong capacity for retention of Zn (Figures 2, 3, 4). Retention of K was relatively low when compared to the other plant nutrients tested in Nitisols. Considering the laboratory analyses and sorption studies P, S, B and Zn had high potential to limit yield, while there is also a probability for K to limit yield in Nitisols.
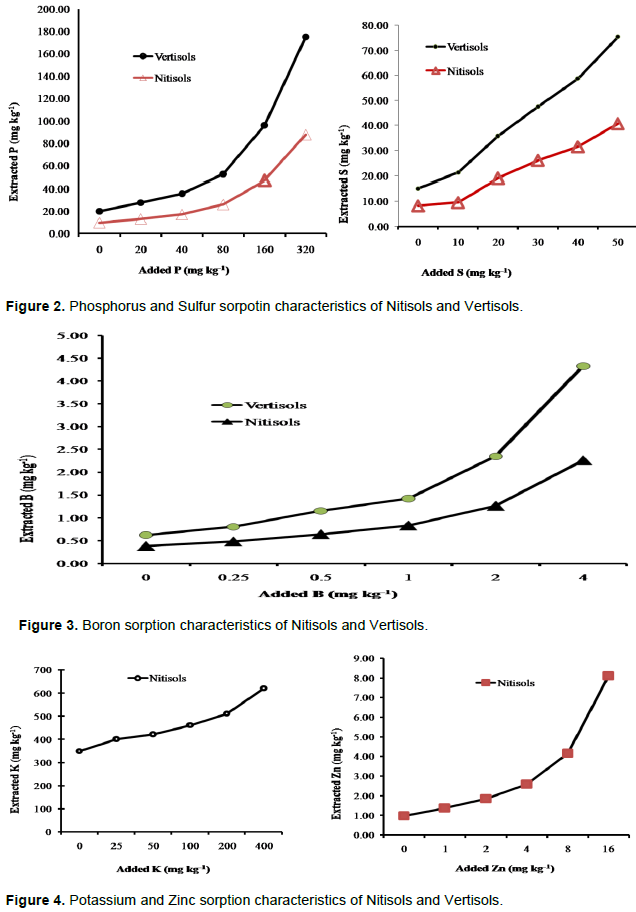
The soluble P added to the soils was strongly fixed by both soil types although the fixation is relatively greater in Vertisols as compared to Nitisols. The high clay content of the soils in this study could increase P fixation due to its high surface area. Havlin et al. (1999) reported that P fixation tends to be more pronounced and ease of P release tends to be lowest in soils with higher clay content. At low initial P addition, P retention was maximum, while at high P addition, P retention was minimum. As increment of P addition increased, P retention decreased. It can be concluded that soil P saturation can decrease adsorption, that is when the soil is saturated with P, rate of adsorption decreased. This reduction in percent of P adsorption could be due to increasing concentration of applied P causing excess P on soil adsorption sites. This results in P release into solution. Sulfur was also fixed by both soil types. However the fixation was relatively lower as compared to P fixation. The sorption might be due to low soil pH, S adsorbed in oxides and hydroxides of iron and clay minerals. Similar to phosphate, sulphate is adsorbed to clay minerals and sesquioxides, thus presence of H2PO4- may affect SO42- adsorption, because the binding strength for sulphate is not as strong as that for phosphate. The relative strength of anion retention by soil colloids varies in order: phosphate > sulphate > nitrates = chlorides (Blair, 1988).
Although the sorption results indicated that boron was highly fixed by the two soils, the fixation is greater in Vertisols (Figure 3). This could be due to relatively high pH in Vertisols than Nitisols and the types of clay mineral, which might have been dominated by kaolinite. According to Havlin et al. (1999), increasing pH, clay content, organic matter and presence of Al compounds favor H4BO4- adsorption, and B-adsorption capacity generally follows the order mica> montmorillonite > kaolinite.
The results of K sorption indicated that this nutrient was also fixed by the soil in small amount. This may be due to presence of kaolinite clay mineral in the soil. According to Havlin et al. (2010), K fixation represents the re-entrapment of K+ between the layers of the 2:1 clays, predominantly hydrous mica, but 1:1 minerals such as kaolinite do not fix K. The sorption results indicated that Zn was also highly fixed by Nitisols. This could be due to relatively low pH values and high clay minerals in this soil.
Effects of nutrient omissions on shoot dry weight
Comparison of the mean values of shoot dry weight showed that the lowest values were obtained from the control, followed by Opt.-N and Opt.-P in both Nitisols and Vertisols (Tables 5 and 6). In Nitisols shoot dry weight was reduced by 93, 70, and 50%, for the control and treatments with omission of N (Opt.-N) and P (Opt.- P), respectively, whereas the corresponding reductions were 85, 78 and 42%, respectively, in Vertisols, as compared to the optimum treatment. This indicates that N and P in both soil types were the most limiting nutrients to support good wheat growth, perhaps due to inherent poor N and P status of the experimental soils. Hence, external supply of these nutrients is required to enhance wheat growth and development. These results are in line with Hillette et al. (2015) who reported deficiency of N and P nutrients for wheat on Vertisols of central Ethiopia, and P deficiency on Nitisols of central Ethiopian highlands (Getachew et al., 2015). In addition, omission of B, K and Zn resulted in 35, 20 and 15% shoot yield reduction of wheat, respectively in Nitisols. On the other hand, S showed 36% yield reduction in Vertisols, indicating that S, K, Zn and B are also limiting nutrients to support good wheat growth in the soils and the need for external supply of these nutrients (Tables 5 and 6). These responses to the nutrients are in line with the soil analysis results (Table 4).
Effects of nutrient omissions on nutrient concentrations and uptakes
Nitrogen omission showed a significant (P<0.05) effect on nutrient concentrations in shoots and uptake of the nutrients by wheat in Nitisols (Table 5), while it only showed a significant effect on shoot nutrient uptakes in Vertisols (Table 6). The N contents varied from 1.17 to 2.91% for Nitisols and from 1.19 to 1.78% for Vertisols (Tables 5and 6), which were below the critical value of 3.6% for wheat (Engel and Zubriski, 1982). Thus, the low concentrations of N in the wheat tissue could be due to inadequate rate of N used in the present pot experiments and low soil total nitrogen content. The other most probable explanation is that the critical values of the nutrient in the plant could be soil and crop variety specific. Perhaps, growing conditions may also influence the growth performance and nutrient uptake of crops.
Although the N concentrations in all treatments for both soils were generally below the critical range, the values of N concentration and uptake in plant material of N-omitted treatments were even very low as compared to the other treatments, except the control. This signifies that N was one of the limiting nutrients in these soils.
Nitrogen concentrations in P-omitted pots were very high for both Nitisols (2.91%) (Tables 5) and Vertisols (1.73%) (Table 6). These high concentrations of N in the P-omitted pots might have resulted from the dry matter reduction that occurs when plants are under nutritional stress. But the N uptake in P-omitted treatments was relatively low, since the dry matter yield in these treatments were also very low. Differences in nutrient uptakes in both soil types were better explained by differences in dry matter production rather than by nutrient concentration in the shoot.
Phosphorus omission showed highly significant (P < 0.05) differences in shoot nutrient concentrations and uptakes of nutrients by wheat in both Nitisols and Vertisols (Tables 5 and 6). Phosphorus concentration in the plant ranged from 0.09 to 0.23% and from 0.16 to 0.27% for Nitisols and Vertisols, respectively. According to Plank and Donohue (2000) these values are below the critical range, but were close to the lower limit of sufficiency range. According to the authors’ ratings, the sufficiency range for P in wheat is between 0.2 and 0.5%. These low concentrations of P may be due to a dilution effect by high biomass production, particularly when at optimum N supply, low soil available P content and high P fixation. The phosphorus concentrations in N-omitted treatments were high (0.23%) for Nitisols (Table 5) and (0.27%) for Vertisols (Table 6). This high concentration of P in the N-omitted treatments might have resulted from the combined effects of element accumulation and dry matter reduction that occurred when plants are under nutritional stress. The P uptake in N-omitted treatments was very low, since nitrogen deficiency causes a marked reduction in uptake of P (Mengel and Kirby 2001). Additionally, the low P uptake is also due to low biomass production.
Potassium concentration and uptake in wheat shoot showed significant difference (P < 0.05) among treatments for both soils (Tables 5 and 6). The concentration of potassium in the plants ranged from 0.76 to 3.00% for Nitisols and from 1.37 to 2.32 % for Vertisols. The concentrations of potassium were above the critical range for both soils, except for the controls. According to Jones et al. (1991) the critical range of K in plant material of wheat is 1.5 to 3.0%. The low concentration of K in the controls may be due to inadequate soil available K. The uptake of K in N-omitted treatments was very low for both soils. This low uptake may be due to nitrogen deficiency, which causes a great reduction in uptake of K (Mengel and Kirby, 2001). Sulfur concentration and uptake in wheat plants showed significant differences (P < 0.05) among the treatments in both soil types (Tables 5 and 6). The concentrations of sulfur in the plant material range from 0.32 to 0.53 % for Nitisols and from 0.24 to 0.55 % for Vertisols. According to Jones et al. (1991) this is within the critical range. Low uptake of S in the control, N-omitted and P-omitted treatments may be due to low concentration of N and P, because N, P and S are component of protein molecule and omission of these nutrients reduce the uptake of S.
Zinc concentration and uptake in wheat plants were significantly (P < 0.05) different among the treatments in both soil type. Zinc concentration in wheat plants ranged from 13.05 to 45.94 mg kg-1 for Nitisols, which is below the critical for the control and within the critical range for other treatments. According to Plank and Donohue (2000), the critical range of Zn in plant material of wheat is 18 to 70 mg kg-1. Low uptake of Zn in control and N-omitted treatments may be due to low concentration of Zn in control and N in both treatments. According to Mengel and Kirby (2001), nitrogen deficiency causes a marked reduction in uptake of Zn. The result is also in agreement with the low Zn and N content of the initial soil (Table 4).
Boron concentration and uptake in the plants were significantly (P < 0.05) affected by treatments in both soils (Tables 5 and 6). Boron concentration in plants ranged from 15.71 to 114.34 mg kg-1 and from 58.30 to 87.44 mg kg-1 for Nitisols and Vertisols, respectively, which were within and above the critical range.
Effects of omissions of nutrients on plant height, spike length and number of seeds per spike
Analysis of variance revealed that plant height, spike length and number of seed per spike were significantly (P < 0.05) affected by omission of nutrients (Table 7). The higher values were measured for optimum and Zn-omitted treatments for Nitisols and for optimum, P-omitted and B-omitted treatments for Vertisols. As expected, the lowest plant heights were recorded for the controls and N-omitted treatments for both soils, indicating that vegetative growth is highly affected by omission of N. This might be attributed to the role and presence of N in many essential compounds. The most important function of N in wheat is promotion of rapid growth through increases in height, tiller number, size of leaves and length of roots (Chatterjee and Maiti, 1985). The highest spike length and number of seeds per spike were obtained from optimum treatments, whereas the least values were recorded for the controls and N-omitted treatments in both soils. The spike length for the P, S and B omission treatments were not significantly different from the optimum treatment in Vertisols (Table 8).
Effects of omissions of nutrients on straw and grain yields
The results showed that omission of some nutrients significantly (P <0.05) influenced straw yield (SY), grain yield (GY) and total biomass yields (BY) of wheat in both Nitisols and Vertisols (Tables 7 and 8). The highest grain and total biomass yields were recorded for the optimum nutrients application in both soils, although the values were statistically at par with those obtained from K, S, B and Zn-omitted treatments for Nitisols. On contrary, the highest straw yield (7.3 g pot-1) was recorded for Zn-omitted treatment for Nitisols. For Vertisols, the highest straw yield (10.2 g pot-1) was obtained from the optimum treatment, whereas the lowest values were recorded for the control and N-omitted treatments in both soils.
The total biomass yield results in Nitisols showed N and P to be the main yield limiting nutrients (Table 7). Omission of these nutrients reduced total biomass yield by 66.4 and 20.6%, respectively, as compared to the optimum treatment. Omission of N, P, S, and B from the Vertisols markedly reduced the total biomass yield (Table 8). The yield reductions due to omission of these nutrients were 71.1, 24.6, 15.5 and 13.4%, respectively, as compared to the optimum treatment indicating that nutrients, such as N and P in Nitisols and N, P, S and B in Vertisols were limiting to support good crop growth. These findings are in line with the soil analysis results (Table 4).
The highest grain yields were recorded for the optimum treatments, while the lowest grain yields were obtained from the controls and N-omitted treatments in both soils (Table 7 and 8). Grain yield increased by 75 and 68.2% due to optimum treatments over the controls in Nitisols and Vertisols, respectively. The grain yield reduction due to omission of N, P, S, and B were 65.6, 23.4, 4.7, and 3.1%, respectively, for Nitisols and 69.4, 22.4, 14.1 and 15.3%, respectively, for Vertisols. The results are in line with the findings of Assefa et al. (2015a), who reported that wheat responded well to applied N, S and P fertilizers in central highlands of Ethiopia. Eyasu (2013) also found strong wheat grain yield response to nitrogen, phosphorus and potassium (NPK) fertilizers under field condition on Rhodic Nitisols in south western Ethiopia. Similar study also showed nitrogen and phosphorus fertilizers significantly increased grain yield, biomass yield, seeds per spike, effective tiller number and plant height of bread wheat in southern Tigray (Assefa et al., 2015b). Likewise, it was observed that grain yields of different genotypes of wheat significantly increased by application of boron as compared to the control (Soylu et al., 2004; Jana et al., 2005).
The surface soils of both Nitisols and Vertisols were dominated by clay fraction and the pH was in favorable range for most crops in both soils. The nutrient elements P, K, S, B and Zn in Nitisols and P, S and B in Vertisols were below three times the critical levels of the elements. Total biomass yield in Nitisols showed N and P to be the main yield limiting nutrients. Omission of these nutrients reduced total biomass yield by 66.4 and 20.6%, respectively, as compared to the optimum treatment in Nitisols. Omission of N, P, S, and B markedly reduced the total biomass yield in Vertisols. The yield reductions due to omission of these nutrients were 71.1, 24.6, 15.5 and 13.4%, respectively as compared to the optimum treatment. Thus, omission of nutrients, such as N and P in Nitisols and N, P, S and B in Vertisols, was limiting crop growth. Grain yield increased by 75 and 68.2% due to optimum treatment over the controls in Nitisols and Vertisols, respectively. The reduction in grain yield due to omission of N, P, S, and B was 65.6, 23.4, 4.7 and 3.1% for Nitisols and 69.4, 22.4, 14.1 and 15.3% for Vertisols, respectively. Omission of K and Zn in Nitisols also causes up to 9.4% and 4.7% grain yield reduction, respectively. This indicates that order of requirement for Nitisols were N > P > K > S=Zn≈ B, whereas N > P > B ≈ S for Vertisols.
The authors have not declared any conflict of interests.
The authors dully appreciate the National Soil Testing Center (NSTC) for the financial support and provision of greenhouse and laboratory for the research and also thank the National Soil Testing Center staffs for their support and the farmers of Wolmera District for offering soil samples from their agricultural plots.
REFERENCES
|
Abebe N, Gebremedihin A, Endalkachew K (2013). Fertility status of Eutric Nitisol and fertilizer recommendation using numass in the selected areas of Jimma zone, southwestern Ethiopia. Tropical and Subtropical Agroecosystems 16(2013):487-495.
|
|
|
|
Abiye A, Tekalign M, Peden D, Diedhiou M (2004). Participatory On-Farm Conservation Tillage Trial in Ethiopian Highland Vertisols: The Impact of Potassium Application on Crop Yield. Experimental Agriculture 40(3):369-379.
Crossref
|
|
|
|
|
Abunyewa A, Asiedu EK, Ahenkorah Y (2004). Fertilizer phosphorus fractions and their availability to maize on different land forms on a Vertisol in the coastal Savana zone of Ghana. West African Journal of Applied Ecology 5:63-73.
Crossref
|
|
|
|
|
Assefa M, Johnson MRS, Nyambilila A, Tekalign M (2015a). Wheat Response to Applied Nitrogen, Sulfur, and Phosphorous in three Representative Areas of the Central Highlands of Ethiopia -I. International Journal of Plant & Soil Science 8(5):1-11.
Crossref
|
|
|
|
|
Assefa W, Yemane N, Dawit H (2015b). Planting density and nitrogen and phosphorus fertilization effect on different bread wheat (Triticumaestivum L.) genotypes in Southern Tigray, Ethiopia. World Journal of Medicine and Medical Science Research 3(2):020-028.
|
|
|
|
|
Blair JM (1988). Nitrogen, Sulfur and Phosphorus Dynamics in Decomposing Deciduous Leaf Litter in the Southern Appalachians. Soil Biology and Biochemistry 20(5):693-701.
Crossref
|
|
|
|
|
Bouyoucos GH (1951). A reclamation of the hydrometer for making mechanical analysis of soil. Agronomy Journal 43:434-438.
Crossref
|
|
|
|
|
Bremner JM, Mulvaney CS (1982). Nitrogen, In: Page AL (ed). Methods of soil analysis, part two, Chemical and microbiological properties. 2nd ed. American Society of Agronomy, Madison, Wisconsin pp. 595-624.
|
|
|
|
|
British Standards Institution (BSI) (1975). Methods of testing soils for civil engineering purpose. British standards 1377. British standards institution, Landon.
|
|
|
|
|
Bureau of Agriculture (BoA) (2013). Annual report of Agricultural activities of Wolmera Woreda. Holeta.Unpublished document. Holeta, Ethiopia.
|
|
|
|
|
Central Statistical Agency (CSA) (2018). Agricultural sample survey: Report on area and production of major crops. Statistical Bulletin 586. Addis Ababa, Ethiopia
|
|
|
|
|
Chatterjee BN, Maiti S (1985). Principles and practice of crops growing. 2nd ed. New Delhi. Oxford and 1BH Publishing P 9.
|
|
|
|
|
Cottenie A (1980). Soil and plant testing as a basis of fertilizer recommendations. FAO soil bulletin 38/2. Food and Agriculture Organization of the United Nations, Rome, Italy.
|
|
|
|
|
Debele B (1985). The Vertisols of Ethiopia: their properties, classification and management. In: Fifth Meeting of the Eastern African Sub-Committee for Soil Correlation and Land Evaluation, 5-10 December 1983 Wad Medani, Sudan. World Soil Resources Reports No. 56. FAO (Food and Agriculture Organization), Rome. pp. 31-54.
|
|
|
|
|
Desta B (1984). Diagnosis of phosphorus deficiency in Ethiopian soils. Soil Science Bulletin No. 3. JAR, Addis Ababa, Ethiopia.
|
|
|
|
|
Elias E (2002). Farmers perceptions of soil fertility change and management. In: SOS-Sahel and institute for sustainable development, Addis Ababa.
|
|
|
|
|
Elias E (2016). Soils of the Ethiopian highlands: geomorphology and properties. ALTERA Wageningen University Research Centre, the Netherlands. ISBN: 978-99944-952-6-9.
|
|
|
|
|
Engel RE, Zubriski JC (1982). Nitrogen concentrations in spring wheat at several stages of growth. Communications in Soil Science and Plant Analysis13:531-44.
Crossref
|
|
|
|
|
Ethiopia Commodity Exchange Authority (ECEA) (2008). Understanding Wheat: A Review of Supply and Marketing issues.
|
|
|
|
|
Ethiopian Agricultural Transformation Agency (ATA) (2013). Status of soil resources in Ethiopia and priorities for sustainable management. GSP for Eastern and Southern Africa. Mar 25-27, 2013, Nairobi, Kenya.
|
|
|
|
|
Eyasu E (2013). Wheat yield response to fertilizer application on rhodic Nitisols in southwestern Ethiopia. Ethiopian Journal of Natural Resources 13(2):129-140.
|
|
|
|
|
Eyasu E (2017). Characteristics of Nitisol profiles as affected by land use type and slope class in some Ethiopian highlands. Environmental Systems Research 6:20. FAO (1986). The Ethiopian highlands reclamation study (EHRS). Vol 1, In: Main Report. Food and Agriculture Organization of the UN, Rome.
Crossref
|
|
|
|
|
Getachew A, Paul NN, Michael IB, Christy van B (2015). Phosphorus Response and Fertilizer Recommendations for Wheat Grown on Nitisols in the Central Ethiopian Highlands, Communications in Soil Science and Plant Analysis.
Crossref
|
|
|
|
|
Global Agricultural Information Network (GAIN) (2019). Ethiopia-Grain and Feed Annual Report. USDA Foreign Agricultural Service, Report Number: ET 1903.
|
|
|
|
|
Haileslassie A, Priess J, Veldkamp E, Teketay D, Lesschen JP (2005). Assessment of soil nutrient depletion and its spatial variability on smallholders' mixed farming systems in Ethiopia using partial versus full nutrient balances. Agriculture, Ecosystems & Environment 108:1-16.
Crossref
|
|
|
|
|
Hailu A (2010). The effect of compost on soil fertility enhancement and yield increment under smallholder farming: A case of Tahatai Macichew district of Tigray region, Ethiopia.
|
|
|
|
|
Handreck KA, Black ND (1984). Growing media for ornamental plants and turf. Kensington, NSW, Australia: New South Wales University- Press 401 p.
|
|
|
|
|
Havlin JL, Beaton JD, Tisdale SL, Nelson WL (2010). Soil Fertility and Fertilizers, An Introduction to Nutrient Management, 7th edition. Pearson Education Inc. New Delhi.
|
|
|
|
|
Havlin JL, Beaton JD, Tisdale SL, Nilson WL (1999). Soil Fertility and Fertilizers: an Introduction to Nutrient Management. 6th ed. Prentice
|
|
|
|
|
Hall. Upper Saddle River, New Jersey.
|
|
|
|
|
Hillette H, Tekalign M, Riikka K, Erik K, Heluf G, Taye B (2015). Soil fertility status and wheat nutrient content in Vertisol cropping systems of central highlands of Ethiopia. Agriculture and Food Security 4:19.
Crossref
|
|
|
|
|
Horneck DA, Sullivan DM, Owen JS, Hart M (2011). Soil Test Interpretation Guide, Oregon State University Extension Service pp. 1-11.
|
|
|
|
|
Jana PK, Ghatak R, Sounda G, Ghosh RK, Bandyopadhyay P (2005). Effect of boron on yield content and uptake on NPK by transplanted rice at farmer's field on red and laterite soils of West Bengal. Journal of the International Academy 9(3):341-344.
|
|
|
|
|
Jones J, Wolfy B, Miller HA (1991). Plant analysis hand book. Athens: Micro-Macro Publishing.
|
|
|
|
|
Jutzi SC, Assamnew G, Haque I, Tedla A, Astatike A (1987). Intermediate technology for increased food and feed production from deep black clay soils in the Ethiopian highlands. In: Proceedings of FAO/SIDA seminar on increased food production through low cost food crop technology. Harare, Zimbabwe pp. 373-83.
|
|
|
|
|
Landon JR (2014). Booker tropical soil manual: A hand book for soil survey and agricultural land evaluation in the tropics and subtropics.
Crossref
|
|
|
|
|
Lindsay WL, Norvell WA (1978). Development of a DTPA soil test for Zn, Fe, Mn and Cu. Soil Science Society of America Journal 42:421-428.
Crossref
|
|
|
|
|
Louis EA (2010). Physicochemical characteristics of the rhizosphere soils of some cereal crops in Ambo Woreda, West Shoa, Ethiopia Maejo international Journal of Science and Technology 4(1):93-100.
|
|
|
|
|
Mamo T, Haque I, Kamara CS (1988). Phosphorus status of some Ethiopian highland Vertisols. In: Management of Vertisols in sub-Saharan Africa. Proceedings of a conference held at International Livestock Centre for Africa (ILCA), 31 August-4 September 1987 Addis Ababa, Ethiopia pp. 232-52.
|
|
|
|
|
Mamo T, Richter C, Heiligtag B( 2002). Phosphorus availability studies on ten Ethiopian Vertisols. Journal of Agriculture and Rural Development in the Tropics and Subtropics 103:177-83.
|
|
|
|
|
Mengel K, Kirby EA (2001). Principles of Plant Nutrition. Netherlands. Kluwer Academic Publishers 849 p.
Crossref
|
|
|
|
|
Motsara MR, Roy RN (2008). Guide to laboratory establishment for plant nutrient analysis. Food and Agriculture Organization of the United Nations (FAO) Fertilizer and plant nutrition bulletin-19, Rome.
|
|
|
|
|
Nelson DW, Sommers LE (1973). Determination of total N in plant material. Agronomy Journal 65:109-112.
Crossref
|
|
|
|
|
Olsen SR, Sommers LE (1982). Phosphorus. pp. 403-429. In: Page AG ed. Methods of Soil Analysis, part 2: Chemical and microbiological properties. Agronomy 9. Madison, WI.
|
|
|
|
|
Plank CO, Donohue SJ (2000). Reference sufficiency ranges for plant analysis in the southern region of the United States. Southern Cooperative Series Bulletin #394, 2000. pp. 29-32.
|
|
|
|
|
SAS Institute Inc (2008). SAS/STAT 9.2User's Guide. Cary, NC: SAS Institute Inc.
|
|
|
|
|
Sippola J, Ervio R (1977). Determination of boron in soils and plants by the Azomethine-H method. Finn. Chemistry Letters pp. 138-140.
|
|
|
|
|
Soylu S, Topal A, Sade B, Akgun N, Gezgin S, Babaoglu M (2004). Yield and yield attributes of durum wheat genotypes as affected by boron application in boron-deficient calcareous soils: an evaluation of major Turkish genotypes for boron efficiency. Journal of Plant Nutrition 27(6):1077-1106.
Crossref
|
|
|
|
|
Stocking M (1988). Tropical red soils of Africa: Fertility management and degradation. In: Nyamapfene K, Hussein J, Asumadu K (eds) The red soils of eastern and southern Africa. Proceedings of an international symposium, Harare.
|
|
|
|
|
Tan Z, Lal R, Wiebe K (2005). Global soil nutrient depletion and yield reduction. Journal of Sustainable Agriculture 26:123-146.
Crossref
|
|
|
|
|
Tegbaru B (2015). Soil Fertility Mapping and Fertilizer Recommendation in Ethiopia: Update of EthioSIS project and status of fertilizer blending plants. 2nd IPI - MoANR - ATA- Hawassa University Joint Symposium. The role of potassium in balanced fertilization. 24-26 November 2015, Hawassa University, Hawassa, Ethiopia.
|
|
|
|
|
Tekalign T (1991). Soil, plant, water, fertilizer, animal manure and compost analysis. Working Document No. 13. International Livestock Research Center for Africa, Addis Ababa, Ethiopia.
|
|
|
|
|
Van R (1993). Procedures for soil analysis 4th ed. International Soil Reference and Information Center, Netherlands.
|
|
|
|
|
Walkley A, Black IA (1934). An example of the digestion method for determining soil organic matter and a proposed modification of the chromic acid titration method. Soil Science 34: 29-38.
Crossref
|
|
|
|
|
Watson ME (2011). Boron In: Recommended Chemical Soil Test Procedures for the North Central Region. North Central Regional Research Publication No 221.
|
|
|
|
|
Wolf B (1982). A comprehensive system of leaf analysis and its use for diagnosing crop nutrient status. Communication of Soil Science and Plant Analysis 13(12):1035-1059.
Crossref
|
|