ABSTRACT
Diversity of plant species could have a different influence on urban microclimate and thermal comfort. However, the magnitude of different plant species to ameliorate urban microclimate by cooling the urban microclimate and improving thermal comfort based on their allometric properties at any particular time of the day is unknown for urban environments. This paper presents the result of a study conducted in Kenya to quantify the attenuation effects of plant species on microclimatic parameters and thermal comfort as influenced by plant allometric properties.The microclimatic and instantaneous scales were adopted to analyse in-loco degree of influence of individual tree on microclimate. The choice of species was based on the search of independently isolated mature plant species with different allometric properties. Using this criterion, four species were selected in Uhuru Park, and five species were selected in Central Park for evaluation. Relative Percentages of variation of microclimatic parameters and discomfort index as influenced by plant species were calculated. The results showed differences in performance. Ficus benjamina (12.00%) presented the highest ability to reduce thermal discomfort followed by Cassia spectabilis (10.19%),Warburgia ugandensis (8.37%), Ficus religiosa (7.86%), Callistemon citrinus (5.72%), followed by Dypsis decaryi (4.48%), Bambusa vulgaris (3.87%), Terminalia mantaly (3.91% ) and Schinus molle (2.82%).The diurnal discomfort index of all the analysed tree species ranged 20°C to 25°C from 11.00 am to 18.00 pm, which meant that discomfort was expressed by < 50% of the population who sat under the shade.The differences in microclimate control are due to specific tree allometric properties of the analysed and the individual sample species, like structure and density of the treetop, size, shape and colour of leaves, tree age and growth.
Key words: Discomfort index, environmental parameters, scale, plant species.
Humans have actively managed and transformed the world’s landscapes for millennia in response to the industrial revolution. The extent of landscaping and the trends associated with such activities affecting the land surface have accelerated (Alavipanah et al., 2015).
As urbanisation takes place, extreme Land Use and Land Cover (LULC) changes occur in the landscape. Infrastructure and concrete surfaces replace open land and natural vegetation cover surfaces of an area (Ali et al., 2017; Singh et al., 2017). Urbanisation leads to the formation of urban heat islands (UHI) (Ali et al., 2017), the phenomenon whereby urban regions experience warmer temperatures than their rural surroundings (Santamouris et al., 2017). Most of the tropical cities experience higher temperatures in their urban core than in the surrounding suburban and rural areas. One of the primary cause of temperature increase, as well as changes of behaviours in tropical cities, is the lack of appropriate landscape treatment within urban green spaces (Warren, 2012). These impacts lead to undesirable consequences such as reduced thermal comfort and increased the potential for health impairment of urban populations (Briscoe, 2017). The thermal comfort of city inhabitants is directly (Harlan et al., 2006; Vieira De Abreu-Harbich et al., 2015) and indirectly (Stafoggia et al., 2008) affected by UHI (Alavipanah et al., 2015). The consequences of UHI aggravate social and environmental quality in cities, which collectively contributes to global challenges (Alavipanah et al., 2015).
Several studies focusing on trees and their benefits to the urban climate have been published. Remote sensing studies of the vegetated surface in general and urban green vegetation, in particular, showed cooler temperature than the impervious surface of cities (Alavipanah et al., 2015). Vegetation have significant ability to modify urban microclimate (Santamouris et al., 2017; Vieira De Abreu-Harbich et al., 2012, 2015; Zhao et al., 2017),by countering the urban heat island effects (Alavipanah et al., 2015; Masson et al., 2014; Mcpherson et al., 2016), resulting in improved thermal comfort (Santamouris et al., 2017; Vieira De Abreu-Harbich et al., 2012, 2015; Zhao et al., 2017) and in the social cohesion and well-being of urban life (Alavipanah et al., 2015).
Diversity of plant species could have a different influence on urban microclimate and thermal comfort (Shashua-Bar et al., 2011). Tree canopy is a significant component that can contribute to local microclimate modification because it can attenuate solar radiation and control wind speed (Vieira De Abreu-Harbich et al., 2012). However, few studies quantify these benefits. Also, the magnitude of different plant species to ameliorate by cooling the urban microclimate and improving thermal comfort based on their allometric properties at any particular time of the day is unknown for urban environments. In addition, a time series analysis on local and regional scales where the cooling effects of different plant species have been studied is still lacking. Therefore, all kinds of plant species have continued to be used to create urban green spaces in Nairobi city without any prior knowledge on their ability to provide mitigation and adaptation to the changing urban climate and their contribution to improving the thermal conditions to the urban dwellers.
The study explored the relationship between plant species canopy allometric properties and environmental parameters (such as ambient temperatures and relative humidity, globe temperature, infrared and speed of wind) and confirmed the importance of plant species canopy and height characteristics on local microclimate. This study could be critical because of its substantial implications for urban planners and risk managers in green city plans and schemes. The goal of this paper was to quantify the attenuation effects of plant species on microclimatic parameters and thermal comfort as influenced by plant allometric properties.
Site description
The study was carried out in Uhuru Park and Central Park which are located in Nairobi city, Kenya. Geographically these are located at longitude 36.816670, latitude -1.283330 and altitude of 1,684 m above sea level.The two parks are the most popular recreational parks adjacent to the central business district of Nairobi. The parks were opened to the general public in 1969 and contained several recreation scenes. The extensive lawn, shade trees, and well-tendered gardens make them the most attractive green spaces in the city, drawing throngs of the city residents on weekends and public holidays.The vegetation found in the city’s parks arose as a result of plantations.The climate is classified as lower Highland Tropical, with sub-humid woodland vegetation type. The city’s climate favours the growth of trees. February is the hottest month in Nairobi with an average temperature of 31°C, and the coldest is July at 17°C (Ongoma et al., 2016; Ongoma et al., 2013). The air temperature in both Uhuru and Central park during these days ranged between 22.5° C and 33.7°C, whereas the relative humidity ranged between 42.3% and 64.5%. Cloud condition was mostly clear and partly cloudy sky.
Measurement of environmental parameters
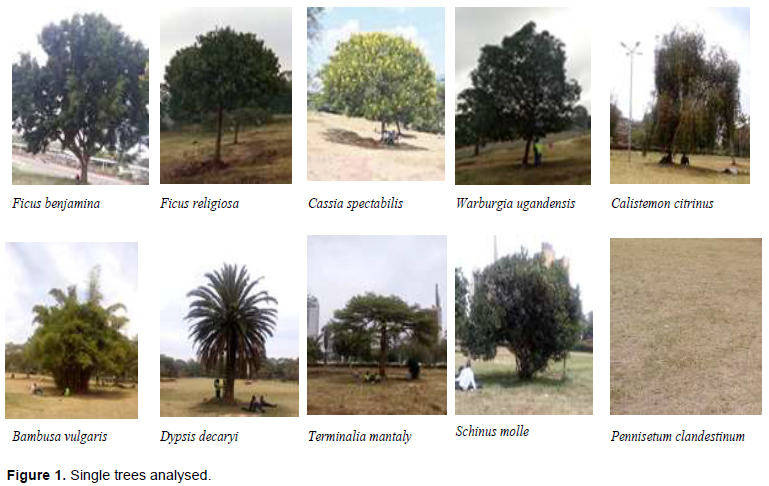
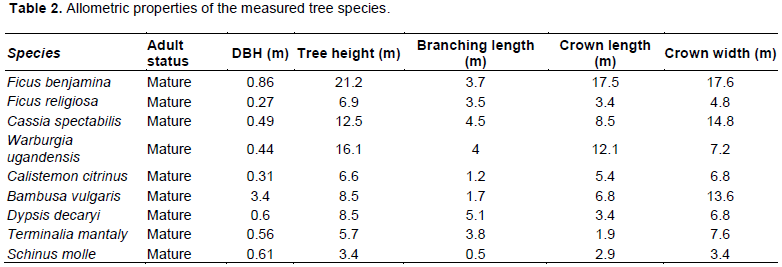
The microclimatic and instantaneous scales were adopted to allow analysing in-loco degree of influence through mitigation of ambient temperature, globe temperature, relative humidity, infrared and speed of wind on an individual of trees (Vieira De Abreu-Harbich et al., 2012; 2015). The choice of the species was based on the search of independently isolated mature plant species having different canopy sizes and shapes and plant height categories. All trees were physically described by measuring height, canopy diameter, branching length, crown length and crown width (Table 2).The studied plant species (Figure 1) included:Ficus benjamina (weeping fig), Ficus religiosa (pippala tree), Cassia spectabilis (cassia, yellow shower), Warburgia ugandensis (East African greenheart), Callistemon citrinus (bottle brush), Bambusa vulgaris (Bamboo), Dypsis decaryi (Triangle palm), Terminalia mantaly (Madagascar Almond), Schinus molle (Peruvian pepper) and Pennisetum clandestinum (Kikuyu grass).

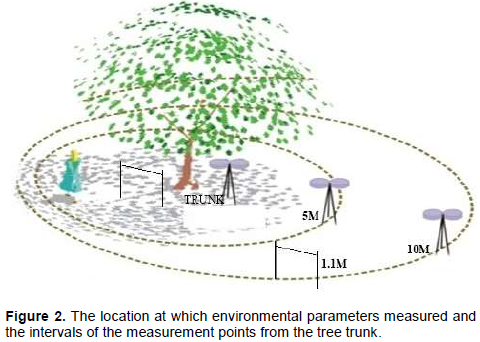
Data were recorded every 10 min for 12 h from 07.00 am to 19.00 pm in different distances (Trunk, 5m, and 10m) (Figure 2) of each of the selected plant species and in the open (grass) (Vieira De Abreu-Harbich et al., 2012), from day 47 to day 59 of the year 2017. Measurements in open (grass) were used as a control. Ambient temperatures (°C), globe temperature (°C), relative humidity (%) speed of wind (M/S) and infrared (°C) were measured at the height of 1.1 m from the ground. In each set, there was one Wet Globe, Bulb Temperature (WGBT) recorder, model Testo 175- T2 for measurement of ambient temperature, Globe temperature and relative humidity: One Testo 830-T1 Infrared thermometer for measurement of infrared, and one Testo 410-1 pocket-sized vane anemometer for measuring the speed of wind. Continuous sky observation was done to record cloud conditions Since measurements of microclimatic parameters were carried out on different days, measurements in the sun (open field covered by grass) were used as normalisation parameter to quantify the attenuation effect of each plant species. The following expression was used to calculate the relative variation of environmental parameters as influenced by the plant species:
RVtA= [(tAsun-tAshade)/tAsun] ×100% 1
Where:
RVtA = relative variation of ambient temperature (%)
tAsun = ambient temperature at the sun (ºC)
tAshade = ambient temperature under the canopy of the analysed tree (ºC)
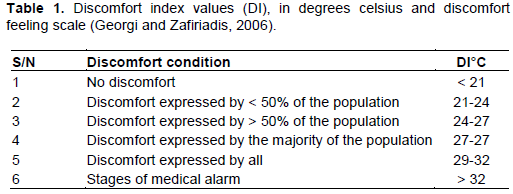
Similar calculations were carried out for globe temperatures, infrared and relative humidity (Lotufo Bueno-Bartholomei and Labaki, 2003). To calculate thermal comfort as influenced by the tree species due to specific bioclimatic conditions, thermal discomfort index (DI) as influenced by the tree species was calculated from temperature and relative humidity using the following expression:
DI = TEM − 0.55 (1 − 0.01 HUM) (TEM − 14.5) °C 2
Where:
DI = Discomfort Index DI (°C ).
TEM = Air temperature (°C).
HUM = Relative humidity (%)(Georgi and Zafiriadis, 2006) (Table 1).
The following equation calculated the reduction percentage of the discomfort index achieved in the shade of each tree species:
dDI% = [(DIsun-DIshade)/DIsun]×100% 3
Where:
dDi=diviation in Discomfort index (%)
DIsun= Discomfort index in the sun (°C)
DIshade=Discomfort index in the tree shade (°C)
The use of the discomfort index in this study focused on the comparison of the index as influenced by the allometric properties of the tree species. Therefore, its use was not related to the discomfort expressed by people, but the percentage of discomfort reduction achieved as influenced by plant species (Georgi and Zafiriadis, 2006).
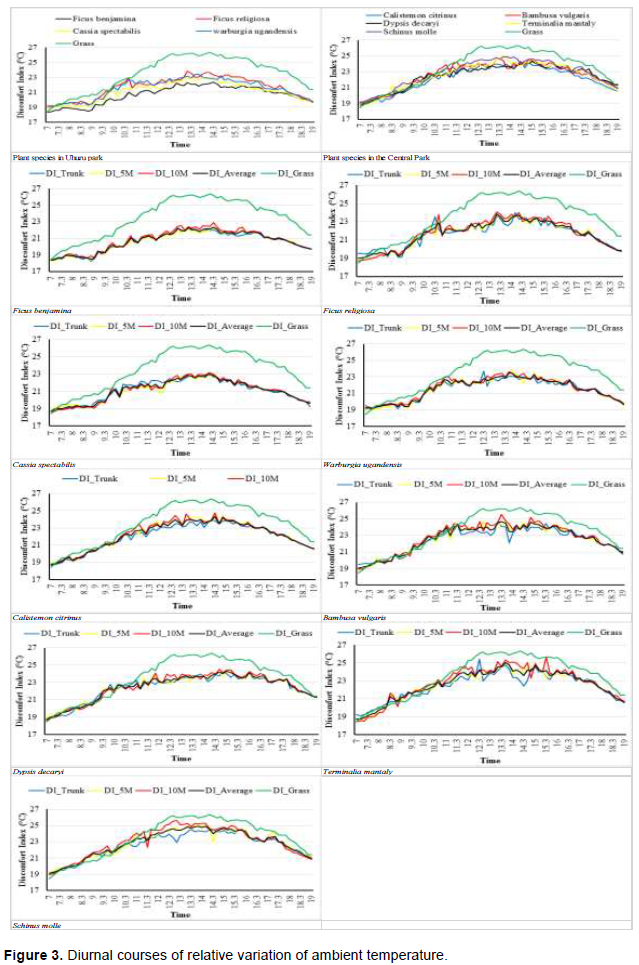
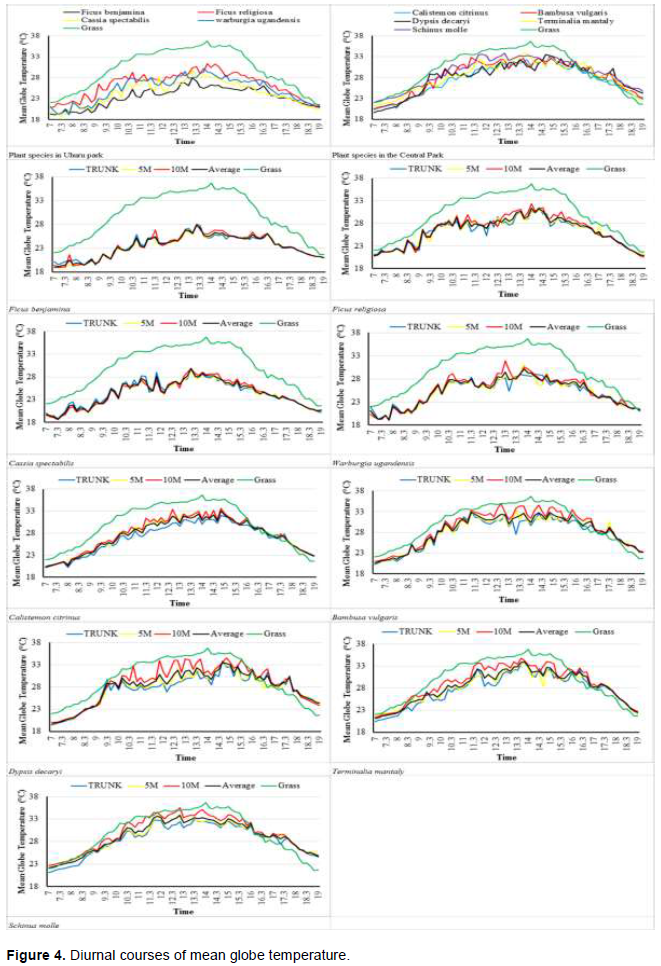
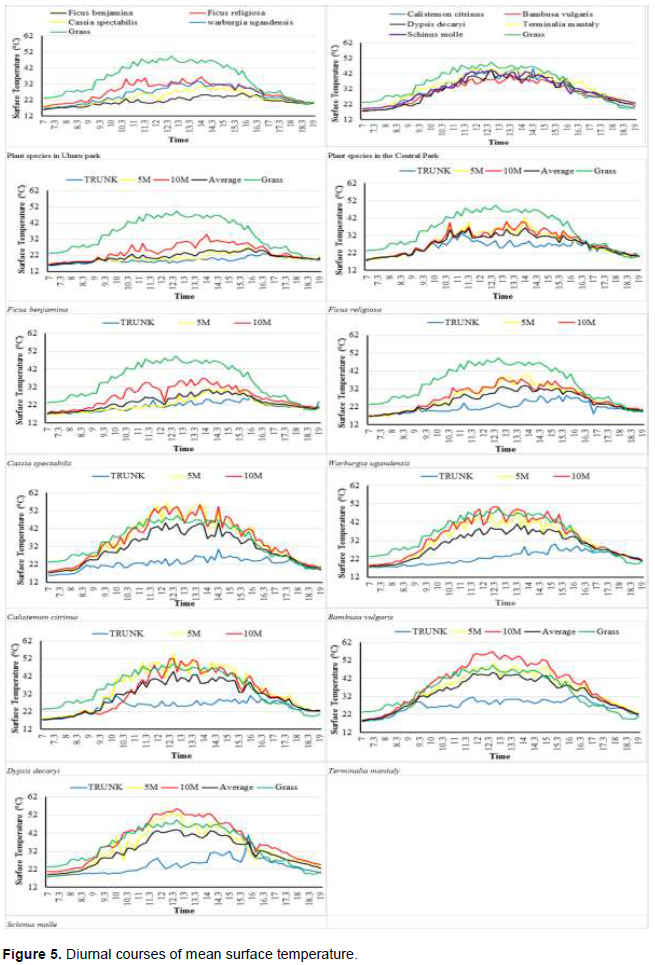
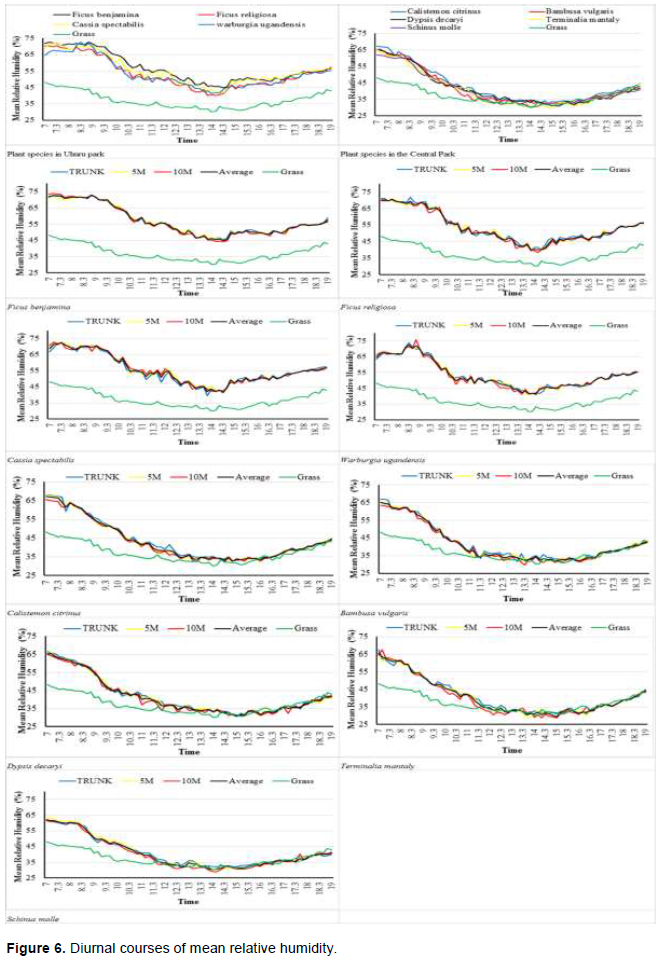
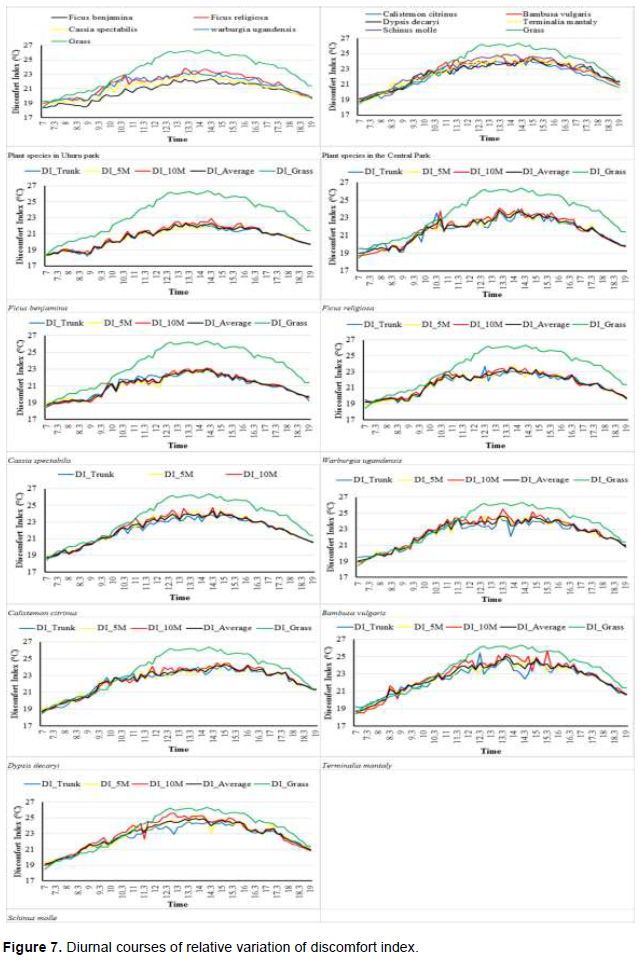
Table 1 shows allometric properties of the measured plant species. Results of diurnal courses of relative variation of ambient temperature, globe temperature, surface temperature, relative humidity and discomfort index as influenced by single isolated tree species in both Uhuru Park and Central Park based on data from field measurement from day 47 to day 59 of the year 2017 are shown in Figures 3,4,5,6 and 7 respectively. Ficus benjamina had the most significant diameter at breast height, tree height and crown width followed by Cassia spectabilis, Warburgia ugandensis and Ficus religiosa, respectively. However, Ficus benjamina had the most significant crown height followed by Warburgia ugandensis, Cassia spectabilis and Ficus religiosa respectively. In central park, clustered Bambusa vulgaris had the most significant diameter in breadth height, followed by Dypsis decaryi, Schinus molle, Terminalia mantaly and Callistemon citrinus, respectively. Bambusa vulgaris had the most significant tree height while Schinus molle was the shortest plant. Terminalia mantaly had the smallest crown height. The behaviour of the globe temperatures, surface temperature, relative humidity and discomfort index variations was similar to the values of ambient temperature attenuations, as it can be observed from figures 4, 5, 6 and 7.


It can be seen that trunk temperatures were the smallest, followed by the 5 m and 10 m temperatures in all the single isolated trees. The four plants measured in Uhuru Park presented results as follows: F. benjamina yielded the highest values for the attenuation of ambient temperature (20.07%), followed by C. spectabilis (17.77%). F. religiosa and W. ugandensis produced the lowest ambient temperature attenuation (15.2% and 14.62%), respectively. The five plants measured in central park produced the following results: C. citrinus (9.01%), followed by D. decaryi (7.02%), B. vulgaris (6.78%), T. mantaly (5.91%) and S. molle (4.77%).
F. benjamina presented the largest mean relative attenuation of globe temperature (22.17%) followed by C. spectabilis (19.03%), F. religiosa (16.25%) and W. ugandensis (12.60%). C. citrinus produced a mean relative attenuation effect of 8.73%, followed by D. decaryi(6.84%), B. vulgaris(5.98%), T. mantaly (5.94%) and S. molle (3.06%). F. benjamina presented the highest relative attenuation of surface temperature (Figure 5) with mean variation value of 40.26%, followed by C. spectabilis (33.86%), F. religiosa (28.50%) and W. ugandensis (23.13%). In central park, C. citrinus produced a relative attenuation effect of 16.01%, followed by D. decaryi (12.66%), B. vulgaris(11.80%), S. molle(10.0%) and T. mantaly (4.7%).
The diurnal courses of mean relative humidity (Figure 6) for different plant species presented results as follows: F. benjamina produced the highest relative attenuation of relative humidity with mean variation value of 54.02% followed by C. spectabilis (50.21%), F. religiosa (44.75%) and W. ugandensis (44.50%). C. citrinus (17.05%), D. decaryii (12.70%), B. vulgaris (12.43%), S. molle(10.58%) and T. mantaly (10.19%).
It can be observed that the species F. benjamina showed the highest reduction percentage of thermal discomfort index (12.00%), followed by C. spectabilis (10.19%), W. ugandensis (8.37%) and F.religiosa (7.86%). Plants in central park showed the lowest relative variation of reduction percentage of discomfort index as follows; C. citrinus (5.72%), D. decaryi (4.48%), B. vulgaris(3.87%), T. mantaly (3.91%) and S. molle(2.91%) (Figure 7). The diurnal discomfort index of all the analysed tree species in Uhuru Park ranged 20°C to 25°C from 11.00 am to 18.00 pm, which meant that discomfort was expressed by < 50% of the population who sat in the shades of the respective plant species (Georgi and Zafiriadis, 2006). There was no significant difference between discomfort index at the trunk, 5m and 10 m. however, the different plant species expressed specific differences However, there was thermal discomfort index variation amongst the studied plant species.
These results confirmed variation in microclimate and thermal comfort by different tree species. Plants with massive canopy structure and dense leaves attenuated environmental parameters more effectively and resulted in improved thermal comfort via higher rates of transpiration and synergistic thermal effects of leaf physical traits. These findings confirm the results of Lotufo Bueno-Bartholomei and Labaki (2003) and Bueno- and Lin et al. (2010).
The variation in performance could be attributed to interspecific variation in the crown dimensions, mainly by crown width and crown area, and specific allometric characteristics of the analysed tree species like structure and density of the treetop, size, shape, and colour of leaves, tree age, and growth. Tree canopy temperature is a proxy for the energy balance between the leaf interior and the ambient environment. Incoming solar radiation absorbed by a leaf is partly used for biochemical reactions such as photosynthesis, but a larger proportion is converted to the thermal energy of leaves. Plant canopy temperature is predominately determined by ambient temperature but also regulated by leaf physical traits and transpiration. When plants are exposed to hot conditions, they can reduce the amount of accepted radiation through reflection and movement and could dissipate excessive heat via radiation emission, heat convection, and transpiration. However, the relative contribution of each of these processes differs greatly between different plant species (Lin et al., 2017).
Tree canopies create microclimates through interception of solar radiation and evapotranspiration thereby modifying the heat balance of surrounding environment. Radiation interception is owed to shade counteractive action of short and long-wave radiation from the upper half of the globe while evapotranspiration is owed to water content conveying limit of the soil–tree-air framework. Plant leaves and branches reduce the amount of solar radiation that reaches the area below the canopy of a tree or plant (Fahmy et al., 2010). Plants also cause the diurnal patterns of cooler daytime temperatures and warmer nighttime temperatures as a result of trapped heat and humidity within urban canopy layer if compared with the rapid nocturnal cooling of open areas (Coutts et al., 2016). The amount of sunlight transmitted through the canopy varies based on plant species.
Large tree species with thicker trunks support broader and less deep crowns with greater branching height than smaller ones. Trees with large canopies and dark green leaves such as F. benjamina presented the greatest attenuation of environmental parameters, while small canopy size such as F. religiosa produced the lowest attenuation effect. Medium sized tree canopies such as C. spectabilis and W. ugandensis presented relatively medium attenuation of environmental parameters. F. benjamina has a plagiotropic trunk and large spherical shaped canopy that offers a large surface area to solar radiation during transpiration and also produces significant shading effect underneath, as compared to F. religiosa which has a small spherical shaped canopy.
However, the interaction between canopy allometric properties makes it difficult to measure the thermal impact of physical traits of trees and transpiration separately for individual plants. Some previous studies only analysed the effects of one or several leaf physical traits on leaf temperature (Monteiro et al., 2016), while there are many physical traits that could be associated with leaf temperature. In addition, the thermal effects of all the physical traits may differ from the individual contribution of a trait.
Ambient temperatures must be neither too low nor too high to reduce individual vulnerability and maintain a comfortable thermal environment. Body temperature, which is approximately 37°C, is kept through the intake of calories from food and heat exchanges with the immediate surroundings according to the heat transmission mechanisms (Matzarakis and Amelung, 2008).
Human thermal comfort is subjective and is based on contextual parameters such as activity level, physiological and psychological acclimatisation to heat, clothing worn, air temperature, the temperature of the surrounding surfaces, solar radiation as well as air flow and relative humidity of the air. Thermal comfort is, therefore, unique to each and it is impossible to define a type of thermal environment that meets everyone’s requirements. However, the acceptable temperature range for a high percentage of people is between 20 and 27°C with an optimal humidity rate of 35% to 60% (Shooshtarian and Ridley, 2016) (Table 2; Figure 1 to 7).
In urban green spaces, different plant species have different abilities to improve thermal comfort, mitigate air temperature and control relative humidity thereby ensuring a better quality of life for people. The tree canopy type is a significant component that can contribute to thermal comfort, through attenuation of solar radiation and control of wind speed. Tree microclimate depends on canopy anatomical structure (leaf mass, size, shape, angle, reflectance), physical (incoming energy, air temperature, the wind) and physiological (transpiration, stomatal conductance) factors. Trees with larger canopies tend to cast more shade and deliver greater thermal comfort than smaller ornamental species. The diversified effects of plant species on urban microclimate can be used efficiently to improve thermal comfort in urban green spaces (Lotufo Bueno-Bartholomei and Labaki, 2003) of tropical cities such as Nairobi. Studying the strategies of tree temperature regulation in different plant species could improve the understanding of urban planting design and the adaptation of plants to various environmental functions. The results demonstrate that a large and dense tree canopy structure could enhance the cooling capacity of plants via increasing transpiration capacity and synergic physical properties. Since tree planting is a practical and inexpensive solution to urban heat island. The species used for urban planting must be chosen cautiously to ensure good foliage density, which, when the tree is mature, will filter out at least 60% of solar radiation.
The authors have not declared any conflict of interests.
Eurafrica Project supported this research. We thank our colleagues from Institute of Meteorology, Freie Universität Berlin (FUB) who provided insight and expertise that greatly assisted the research. We thank our colleagues from the Department of Horticulture, Jomo Kenyatta University of Agriculture and Technology (JKUAT) for technical assistance during measurement campaigns and for comments that significantly improved the manuscript.
REFERENCES
|
Alavipanah S, Wegmann M, Qureshi S, Weng Q, Koellner T (2015). The role of vegetation in mitigating urban land surface temperatures: A case study of Munich, Germany during the warm season. Sustainability (Switzerland), 7(4):4689-4706.
Crossref
|
|
|
|
Ali SB, Patnaik S, Madguni O (2017). Microclimate land surface temperatures across urban land use/ land cover forms. Global Journal of Environmental Science and Management, 3(3):231-242.
|
|
|
|
|
Briscoe D (2017). Transplanting Heat Island Effects in Tokyo. Upland - Journal of Urban Planning, Landscape & Environmental Design, 2(1):153-163.
|
|
|
|
|
Coutts AM, White EC, Tapper NJ, Beringer J, Livesley SJ (2016). Temperature and human thermal comfort effects of street trees across three contrasting street canyon environments. Theoretical and Applied Climatology, 124(1-2):55-68
Crossref
|
|
|
|
|
Fahmy M, Sharples S Yahiya M (2010). LAI based trees selection for mid-latitude urban developments: A microclimatic study in Cairo, Egypt. Building and Environment, 45(2):345-357.
Crossref
|
|
|
|
|
Georgi NJ, Zafiriadis K (2006). The impact of park trees on microclimate in urban areas. Urban Ecosystems, 9(3):195-209.
Crossref
|
|
|
|
|
Harlan SL, Brazel AJ, Prashad L, Stefanov WL, Larsen L (2006). Neighbourhood microclimates and vulnerability to heat stress. Social Science and Medicine, 63(11):2847-2863.
Crossref
|
|
|
|
|
Lin H, Chen Y, Zhang H, Fu1 P, Fan Z (2017). Stronger cooling effects of transpiration and leaf physical traits of plants from a hot dry habitat than from a hot wet habitat. Functional Ecology, British Ecological Society, 31(12):2202-2211
Crossref
|
|
|
|
|
Lin TP, Matzarakis A, Hwang RL (2010). Shading effect on long-term outdoor thermal comfort. Building and Environment, 45(1):213-221.
Crossref
|
|
|
|
|
Lotufo Bueno-Bartholomei C, Labaki LC (2003). How much does the change of species of trees affect their solar radiation attenuation? Retrieved from http://meteo.geo.uni.lodz.pl/icuc5/text/O_1_4.pdf
|
|
|
|
|
Masson V, Marchadier C, Adolphe L, Aguejdad R, Avner P, Bonhomme M, Zibouche K (2014). Adapting cities to climate change: A systemic modelling approach. Urban Climate, 10:407-429.
Crossref
|
|
|
|
|
Matzarakis A, Amelung B (2008). Physiological equivalent temperature as an indicator for impacts of climate change on thermal comfort of humans. In. Seasonal forecasts, climatic change and human health. Springer, Dordrecht. pp. 161-172.
Crossref
|
|
|
|
|
Mcpherson EG, Van Doorn NS, Peper PJ (2016). Urban Tree Database and Allometric Equations. Gen. Tech. Rep. PSW-GTR-253. Albany, CA: U.S. Department of Agriculture, Forest Service, Pacific Southwest Research Station, 86 p.
|
|
|
|
|
Monteiro MV, Blanusa T, Verhoef A, Hadley P, Cameron RW (2016). Relative importance of transpiration rate and leaf morphological traits for the regulation of leaf temperature. Australian Journal of Botany, 64:32-44.
Crossref
|
|
|
|
|
Ongoma V, Muange PK, Shilenje ZW (2016). Potential effects of urbanization on urban thermal comfort, a case study of Nairobi city, Kenya: A review. Geographica Pannonica, 20(1):19-31.
Crossref
|
|
|
|
|
Ongoma V, Muthama, JN, Gitau W (2013). Evaluation of urbanization on urban temperature of Nairobi City, Kenya. Global Meteorology, 2(e1):1-5.
Crossref
|
|
|
|
|
Santamouris M, Haddad S, Fiorito F, Osmond P, Ding L, Prasad D, Wang R (2017). Urban Heat Island and Overheating Characteristics in Sydney, Australia. An Analysis of Multiyear Measurements. Sustainability, 9(12):712.
Crossref
|
|
|
|
|
Shashua-Bar L, Pearlmutter D, Erell E (2011). The influence of trees and grass on outdoor thermal comfort in a hot-arid environment. International Journal of Climatology, 31:1498-1506.
Crossref
|
|
|
|
|
Shooshtarian S, Ridley I (2016). The effect of individual and social environments on the user's thermal perceptions of urban educational precincts. Sustainable Cities and Society, 26:119-133.
Crossref
|
|
|
|
|
Singh P, Kikon N, Verma P (2017). Impact of land use change and urbanization on urban heat island in Lucknow city, Central India. A remote sensing based estimate. Sustainable Cities and Society, 32:100-114.
Crossref
|
|
|
|
|
Stafoggia M, Schwartz J, Forastiere F, Perucci CA (2008). Does Temperature Modify the Association between Air Pollution and Mortality? A Multicity Case-Crossover Analysis in Italy. American Journal of Epidemiology, 167(12):1476-1485.
Crossref
|
|
|
|
|
Vieira De Abreu-Harbich L, Labaki L C, Matzarakis A, Abreu-harbich LV De, Labaki LC, Matzarakis A (2012). Different Trees and configuration as microclimate control strategy in Tropics. ICUC8 – 8th International Conference on Urban Climates, 6th-10th August, 2012, UCD, Dublin Ireland.
|
|
|
|
|
Vieira De Abreu-Harbich L, Labaki LC, Matzarakis A (2015). Effect of tree planting design and tree species on human thermal comfort in the tropics. Landscape and Urban Planning, 138:99-109.
Crossref
|
|
|
|
|
Warren CMJ (2012). Heat Islands; Understanding and Mitigating Heat in Urban Areas. Property Management, 30(1):105-106.
Crossref
|
|
|
|
|
Zhao X, Li G, Gao T (2017). Research on Optimization and Biological Characteristics of Harbin Trees Based on Thermal Comfort in Summer. Procedia Engineering, 180:550-561.
Crossref
|
|