Full Length Research Paper
ABSTRACT
Knowledge on performance of genotypes and interrelationships among traits is very important for sugarcane breeding programmes. The objectives of this study were to assess the phenotypic relationship among 49 sugarcane genotypes and the inter-relationships among traits considered. The cluster analysis demonstrated that the 49 sugarcane genotypes studied were clustered into nine groups and were highly different for Pol in juice, cane yield (tons ha-1m-1), number of tillers (ha-1), purity% and milleable stalk population (ha-1). The relationship among sugarcane genotypes was not dependent on geographic origin, suggesting that a high proportion of total genetic variation was retained within the groups of origin and active genetic ex-change was found between different origins. The principal component analysis indicated that cane yield, milleable stalk height and milleable stalk diameter were highly correlated with sugar yield while the correlation of quality traits with sugar yield was weak. In contrary, path and multiple regression analysis revealed that cane yield, recoverable sucrose percentage (%) and Pol contribute more to the variability of sugar yield; these are very important traits for high sugar yield that should be considered in sugarcane breeding programmes. Moreover, milleable stalk height and milleable stalk population via cane yield and Brix, Pol, purity and number of internodes via recoverable sucrose percentage had high indirect effects on sugar yield suggesting these traits should also be given consideration during selection for high sugar yield. Generally, similar and adequate information was generated following the use of cluster, principal component, linear discriminant, path coefficient and multiple regression analyses indicating the use of multivariate analyses was successful and results of the study were more substantial to give concrete recommendation.
Key words: Clusters, genotypes, multiple regression, path coefficient, phenotypic correlation.
INTRODUCTION
Sugarcane (Saccharum officinarum L.) is an important industrial crop and global major source of energy and is a major crop in most parts of tropical and subtropical regions (Khan et al., 2013). The increasing multiple use of sugarcane necessitates a strong breeding program that generates gene pools that enables identification of sugarcane genotypes with multiple uses. Hence, to have successful genetic improvement of sugarcane genotypes for multiple purposes, efficient and diversified selection procedures have to be followed. Selection will be efficient if the procedures consider many traits simultaneously during evaluation of sugarcane genotypes. As the appropriate methods that provide accurate evaluations and estimation of genetic diversity depend on genetic variation, sampling methods, the magnitude of data sets, and the statistical tools applied in the data analysis (Mohammadi and Prasanna, 2003), multivariate statistical analysis techniques like principal component analysis (PCA) and cluster analysis techniques are very important to study genetic diversity of sugarcane.
However, prior to starting selection, the genetic diversity among the genotypes need to be assessed using morphological and agronomic traits as the genetic diversity assessment is a basic tool to determine whether there could be enough genetic pool that enables generating desirable genes and genotypes. The information about the status of the genetic pool of a crop (introduction, existing commercial varieties and germplasm) using cluster and other analyses, determines the success of selection efficiency of breeding sugarcane (Malik et al., 2010). The quantified gene pool could be used for future breeding purposes such as combination and introgression of genes (Mohammadi and Prasama, 2003).
After the magnitude and pattern of existing genetic base of the crop determined for traits of interest, the most important thing most sugarcane breeding programs deserves to do is to follow efficient selection procedures that utilize both direct and indirect methods to improve quantitative traits. The method of path coefficients was first used for yield component analysis by Dewey and Lu (1959), and subsequently has become a common method to examine breeding strategy in the ‘whole variety’ context. As yield is affected by numerous components and is a complex resultant character, the internal adjustments between components causes’ increment in one component and causes decrement in the other, causing no change in resultant yield (Wen and Zhu, 2005) and causal pathways existed when independent variables are co-related (Kozak et al., 2007).
Ong’ala et al. (2016) recommended PCA and linear discriminant analysis to identify representative traits for phenotypic characterization of sugarcane, and thereby to select superior clones in the breeding process. During phenotypic evaluation of sugarcane clone, many traits are simultaneously evaluated, which are often genetically linked. It is costly to evaluate all the traits which probably may be interrelated and does not ensure optimal selection gains. Path coefficient analysis is one of the most important tool that enable breeders to handle both selection methods simultaneously (Sidwell et al., 1976).
Moreover, it enables to have an insight in to the correlation of these effects with the actions of additive and non-additive genes that govern the traits of interest.
High sugar yield are obtained from cane yield and sucrose content (Terzi et al., 2009) and therefore cane yield and sucrose content and their interaction are important parameters for developing superior genotypes (Zhu et al., 2000; Chohan et al., 2007). Several reports clarify about the relationship of cane yield components with cane yield and cane quality traits. For example, Ahmed et al. (2010) reported positive correlation between cane yield and its components (number of milleable stalks/m2, milleable stalk height internodes/stalk and single weight) but negative association with milleable stalk diameter, Pol in juice and purity. Similarly, Tyagi and Lai (2007) reported that the weight of milleable stalks contributed high direct effect on cane yield followed by milleable stalk, height, number and thickness. Ei-Shafi and Ismail (2006) reported to use multiple regressions model and reported that the main contributors for sugar yield were cane yield, sugar recovery percentage and milleable stalk diameter. Generally, the results of different studies showed discrepancies to the level of sugar yield and cane yield. This phenomenon necessitates successive studies to be conducted to determine the relationship and association of the traits to increase the efficiency of selection.
One of the major sugarcane production constraints in Ethiopia is the lack of high yielding and stable sugarcane varieties across sugar estates. Based on these problems, the Ethiopian Sugarcane Research Sector is introducing, collecting and recycling sugarcane materials to increase the genetic base and efficient use of gene pool of the crop. However, under Ethiopian sugarcane research conditions, the existing diversity among most of the materials is not assessed and selection strategies that help to increase the selection efficiencies of traits have not been well developed. Moreover, multivariate analysis that helps to develop efficient selection strategies have not been efficiently exploited. Therefore, the objectives of this study were to assess the magnitude of genetic divergence among sugarcane genotypes and to study the interrelationships among traits using multivariate techniques.
MATERIALS AND METHODS
Description of experimental materials
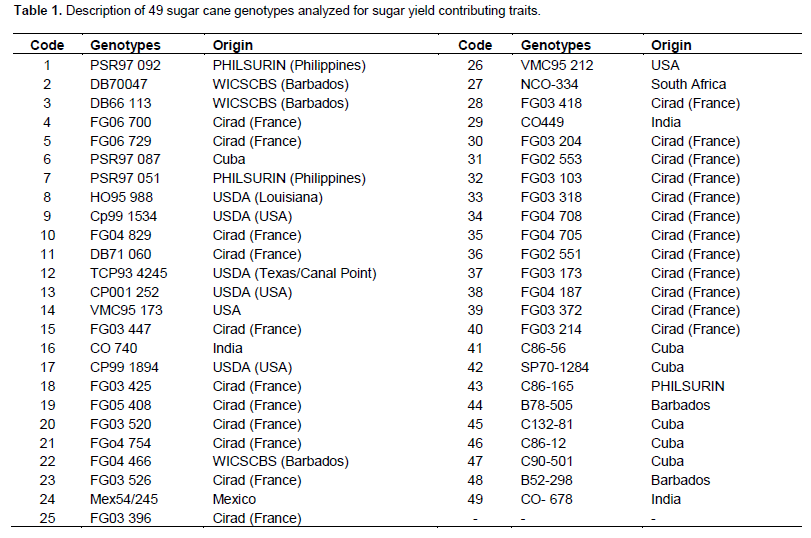
Forty-three sugarcane genotypes along with six commercial varieties were grown across Ethiopian Sugar Estates (Wonji, Metahara and Finchaa) and Projects (Tendaho and Belles) over two successive plant cane and first ratoon crops in 2013 to 2016 production years (Table 1). Of which, 21, 3, 5, 7 and 7 genotypes were introduced from France, Philippines, Barbados, USA and Cuba, respectively. The rest 6 varieties were from commercial varieties which had been introduced into Ethiopia from India, South Africa and Barbados before 50 years and were included in this study for comparison purposes. Out of the introduced materials from France, those whose name starts with PG, are clones that have been screened half way at the sugarcane breeding scheme in Cirad (France) and those varieties whose name starts with other than PG are advanced breeding clones at the final testing stage before a possible commercial release.
Experimental design and layout
The experiment was implemented with partially balanced square lattice design and was repeated (replicated) three times. Plot size for a genotype per replication was 8.7 × 6 m (52.5 m2) with four test rows and two guard rows. Moreover, the design contains 7 blocks per replication and each block had an area of 8.7 m (width) × 48 m (length) = 417.6 m2 and the experimental area per location was 0.78 hectares. Each replication was defined as replication nested in each location because the replications were unique for location and each block was nested within both replications and location. At planting, 18 two budded sets were laid on a furrow with 5 m length and cane was harvested at 17 and 13 months cane age for plant cane and ratoon crops, respectively. All recommended agronomic and cultural practices were uniform to raise the crop across all the sugar estates.
Morphological and agronomic characteristics
Cane and cane yield components
Sprout percentage: The percentage of setts which sprout 45 days after planting was calculated as the numbers of setts sprouted divided by the numbers of setts planted per plot and multiplied by 100, while the number of tillers the (ha-1) per plot (from the central test rows) was counted 4 months after planting and was converted on hectare basis. For average numbers of internodes per stalk, milleable stalk diameter and stalk height (cm), 20 randomly selected milleable stalks per plot were considered and only the average values were reported. For estimation of cane yield (tons ha-1m-1), all milleable stalks from the central four rows per plot were hand trashed to remove the leaves and hand topped at the natural breakpoint of sugarcane stalk. The milleable stalks were then weighted using digital scale balance to the weights per plot and was extrapolated to tons ha-1 m-1
Sugar yield and yield quality traits
Recoverable sucrose percentage refers to the total recoverable sugar percent in the cane and was calculated as recoverable sucrose percentage = [Pol% - (Brix - Pol%) 0.61] 0.75) as described by Berg (1972), where 0.61 = non-sugar factor, representing the amount of sucrose lost in final process and 0.75 = cane factor, representing the correlation factor between theoretical yields of molasses mixed juice and primary juice for the same genotype and the same cut of cane determined by milling test. Pol and Brix in cane refers to Pol and Brix percentage in cane and were determined as Pol in juice × (100-(fiber%+5))/100 and Brix in juice × (100-(fiber%+3))/100, respectively. Moreover, sugar yield (ton/ha) was estimated as the product of cane yield per hectare and average estimated recoverable sucrose percentage, and was computed as sugar yield = [Cane Yield (t/ha) × Recoverable sucrose percentage] / 100. As the plant cane crops and ratoon crop were harvested at 17 and 14 months age of cane, respectively, data for cane and sugar yield were converted to t ha-1m-1 (tons per hectares per month) to bring the crops types to the same productivity unit.
Statistical analysis
The data collected for each trait were subjected to combined analysis of variances (ANOVA) and using SAS program and data quality was checked to meet the assumptions of ANOVA and block effects were using SAS software package, 2009. Genotypic means were adjusted for the lack of orthogonality (intra or inter block) in the data depending on the relative magnitude of the block variance relative to the residual error as suggested by Federer et al. (2001) and the adjusted means were used for multivariate analyses. For cluster analysis, average linkage was obtained by specifying METHOD=AVERAG as adopted by Sokal and Michener (1958), while Euclidean distance and linear discrimination analysis were computed using Minitab v. 17. Moreover, multiple regressions were analyzed using GENSTAT (Edition 13th), while the path coefficient analysis was done using the SAS software package (SAS, 2009) and SAS program of PROC MATRIX and PROCIML as suggested by Kang (1994).
RESULTS AND DISCUSSION
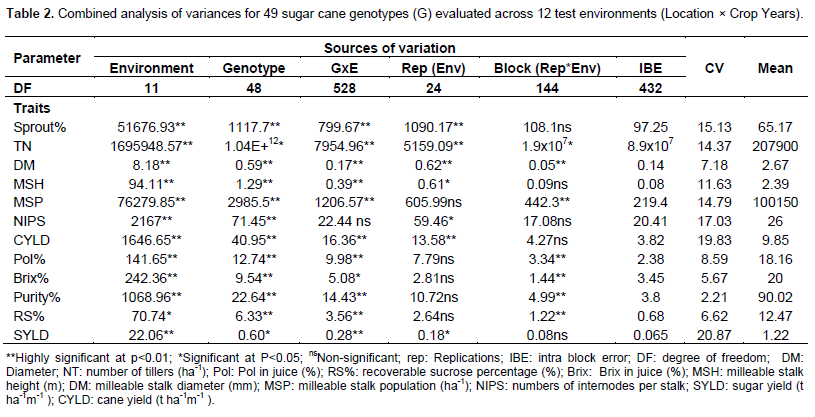
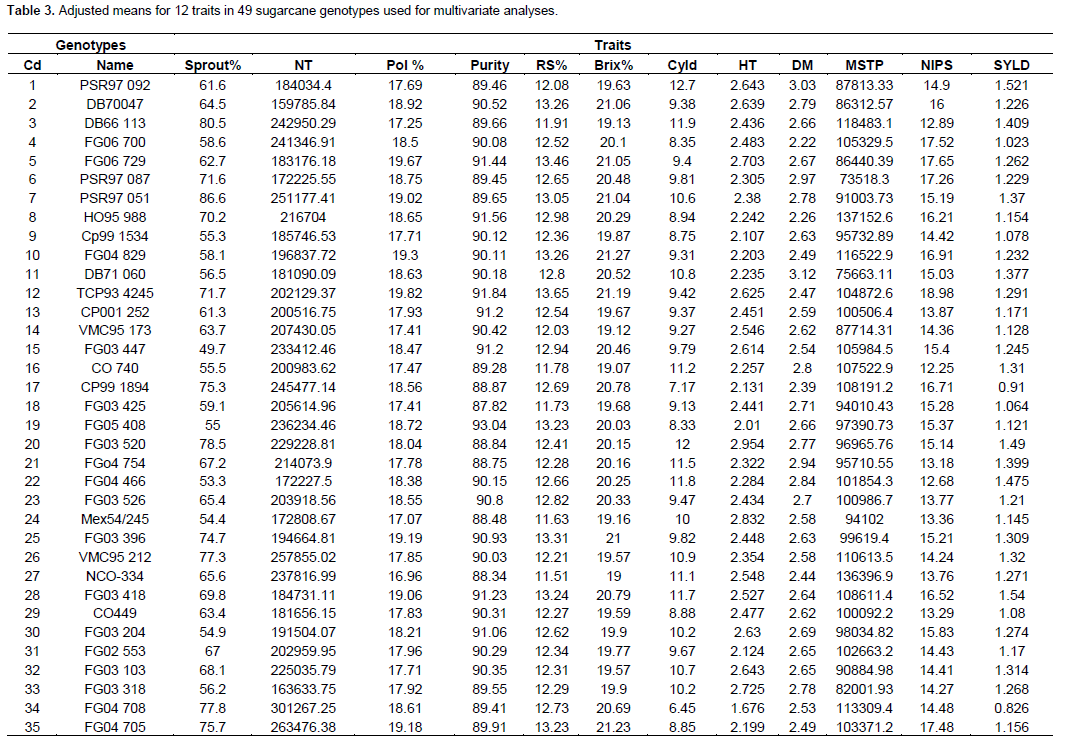
The pooled analysis of variance (Table 2) showed that the variances for genotypes were highly significant (P<0.01) for all traits, suggesting there was an ample genetic variability among the genotypes. As the variability among genotypes was highly significant for all traits studied, conducting of multivariate analyses using these traits will be relevant to generate further analysis. Hence, means for sprout percentage (%), number of tillers (ha-1), milleable stalk height (m), milleable stalk diameter (cm), milleable stalk population (ha-1), numbers of internodes per stalk, cane yield (tons ha-1 m-1), Brix in juice, Pol in juice, purity, recoverable sucrose percentage and sugar yield (t ha-1 m-1) were adjusted. The adjusted means of the traits studied were subjected to cluster, linear discriminant, principal component, path coefficient and multiple regression analyses (Table 3).

Cluster analysis
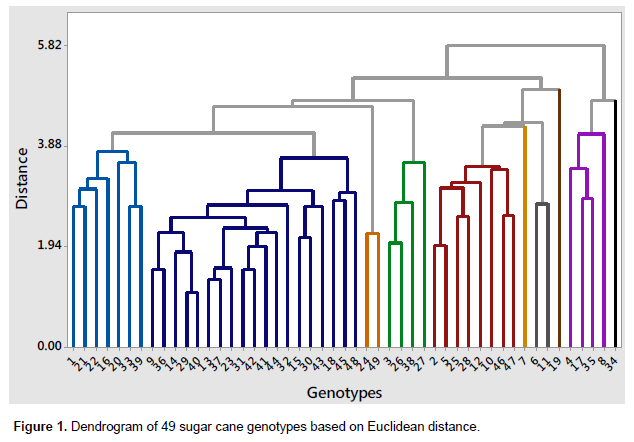
Based on the adjusted means of 12 sugarcane traits presented in Table 3, results of the cluster analysis indicated that the 49 sugarcane genotypes formed 10 distinct groups or clusters where 3 of the groups contained a single genotype (Table 4). Starting from left to right of the Dendrogram (Figure 1), clusters number II comprised much of the genotypes studied (17 genotypes) followed by cluster V (8) and I (7). Cluster 1 consisted of 7 genotypes that have different origins but introduced from France. Cluster II consists of 17 genotypes (9, 36, 14, 29, 40, 13, 37, 23, 31, 42, 41, 44, 32, 13, 30, 43, 18, 45 and 48) which were a mixture of commercial varieties and introduced genotypes. It was also observed that most of the commercial varieties were grouped in one cluster except genotypes 24 and 49 form another separate group. Genotypes 7, 19 and 34 were ungrouped, suggesting these genotypes were outliers for lower or higher mean values of the traits studied.
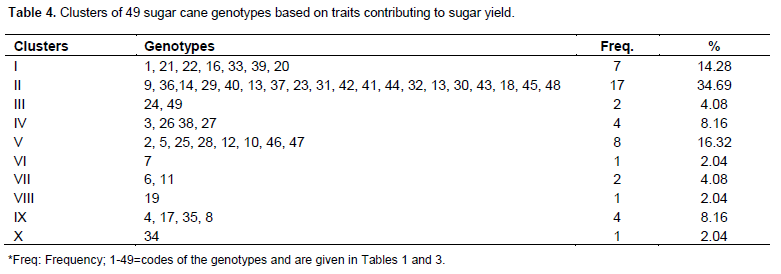
Based on the grouping, the relationships observed among these genotypes had no any correspondence with the geographic origin (from where they were introduced). This suggested that the genotypes of different geographic origin had genetic similarity and genotypes of the same geographic origin had different genetic background, suggesting that a high proportion of total genetic variation was retained within the groups of origin and active genetic ex-change was found between different origins. This relationship suggests the introduction strategy was successful in terms of improving the base of the crop in Ethiopia and increases the chances of selection efficiency during parental selection in the future using the traits that contributed more to the existed phenotypic diversity. Similar results were also observed by Ram and Hemaprabha (1998) and Tahir et al. (2013) in which they found the progenies of a cross clustered independently of their parents. Hence, our introduction strategy was appropriate in terms of broadening the narrow genetic pool of sugarcane in Ethiopia.
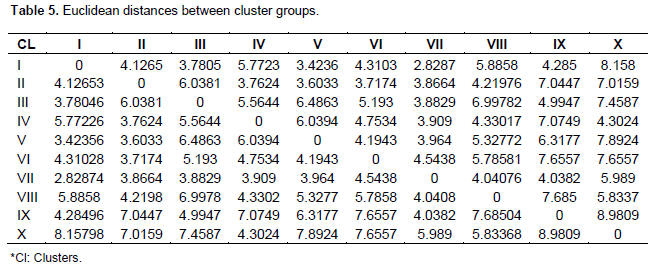
Euclidean distances between clusters groups and contributions of variable (Traits) to diversity
Distances between clusters groups based on the Euclidean Distances statistic (Table 5) revealed that groups I, II, III, V, VI and IX had the highest distances to group X with a single genotype (34) suggesting the genotype was an outlier. Moreover, cluster group IX was more distanced from cluster groups II (7.016), III (7.461), IV (7.070), VI (7.651) and VIII (7.680); genotypes of each group had ample diversity and can be crossed with genotypes in groups IX. On the contrary, the smallest distance was observed between cluster groups I and VII, the diversity between the groups was narrow. Generally, the smallest and larger distances among cluster groups suggest high probability of getting divergent genotypes that are useful for crossing purposes.
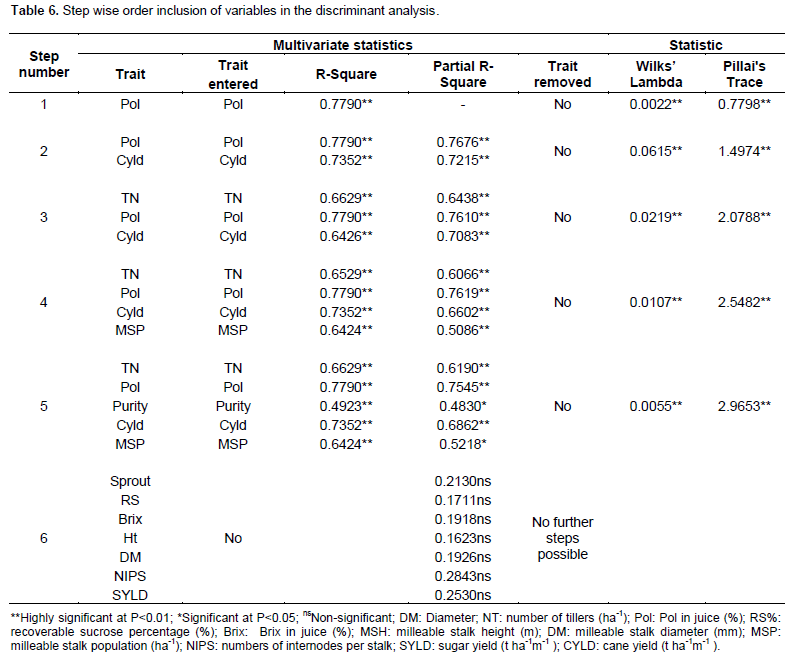
A step wise discriminant analysis by minimizing the Wilk’s criteria (Table 6) resulted in significant F-values for Pol%, cane yield, number of tillers; Purity% and milleable stalk population, suggesting that these traits contributed more to the discrimination among the groups.
Results of different studies demonstrate that the linear discrimination function is a usefully tool for screening and evaluating variation among sugarcane genotypes studied. Moreover, the step wise discrimination procedure provided in Table 6 indicated that Pol in juice, cane yield (t ha-1m-1), number of tillers (ha-1), purity% and milleable stalk population (ha-1) significantly explained total variability (R2) of 77.90, 73.52, 66.29, 64.24 and 49.23%, respectively; revealing these traits contribute more to the diversity which existed among the 49 sugarcane genotypes. This result was inconsistent with findings reported by Kang et al. (2013) in which Brix and juice contents contributed more to divergence among genotypes. It can be concluded that the 49 sugarcane genotypes were diversified for Pol in juice; cane yield (t ha-1m-1), number of tillers (ha-1), purity% and milleable stalk population (ha-1).
Principal component analysis
Biplot of principal component analysis based on correlation matrix is depicted in Figure 2. It was sufficient enough to show correlation among variables considered. 58, 96 and 100% of the variation existed among the genotypes was explained by the first two, eight and ten principal components, respectively (Figure 2a). The Biplot and loading plot (Figure 2b) were able to separate cane yield and its components (large PC2 score) from the quality traits (large PC1) highlighting characterization of genotypes in terms of traits would be possible using principal component analysis.
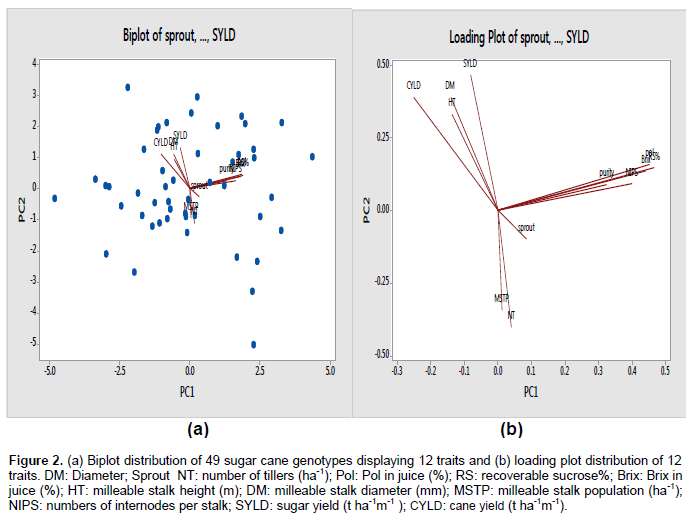
As far as the relationships (correlation) existed among the traits is concerned, cane yield, milleable stalk height, diameter and sugar yield were characterized with large PCA2 score and were more correlated (angles among the specified traits were acute) which agreed with reports of Rewati and Joshi (2005) in which milleable stalk height and diameter were positively correlated with cane yield. Selection of sugarcane genotypes based on cane yield, milleable stalk height and diameter increased sugar yield which is consistent with the results reported by Khan et al. (2013) and Masri et al. (2015). On the contrary, quality parameters such as purity%, pol in juice, Brix in juice and recoverable sucrose percentage were characterized with large PCA 1 and had small angles among themselves; indicating strong and positive correlation. Moreover, milleable stalk population and tiller number were characterized with small PCA score and were negatively correlated with cane yield and sugar yield which disagreed with the results of Punia et al. (1983). Sprout percentage was positively correlated with milleable stalk population which was consistent with reports of Sahu et al. (2008) in which germination% showed a positive and significant correlation with number of millable canes.
Weak and positively correlation was observed between sugar yield Pol%, Purity%, Brix and numbers of internodes per single stalk. Furthermore, milleable stalk diameter made obtuse angle with numbers of internodes per stalk implying negative correlation disagreed with report of Kumar and Kumar (2014). The inconsistencies of the results might be attributed to the nature of quantitative traits which are more affected by environment and sampling error. Generally, weak correlation existed between sugar yields and recoverable sucrose percentage which is not expected as recoverable sucrose percentage is the main component of sugar yield. Thus, additional analyses such as path coefficient analysis, which enable to compute indirect effects of secondary traits on dependent trait, should be used.
Results obtained from PCA analysis were supported by linear discriminant analysis in that Pol% and cane yield which contributed more to the total variability in the linear discriminant analysis had long vectors in the Biplot (Figure 2a) and loading plot (Figure 2b), indicating these traits contributed more to the total variation explained by the first two dimensions. This suggests that the PCA and linear discriminate analysis were similar in identifying the traits which were dominant in explaining the existing variability among the genotypes. Moreover, these traits can be further used to discriminate cluster groups and are helpful for parent selection in sugarcane breeding programs as the variation existed among the genotypes was highly significant for these traits (Table 2).
Path coefficient analysis
The gap in principal component or correlation analysis with respect to causal relationships among traits necessitates path coefficient analysis to be used in selection to utilize both direct and indirect relationships among traits (Kang, 2015). Thus, the use of path coefficient analysis will be mandatory to increase the efficiency of our selection. The path coefficient analysis presented (Table 7) indicated that the highest positive direct effect on sugar yield was exerted by cane yield (1.028) followed by recoverable sucrose percentage (0.417) and Pol (0.016) which is consistent with report of Khan et al. (2013). In the contrary, small negative direct effects on sugar yield were exerted by number of tillers, Brix, stalk diameter, milleable stalk population and numbers of internodes per stalk. Furthermore, milleable stalk height and milleable stalk population exerted indirect effect of 0.546 and 0.459, respectively via cane yield, while Brix% in juice, Pol% in juice, Purity% and number of internodes had indirect effects of 0.385, 0.378, 0.300 and 0.293, respectively via recoverable sucrose percentage. Hence, these traits should be given due consideration during selection for high sugar yield. This result was similar with reports of Khan et al. (2012) in which higher number of tillers, good weight, endowed with better available sugar in the cane (Pol%), commercial cane sugar (CCS)% and purity% were the important characters which should be considered in selection of higher sugar yield in sugarcane genotypes.
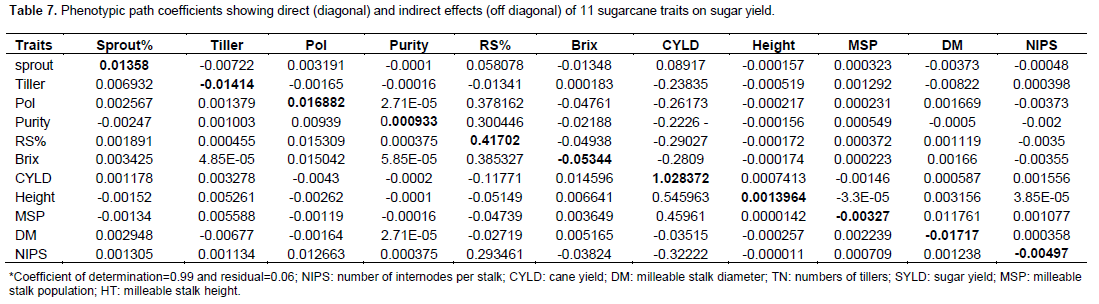
Selection of sugarcane genotypes on the basis of cane yield and recoverable sucrose percentage (%) would be beneficial for increasing sugar yield in sugarcane. Our result was in agreement with report of Hussein et al. (2012) except for the effect of number of milleable stalks to sugar yield in our study was negative and negligible. Moreover, the coefficient of determination and the residual effect in this study were 0.990 and 0.061, respectively suggesting that most of the variability in sugar yield was best explained by the traits studied (causal factors) and the error was negligible and thus, no additional traits is necessary to be included in selection. Generally, the path coefficient analysis, in the present study was sufficient enough to increase the efficiency of selection. For example, the weak correlation between sugar yield and recoverable sucrose%, in the principal component analysis, was ruled out by path coefficient analysis in such a way that it was able to compute the direct effect of recoverable sucrose percentage (0.417) and its highest indirect effects via Brix% in juice (0.385), Pol% in juice (0.378) and Purity% (0.300).
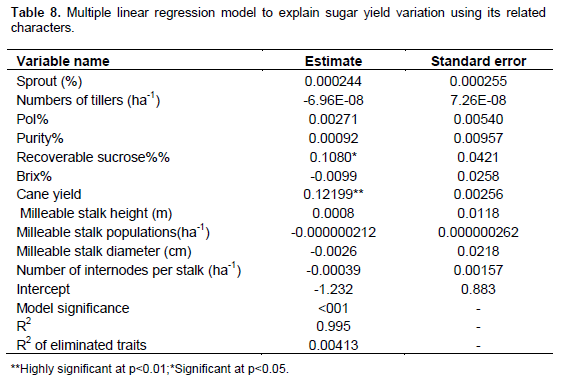
Multiple linear regressions analysis
Although path coefficient analysis provides a picture of the pattern of association, it cannot construct a prediction equation for dependent variable using its components (El-Shafi and Ismail, 2006). For this reason, multiple regressions were used to develop the regression model. SY (Sugar yield) =-1.232+0.000244 (sprout %) +-6.96E-08 (Tiller Numbers) +0.00271 (Pol %) +0.00092 (Purity%) +0.1080 (Yield %) +-0.0099 (Brix %) +0.12199 (cane yield) + 0.0008 (stalk height) + -0.000000212 (stalk population) + -0.0026 (stalk diameter)-0.00039 (number of internodes). The result presented in Table 8 demonstrated that 99.5% of the variability is explained as R2 and the rest 0.41% is attributed to unknown variation. Furthermore, the multiple linear regressions indicated that recoverable sucrose percentage and cane yield significantly contributed to sugar yield which is similar to the results reported by Hussein et al. (2012) in which recoverable sucrose percentage and stalk weight contributed more to sugar yield.
CONCLUSION
The multivariate analysis generates relevant information about the performance of the genotypes, relationship among genotypes and interrelationships among traits which is very important for sugarcane breeding programmes. The cluster analysis demonstrated that the 49 sugarcane genotypes studied were clustered into ten groups and were highly significantly different for Pol in juice, cane yield (t ha-1m-1), number of tillers (ha-1), purity% and milleable stalk population (ha-1). The relationship existed among sugarcane genotypes studied was not related to their geographic origin, suggesting that a high proportion of total genetic variation was retained within the groups of origin and active genetic ex-change was found between different origins indicating that the introduction strategy was successful.
Generally, regarding with the interrelationships among the traits, more information was generated following the use of principal component, linear discriminant, path coefficient and multiple regression analyses indicating the use of multivariate analyses was successful. Path coefficient was unique in generating information about the indirect effects of traits on sugar yield which was very important to provide substantial information about indirect effects of traits that are very relevant to increase selection efficiency in sugarcane plant breeding programs.
CONFLICT OF INTERESTS
The authors have not declared any conflict of interests.
ACKNOWLEDGEMENTS
The authors wish to acknowledge the Sugar Corporation Research and Training for providing necessary inputs on time. Due appreciation goes to Sugar cane Research Stations Team leaders, for the follow up of the experiments.
REFERENCES
|
Ahmed AO, Obeid A, Dafallah B (2010).The influence of characters association on behavior of sugarcane genotypes (Saccharum Spp.) for cane yield and juice quality. World J. Agric. Sci. 6(2):207-211. |
|
|
Chohan M, Panhwar RN, Memon MA, Unar GS, Mari AH (2007). Performance of new sugarcane varieties for cane yield and quality under different agro-climatic conditions of Sindh. Pak. J. Sci. Res. 59:28-33. |
|
|
Dewey DR, Lu KH (1959). A correlation and path coefficient analysis of components of crested wheat grass seed production. Agron. J. 51:515-518. |
|
|
El-Shafai AM, Ismail AMA (2006). Effect of row spacing on yield and quality of some promising sugarcane genotypes. Egypt. J. Appl. Sci. 21(11):32-46. |
|
|
Hussein M, Al-Sayed H, Fateh S, Fares WM, Attaya S (2012). Crops Multivariate Analysis of Sugar Yield Factors in Sugar Cane. Sugar Res. Inst., Agricultural Researches Center, Giza, Egypt. Am. Eurasian J. Sustain. Agric. 6(1):44-50. |
|
|
Kang MS (1994).Applied quantitative genetics. Baton Rouge. Agron. J. 84:917-918. |
|
|
Kang MS (2015). Efficient SAS Programs for Computing Path Coefficients and Index Weights for Selection Indices. Department of Plant Pathology, Kansas State University, Mahattan, Kansas, USA. J. Crop Improve. 29:6-22. |
|
|
Kang MS, Sosa O, Miller JD (1989). Path analysis for percent fiber andcane and sugar yield in sugarcane. Crop Sci. 29:1481-1483. |
|
|
Khan IA, Bibi S, Yasmin S, Khatri A, Seema N, Abro AS (2012). Correlation studies of the agronomic traits for higher sugar yield in sugarcane. Pak. J. Bot. 44(3):969-971. |
|
|
Khan IA, Nighat, S, Raza S, Yasmine S, Sajida B (2013). Environmental Interaction of Sugarcane Genotypes and Yield Stability Analysis of Sugarcane. Nuclear Institute of Agriculture, Tando Jam, Pakistan, Pak. J. Bot. 45(5):1617-1622 |
|
|
Kozak M, Kang MS, Stepien M (2007). Causal pathways when independent variables are co-related: New interpretational possibilities. Plant Soil Environ. 53(6):267-275 |
|
|
Kumar S, Kumar D (2014). Correlation and path coefficient analysis in sugarcane germplasm under subtropics. Department of Genetics and Plant Breeding. CCR (P. G.) College, Muzaffar Nagar (U.P), India. Afr. J. Agric. Res. 9(1):148-153. |
|
|
Malik SR, Bakhsh A, Asif MA, Iqbal U, Iqbal SM (2010). Assessment of genetic variability and interrelationship among some agronomic traits in chickpea. Int. J. Agric. Biol. 12:81-85. |
|
|
Masri MI, Shaban SHA, El-Hennaway, Abu El-lail (2015). Phenotypic and Genotypic Correlations in Sugarcane at First Clonal Selection Stage. Agronomy Depart. Fac. of Agric. and Natural Resources. Aswan Univ. Aswan, Egypt. Sugarcane Research institute. Egypt. J. Plant Breed. 19(2):297-321. |
|
|
Mohammadi SA, Prasanna BM (2003). Analysis of genetic diversity in crop plants-salient statistical tools and considerations. J. Crop Sci. 43(4):1235-1248. |
|
|
Ong'ala J, Mwanga D, Nuani F (2016). Principal Component Analysis in Sugarcane Clone Selection. Kenya Agricultural and Livestock Research Organization, Sugar Research Institute, Nairobi, Kenya. J. Indian Soc. Agric. Stat. 70(1):33-39. |
|
|
Punia MS, Paroda R, Hooda RS (1983). Correlation and path analysis of cane yield in sugarcane. Indian J. Genet. Plant Breed. 43:109-12. |
|
|
Ram B, Hemaprabha G (1998). Nature and pattern of genetic divergence of sugar yield and its components in the progenies of Saccharum barberi. Indian J. Gen. Plant Breed. 58(2):193-199. |
|
|
Rewati RC, Joshi DK (2005).Correlation and Path Coefficient Analyses in Sugarcane. Sugarcane Research Programme-NARC, Jitpur-Bara-Nepal. Nepal. J. Agric. Res. 6:25-26. |
|
|
Sahu RS, Pandey SS, Kamat DN (2008). Correlation studies between seedlings and their settings in inter varietal crosses of sugarcane for yield and quality traits. Indian Sugar 50(2):27-35. |
|
|
Sidwell RJ, Smith EL, McNew RW (1976). Inheritance and interrelationships of grain yield and selected yield-related traits in a hard red winter wheat cross. Crop Sci. 16:650-654. |
|
|
Sokal RR, Michener CD (1958). A Statistical Method for Evaluating Sys¬tematic Relationships. Univ. Kans. Sci. Bull. 38:1409-1438. |
|
|
Tahir MH, Rahman RG, Ali A, Khalid M (2013).Genetic Divergence in Sugarcane Genotypes. Sugar Crops Research Institute, Mardan, KPK, Pakistan. Am. J. Exp. Agric. 3(1):102-109. |
|
|
Terzi FS, Rocha FR, Vencio RZ, Felix JM, Bran DS, Waclawovsky AJ (2009). Sugarcane gene associated with sucrose content. Retrieved from BMC Genomics 10(1):1. |
|
|
Tyagi AP, Lai P (2007). Correlation and path coefficient analysis in sugarcane. South Pac. J. Nat. Sci. 1:1-10. |
|
|
Wen YX, Zhu J (2005). Multivariable conditional analysis for complex trait and its components. Acta Genet. Sin. 32(3):289-296. |
|
|
Zhu YJ, Albert HH, Moore PH (2000). Differential expression of soluble acid invertase genes in the shoots of high-sucrose and low-sucrose species of Saccharum and their hybrids. Austr. J. Plant Physiol. 27:193-199. |
|
Copyright © 2024 Author(s) retain the copyright of this article.
This article is published under the terms of the Creative Commons Attribution License 4.0


