Proper type and amount of fertilizer application is the major factor that affects yield and yield components of durum wheat. Hence, field experiment was carried out on farmer’s field to determine the effect of blended NPS fertilizer (19% Nitrogen, 38% P2O5 and 7% Sulfur) in combination with nitrogen on growth, yield components, and yield of durum wheat. Factorial combinations of three blended NPS levels (100, 150, and 200 kg ha-1) each supplemented with five levels of nitrogen (0, 23, 46, 69 and 92 kg ha-1) and control were laid out in a randomized complete block design with three replications. The analysis of variance (ANOVA) indicates that the interaction effect of blended NPS and supplemented N significantly (p < 0.05) influenced number of total tillers and total productive tillers per m2 where, highest total tillers (343.3) and productive tillers (306.7) per m2 were recorded at the combination of 150 kg NPS ha-1 and 92 kg N ha-1.However, those left parameters were not significantly influenced by the interaction of the two factors. The analysis of variance showed that the main effect of blended NPS was significantly (p < 0.05) influenced only grain yield and plant height where maximum grain yields (5274 kg ha-1) and plant height (79.59 cm) were obtained at the highest application of 200 NPS kg ha-1. The analysis of variance also showed that the main effect of supplemented N rate highly significantly (p < 0.01) influenced days to physiological maturity, grain filling period, thousand kernels weight, grain yield and harvest index but significantly (p < 0.05) influenced plant height and biomass yield. The highest days to physiological maturity (103 days), grain filling period (46.22 days), thousand kernels weight (50.49 g), plant height (79.49 cm), grain yields (5738 kg ha-1), biomass yields (11728 kg ha-1) and harvest index (48.91%) were recorded at the highest N rate (92 kg N ha-1). The economic analysis revealed that for a treatment to be considered as worthwhile to farmers, application of 100 kg NPS ha-1 with 69 kg N ha-1 were profitable and recommended for farmers in Arsi Nagelle District.
Wheat (Triticum species) is the most important staple food crop for more than one-third of the world population and contributes more calories and proteins to the world diet than any other cereal crops (Shewry, 2009). Global wheat production in 2014 was estimated at 729 million tons from 220 million ha area harvested with average yield of 3315.2 kg ha-1 (FAOSTAT, 2014).
In Ethiopia, wheat is mainly grown in the highlands, which lie between 6 and 16° N latitude and 35 and 42° E longitude, at altitudes ranging from 1500 to 2800 m above sea level and with mean minimum temperatures of 6 to 11°C (MoA, 2012). There are two types of wheat grown in Ethiopia and both of them are produced under rainfed conditions: durum (pasta and macaroni) wheat, accounting for 40% of production, and bread wheat, accounting for the remaining 60% (Bergh et al., 2012). Durum wheat (Triticum turgidum L. var Durum) is traditionally grown by smallholder farmers on the heavy black clay soils (Vertisols) of the high lands at altitude ranging between 1800 and 2800 m above sea level and rainfall distribution varying from 600 to more than 1200 mm per annum (January to December) in Ethiopia (Hailu, 1991).
Lack of soil fertility database and absence of area and crop specific fertilizer recommendation was taken as a key obstacle in realizing the first growth and transformation plan (GTP) of doubling agricultural production by the end of the five-year plan period (IFDC, 2015). In order to tackle this problem, the Ministry of Agriculture was conducting soil and plant nutrient survey to determine the key soil nutrient limitations along with importation of different blended fertilizers and micro-nutrients from abroad and test these against Urea (50 kg ha-1) and di-ammonium phosphate (DAP, 100 kg ha-1) for their impact on crop yield in different areas and crops. The results from both of these initiatives showed deficiency of 3 to 6 nutrients N, P, S, Zn, Mo and B. in most parts of the country and crops responded to the application of additional nutrient. Moreover, the plant analysis data from the same sites indicated that wheat plants were deficient in N, P, Zn and K (Hailu et al., 2015).
Due to this, Ethiopia is moving from blanket recommendations for fertilizer application rates to recommendations that are customized based on soil type and crop. This is a move towards diversification and away from DAP and Urea, which have long been the only type of fertilizer imported for grain crops.
The farmers in most parts of the country in general and in the study area in particular have limited information on the impact of different types and rates of fertilizers except blanket recommendation of nitrogen 41 kg N ha-1 (23 kg N/urea +18 kg N/DAP) and phosphorus (46 kg P2O5 ha-1), that is, 50 kg Urea and 100 kg DAP per ha-1. However, according to the soil fertility map covering over 150 districts, most of the Ethiopian soils lack about seven nutrients (N, P, K, S, Cu, Zn and B) (EthioSIS, 2013). Moreover, Assefa et al. (2015a) reported that grain yield and yield components of wheat (100%) fully responded to applied nitrogen, 72.3% showed response to sulfur, 78% showed response to applied phosphorus on eighteen fields studied in central high lands of Ethiopia and strongly indicated sulfur deficiency along with its importance to include in balanced fertilizer formula.
Apart from blanket recommendation of nitrogen and phosphorus, the effect of other fertilizers on yield components and yield of durum and bread wheat are unknown in Ethiopia, even though new blended fertilizers such as NPS (19% N, 38% P2O5 and 7% S) are currently being used by the farmers with blanket recommendation of 100 kg NPS ha-1 in Ethiopia. However, the rate of this fertilizer was not determined by researchers particularly for the study area and durum wheat production. In addition to this, the amount of N in the blended NPS is small as compared to the requirement of durum wheat. Thus, there is a need to supplement with nitrogenous fertilizer in the form of urea. Therefore, this study was undertaken with the following objectives:
(i) to assess the effect of rates of blended NPS and supplemental N fertilizers on growth, yield components and yield of durum wheat.
(ii) to determine economically appropriate rates of blended NPS and supplemental N fertilizers for durum wheat production.
Description of the experimental site
The experiment was conducted during mid-July to October in 2016 cropping season on a farmer’s field in Mako Oda Peasant Association, in Arsi Negelle District, West Arsi Zone of Oromia Regional State in Central Ethiopia. Mako Oda Peasant Association is situated at a distance of about 210 km from Addis Ababa in the South direction, and around 5 km from the Arsi Negelle Town. Geographic location of the district is 7° 17' N to 7° 66' N latitude and 38° 43' E to 38° 81' E longitudes (Google Earth, 2012). The elevation is 500 to 2000 masl; the area is characterized by erratic type of bimodal rainfall pattern; and the soil type of Arsi Negelle is mainly Vertisols and Alfisols with pH 7.5 (OoARD, 2009).
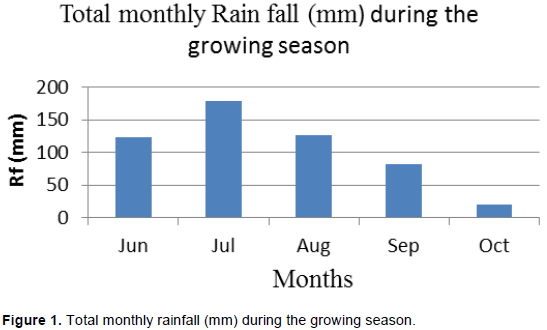
According to National Meteorological Services Agency (NMSA), Arsi Negelle had mean annual minimum and maximum temperatures of 8.14 and 27.89°C, respectively, while rainfall varied between 20 - 180 mm per month during cropping season (Figure 1). In general, the average monthly maximum and minimum temperatures and rainfall distribution are suitable for wheat production.
Experimental materials
Durum wheat variety Ude (CD 95294-2Y) and blended fertilizer in the form of NPS (19% N, 38% P2O5 and 7% S) were used, whereas urea (46% N) was used as a source of nitrogen.
Soil sampling and analysis
Before sowing, soil samples were taken randomly to a depth of 0 - 30 cm in a zigzag pattern to make one composite soil sample of the experimental field. The collected composite soil sample was air-dried, ground, and sieved using 2 mm sieve except for organic matter which was 0.02 mm sieve and was analyzed using standard laboratory procedures at Batu Soil Research Center.
Organic carbon was determined by Walkley and Black oxidation method (Walkley and Black, 1934). Total nitrogen was analyzed by Micro-Kjeldhal digestion method with sulfuric acid (Jackson, 1962). The total number of exchangeable cations a soil can hold, cation exchange capacity was determined after saturating the soil with 1 N ammonium acetate (NH4OAc) and displacing it with 1 N NaOAc (Chapman, 1965). Available phosphorus was determined by the Olsen’s method using a spectrophotometer (Olsen et al., 1954). Soil pH was measured in water at soil to water ratio of 1:2.5 (Van Reeuwijk, 1992). Soil texture was analyzed by Bouyoucous hydrometer method (Bouyoucous, 1951). Available Sulfur was determined using turbid metric method (Chesnin and Yien, 1951).
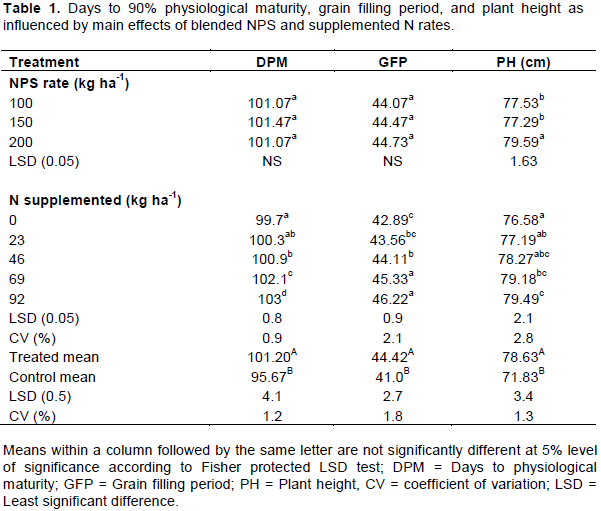
Treatments and experimental design
The treatments consisted of factorial combinations of three levels of NPS (100, 150 and 200 kg ha-1) each supplemented with five levels of nitrogen (0, 23, 46, 69 and 92 kg ha-1) and control that give a total of sixteen treatments. The experiment was laid out in randomized complete block design (RCBD) with three replications. The details of the treatments are shown in Table 1. The gross plot size was 3 m × 2 m (6 m2) accommodating 10 rows each spaced 20 cm. Spacing of 1.0 m and 0.5 m was maintained in between adjacent blocks and plots, respectively. The outermost one row from each side of a plot and 25 cm from each end of the rows were considered as border, thus the net plot size was 2.5 m × 1.6 m (4 m2).

Management of the experiment
The experimental field was prepared following the conventional tillage practice which includes four times plowing before sowing of the crop. As per the specification of the design, a field layout was prepared; the land was leveled and made suitable for crop establishment. Sowing was done on 6 July 2016 using seed rate of 125 kg ha-1. Full dose of NPS as per the treatment and one-third of N alone was applied at sowing time. The remaining two-third of N alone was top dressed at the mid-tillering crop stage.
Data collection and measurement
Crop phenology and growth parameters
Days to heading: This was recorded as the number of days from the date of sowing till spikes in 50% of the plants emerged from each plot by visual observation.
Days to physiological maturity: This was determined as the number of days from sowing to the date when 90% of the peduncle turned to yellow straw color. It was recorded when no green color remained on glumes and peduncles from each plot by visual observation.
Grain filling period: It was determined as the number of days to maturity minus the number of days to heading.
Plant height (cm): This was measured from the soil surface to the tip of a spike (awns excluded) from 10 randomly tagged plants from the net plot area at physiological maturity.
Yield components and yield
Number of total tillers: These were counted from two rows of 0.5 m length selected randomly per net plot at physiological maturity and converted to m2.
Number of productive tillers: These were counted at physiological maturity from two randomly selected rows of 0.5 m in length from the net plot as above and converted to m2.
Number of kernels per spike: This was recorded as an average of 10 randomly taken spikes from the net plot area.
Thousand kernel weight: This was determined based on the weight of 1000 kernels sampled from the grain yield of each net plot by counting using electronic seed counter and weighed with electronic sensitive balance. Then the weight was adjusted to 12.5% moisture content.
Aboveground dry biomass yield: This was determined from plants harvested from the net plot area after sun drying to a constant weight and expressed in kg ha-1.
Grain yield: This was taken by harvesting and threshing the grain yield from net plot area. The yield was adjusted to 12.5% moisture content and expressed as yield in kg ha-1.
Harvest index (HI): This was calculated as ratio of grain yield per plot to total above ground dry biomass yield per plot expressed as percent.
Statistical analysis
The data was subjected to analysis of variance (ANOVA) as per the experimental design using GenStat (15th edition) software (GenStat, 2012). The Least Significance Difference (LSD) at 5% level of probability was used to determine differences between treatment means.
Partial budget analysis
The economic analysis was carried out by using the methodology described in CIMMYT (1988) in which prevailing market prices for inputs at planting and for outputs at harvesting were used. All costs and benefits were calculated on ha basis in Birr. The concepts used in the partial budget analysis were the mean grain yield of each treatment, the gross benefit (GB) ha-1 (the mean yield for each treatment) and the field price of fertilizers (the costs of NPS and Urea and the application costs). Cost of straw yield was not included in the calculation in the benefit since the farmers in the area do not use it. Marginal rate of return, which refers to net income obtained by incurring a unit cost of fertilizer, was calculated by dividing the net increase in yield of durum wheat due to the application of each fertilizers rate. The net benefit (NB) was calculated as the difference between the gross benefit and the total cost that vary (TCV) using the formula
NB = (GY × P) - TCV
where GY × P = Gross Field Benefit (GFB), GY = Adjusted Grain yield kg per hectare and P = field price kg of the crop.
Actual yield was adjusted downward by 10% to reflect the difference between the experimental yield and the yield farmers could expect from the same treatment.
The dominance analysis procedure as described in CIMMYT (1988) was used to select potentially profitable treatments from the range that was tested. The discarded and selected treatments using this technique were referred to as dominated and undominated treatments, respectively. For each pair of ranked treatments, % marginal rate of return (MRR) was calculated using the formula:

where NBa = NB with the immediate lower TCV, NBb = NB with the next higher TCV, TCVa = the immediate lower TCV and TCVb = the next highest TCV.
The % MRR between any pair of un-dominated treatments was the return per unit of investment in fertilizer. To obtain an estimate of these returns, the % MRR was calculated as changes in NB (raised benefit) divided by changes in cost (raised cost). Thus, a MRR of 100% implied a return of one Birr on every Birr spent on the given variable input.
The fertilizer cost was calculated for the cost of each fertilizer of NPS (Birr 14.54 kg-1) and N/UREA (Birr 10.60 kg-1) during sowing time. The cost of NPS and Urea application is Birr 1454 and 1060 ha-1, respectively; and the average open price of durum wheat at Arsi Negelle market was Birr 7 kg-1 in October 2017 during harvesting time. The application cost of NPS and two times urea application was 200 birr ha-1.
Soil physico-chemical properties of the experimental site
Selected physico-chemical properties of the soil were analyzed at Ziway Soil Research Center, for composite surface soil (0-30 cm depth) samples collected before sowing of the crop. On the basis of particle size distribution, the soil contained 37.9% sand, 45.9% silt and 16.2% clay (Table 1). According to the soil textural class determination triangle, the soil of the experimental site is loam which is suitable for durum wheat production (Miyan et al., 2011).
The available P content of the soil was 6.8 ppm which was medium according to the rating of Landon (1991). This indicates the need for external application of phosphorus fertilizer sources for good crop growth and yield (FAO, 2008). The soil reaction of the experimental site (pH = 5.6) is moderately acidic, according to the rating of Tekalign (1991). According to Roy et al. (2006), the suitable pH range for wheat crop is between 5.5 and 7.0. Thus, the pH of the experimental soil is within the range for productive soils.
Percent organic matter content of the soil is 3.1 and medium according to Tekalign (1991) which indicates that the soil has medium potential to supply mineralizable nitrogen to the plants during growth. Electrical conductivity of the experimental soil is 0.17 mmhos/cm and low according to rating of Horneck et al. (2011), which indicates the suitability of the soil for crop production.
Cation exchange capacity (CEC) is an important parameter of soil, because it gives an indication of the type of clay mineral present in the soil and its capacity to retain nutrients against leaching. According to Landon (1991), top soils having CEC greater than 40 cmol (+) kg-1 are rated as very high, 25 - 40 cmol (+) kg-1 as high, 15 - 25, 5 - 15 and < 5 cmol (+) kg-1 of soil are classified as medium, low and very low, respectively, in CEC. According to this classification, the soil of the experimental site had high CEC (28.36 meq/100 g soils).
Tekalign (1991) has classified soil total N content of < 0.05% as very low, 0.05 - 0.12% as poor, 0.12 - 0.25% as moderate and > 0.25% as high. According to this classification, the soil samples were found to have moderate level of total N (0.17%) (Table 2), indicating that the nutrient is a limiting factor for optimum crop growth. The available sulfur content of the soil was 6.5 ppm which is medium according to the rating of Horneck et al. (2011).
Crop phenology and growth parameters
Days to 50% heading
Analysis of variance revealed that days to 50% heading was not significantly affected by main effect of blended NPS fertilizer rates and supplemented N rates. Moreover, blended NPS and N supplemented did not significantly interact to influence days to 50% heading. However there was significant (P < 0.05) difference between treated mean and control mean where the treated mean reached days to heading at late (56.78 days) than the control treatment 54.67 days. This result showed that days to heading ranged between 56.33 to 57.67 days. Delay of treated mean for days to heading might be due to adequate NPS in the soil which kept vegetative growth active and consequently resulted in delayed days to 50% heading.
Days to 90% physiological maturity
The main effects of supplemented N rates were highly significantly (P < 0.01) on days to 90% physiological maturity. However, the main effect of blended NPS fertilizer rates and interaction effect of the two factors did not significantly influence days to 90% physiological maturity, but significant (P < 0.05) variation was also found between treated mean and control mean for days to 90% physiological maturity.
Significant variations were found among the different levels of supplemented N for 90% physiological maturity period. Increasing the amount of supplemented N increased highly significantly days to 90% physiological maturity. The highest number of days required for 90% physiological maturity (103 days) was recorded in the highest rate of N supplemented (92 kg N ha-1) while no N fertilizer supplementation showed the shortest growth period for days to 90% physiological maturity (99 days). Increasing the rate of N supplemented from 0 to 23 and 23 to 46 kg ha-1 increased days to physiological maturity by 0.60%, which were statistical at par. Likewise, the treated mean delayed physiological maturities by 5.78% as compared to control mean (Table 1).
The prolonged time period required by the plants to reach maturity at higher rate of nitrogen may be attributed to the increase in leaf area duration, increased vegetative growth and increased light use efficiency. In line with this result, Shazma et al. (2016) reported that, increasing the rates of nitrogen resulted in increased number of days taken to maturity of wheat crop where the maximum days to maturity (170) was taken by the plots treated with 150 kg N ha-1 and less number of days to maturity (160) was observed in control plots.
Generally, the number of days to maturity recorded as mean of all treated plots was significantly higher than that of unfertilized plot. The result is also in agreement with Yohannes (2014) who reported that increasing of N application significantly prolonged days to physiological maturity of bread wheat at Haramaya and Meta where maximum number of days to physiological maturity (110) and (105.7) days were observed under plots received 138 kg N ha-1 in three splits while the lowest (105.7) and (102.7) days were recorded from 46 kg N ha-1 with two split applications at Haramaya and Meta respectively.
Grain filling period
The main effects of N supplemented rates was highly significantly (P<0.01) on grain filling period (Table 3). However, the main effect of blended NPS fertilizer rates and interaction effect of the two factors did not significantly influence grain filling period. There was significant difference (P<0.05) between control mean and treated mean for days to grain filling period.
Grain filling period, which is the number of days from heading to maturity, was increased with increasing rate of supplemented N. Thus, increasing the rates of N supplemented from nil to the highest 92 kg N ha-1 increased days for grain filling period by about 7.76%. Similarly, the treated mean delayed grain filling period by 8.34% as compared to control mean (Table 1) Increased grain filling period as the nitrogen rates increased might be due to sufficient soil nitrogen present in the soil that makes plants to take up nitrogen from the time the roots begin to function until all uptake of nutrients ceases with maturity which could have extended green canopy duration by delaying whole plant senescence and extend the grain filling period.
This result is in line with Sofanyas (2016) who reported, increased grain filling period with increasing of N rates and recorded the maximum (33.44) and (45.11) days for bread wheat at Suluh site in Hawzien and Atsela and Ayba in Emba Alaje, respectively, in Tigrayi Region.
Plant height
Analysis of variance showed that the main effects of blended NPS and supplemented N rates was significant (P<0.05) on plant height while the interaction effect of the two factors was not significant. However significant (P<0.05) variation was also found between treated mean and control mean for plant height.
Increasing the amount of both NPS and N rates significantly increased plant height. The maximum application rate of blended NPS (200 kg ha-1) r esulted in the highest plant height (79.59 cm). Similarly, the highest plant height (79.49 cm) was recorded in the highest N rate (92 kg ha-1) supplemented while no N fertilizer supplementation showed the shortest plant height (76.58 cm) (Table 1). Similarly, treated mean increased plant heights by 9.47% as compared to control mean (Table 1).
The increased plant height in response to increasing rate of nitrogen application was probably due to the vital role of N fertilizer in promoting the vegetative growth and resulted in significant increase in plant height. In agreement with this result, Abdo et al. (2012) found maximum plant height of 89.4 cm for durum’s wheat at maximum application of 69 kg N ha-1.
Moreover, this result is in line with results of Melesse (2017) who reported that application of N and P fertilizer rates highly significantly (P<0.01) increased plant height of bread wheat and recorded the highest height of 94.18 and 90.56 cm at applications of 69 kg N ha-1 and 30 kg P ha-1, respectively. The result is also parallel with Dagne (2016) who reported that application of Togo blended fertilizer NPKSBZn (26:11:11:3.5:0.15:0.6) kg ha -1 with micro nutrient Cu+Zn (5+5 L ha-1) increased plant height of maize by 66.81% over control plot and 6.11% over recommended NP fertilizers at Kejo farmers field.
Yield components and yield
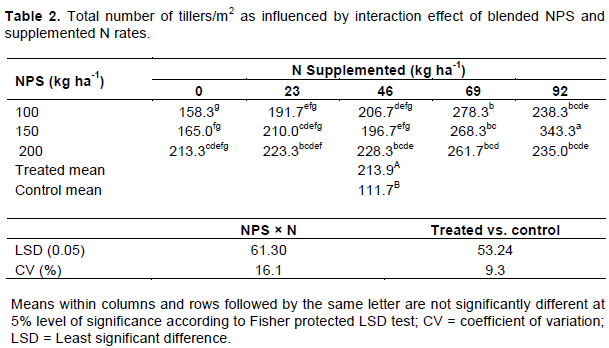
Total number of tillers
Main effect of supplemented N was highly significant (p<0.01) on total numbers of tillers per m2 while the effect of blended NPS rate was not significant. Moreover, the interaction effect of NPS and supplemented N rates was significant (P<0.05) on total numbers of tillers per m2. Similarly, there was significant (P<0.05) difference between control mean and treated mean on total number of tillers/m2. The highest number of tillers (343.3 per m2) was obtained at 150 kg NPS ha-1 and 92 kg N ha-1 supplemented while the lowest total number of tillers (158.3 per m2) was recorded at 100 kg NPS ha-1 with nil N supplemented (Table 2). Total number of tillers per meter square variably responded to blended NPS and N supplemented. The treated mean increased total number of tillers/m2 by 91.5% over control mean.
The highest number of tillers at the highest rates of NPS and N might be due to the increase in number and size of growing cells, ultimately resulting in increased number of tillers. The improvement in total number of tillers with NPS application might be due to the role of P found in NPS in emerging radicle and seminal roots during seedling establishment in wheat (Cook and Veseth, 1991). This result is in agreement with that of Shay et al. (2011) where they obtained the highest tillers (348.00 per m2) in treatment that received the highest nitrogen (120 kg N ha-1) than control (235.30 per m2). Similarly, Mahammad (2015) reported significant increase in number of tillers of bread wheat as application of NPK enhanced from 0-0-0 to 175-75-50 kg ha -1, respectively, and recorded the maximum number of tillers (389 per m2) at application of 140-75-50 kg NPK ha-1. Generally, number of tillers per plant recorded as the mean of overall treated plots was significantly higher (213.9 per m2) than the unfertilized plot/control (111.7 per m2) (Table 2).
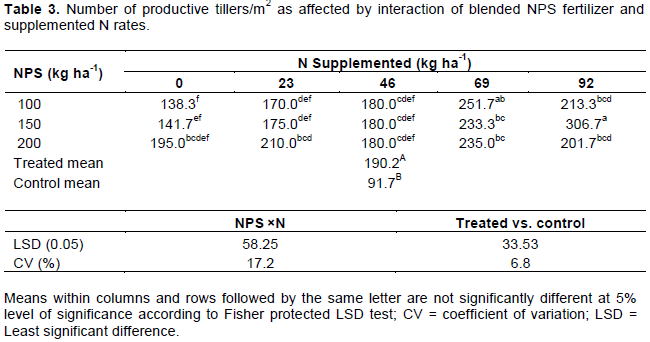
Number of productive tillers
Main effect of supplemented N was highly significant (p <0.01) on total numbers of productive tillers/m2 while blended NPS rate was not significant. Moreover, the interaction effect of blended NPS and supplemented N was significant (P <0.05) on numbers of productive tillers/m2. Also, there was significant (P <0.05) difference between control mean and treated mean on total number of productive tillers/m2.
The highest number of productive tillers (306.7/m2) was obtained at 150 kg NPS ha-1 and 92 kg N ha-1 supplemented while the lowest number of productive tillers (138.3/m2) was recorded at 100 kg NPS ha-1 with nil supplemented N (Table 3). Similarly, number of productive tillers was higher by 107.4% over without fertilizer application. Total number of productive tillers per meter square variably responds to blended NPS and N supplemented as enhanced from the lower rates to the highest rates. The increase in the number of productive tillers produced in response to the increased application rates of N fertilizer may be due to the roles played by N in enhancing tiller production by the plant. Thus, stimulation of tillering with optimal application of N might be due to its positive effect on cytokinin synthesis.
This result is concurrent with Chonde (2015) who reported maximum fertile tillers/m2 (290.5) with the application of 150 kg N ha-1 and 100 kg P2O5 ha-1. Likewise, Mengistu (2015) recorded highest number of productive (416 tillers/m2) in treatment that received 175 kg N ha-1 than control (317.1 tillers per m2). Also, Assefa et al. (2015) reported that combined application of 138/115 kg/ha N P205 resulted in maximum number of effective tillers (319.7 per m2) and increased number of effective tillers by 19.2% as compared to blanket recommendation (46 N/46 P205) kg/ha.
Number of kernels per spike
Analysis of variance showed that number of kernels per spike was not significantly affected by main effects of blended NPS fertilizer and supplemented N rates. Interaction of blended NPS fertilizer and supplemented N rates did not significantly influence number of kernels per spike. In addition there was no significant difference between treated mean and control mean on number of kernels per spike.
The possible reason for non-response of number of kernels per spike to applied NPS and N rates might be due to the low level of difference in nutrient amount among treatments which translocated from vegetative part to kernels during grain filling stage. This result indicated the number of kernels per spike ranges in between 37.67 (100 NPS, 0 N) to 47.60 (100 NPS, 92 N) kg ha -1.
Thousand kernels weight
Main effect of supplemented N showed highly significantly (P < 0.01) effect while main effects and interaction blended NPS did not show significant effect on thousand kernels weight. However, there was significant (P<0.05) difference between control mean and treated mean on thousand kernels weight. Abdo et al. (2012) found thousand kernels weight ranges of 42.5 to 49.5 g for durum wheat varieties.
The maximum thousand kernels weight (50.49 g) was recorded in response to nitrogen supplemented at rate of 92 kg ha-1. While the lowest (47.39 g) was recorded from plot treated with zero N kg ha-1 supplementation and there was an increment of 6.54% in thousand kernels weight among the highest 92 kg ha-1 and zero N supplementation (Table 4). Also, treated mean was higher by 6.56% over control mean (Table 4) which could be due to improvement of seed quality and size due to nitrogen.
In line with this result, Rahman et al. (2011) reported maximum 1000 kernels weight (49.4 g and 46.6 g) for wheat in two consecutive years by application of 120 kg N ha-1. Moreover, Mandic et al. (2015) and Ali et al. (2016) reported enhanced thousand kernels weight with increased nitrogen level from nil to the highest. Tilahun et al. (2017) also reported the highest thousand kernels weight (59.99 g) at the highest N rate (92 kg ha-1) for durum wheat.
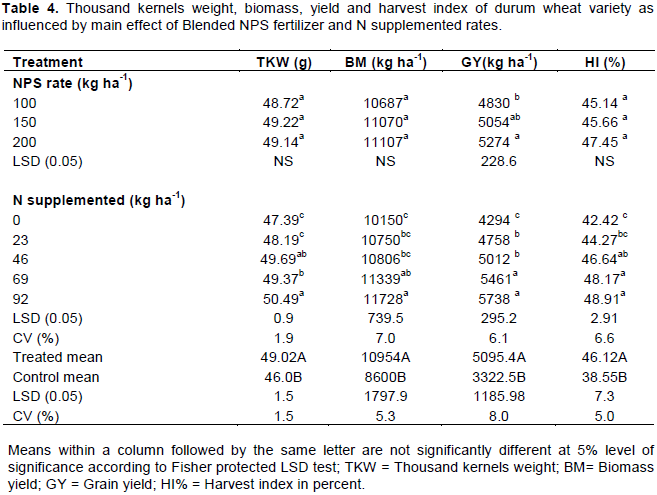
Biomass yield
Biomass yield was highly significantly (p < 0.01) affected by the main effects of N supplemented but the main effect of blended NPS fertilizer rates as well as its interaction with N supplemented did not significantly influence biomass yield. Also, there was significant (P<0.05) difference between control mean and treated mean on biomass yield.
Biomass yield increased as the rate of N supplemented increased from zero to 92 kg N ha-1. Maximum biomass yield (11728 kg ha-1) was obtained at maximum (92 kg N ha-1) supplemented N and lowest biomass yield (10150 kg ha-1) was obtained at nil N supplemented. Also, the biomass from the treated mean was higher by 27.37% over control mean (Table 4).
The increase in biological yield with supplemented N rates might be due to sufficient nitrogen in the soil which favors vegetative wheat plant growth such as leaf area, leaf area index (LAI) which increases light interception and so more total dry matter production occurred at various growth stages. The result was in conformity with report of Assefa et al. (2015b) who reported that biomass yield of bread wheat increased with increasing applied NP fertilizer in a consistent manner and reported highest biomass yield (11.89 t/ha) at the highest rate of (138/115 N/P2O5 kg ha-1).
Grain yield
Main effect of blended NPS fertilizer and supplemented N rates had significant (p < 0.05) and highly significant (p<0.01) influence, respectively, on grain yield (Table 4). However, the interaction of blended NPS fertilizer and supplemented N rates did not significantly influence grain yield. On the other hand there was significant (P<0.05) difference between control mean and treated mean on grain yield.
Increasing the rates of blended NPS fertilizer from 100 to 200 kg ha-1 and supplemented N from 0 to 92 kg ha-1, the grain yield showed consistent increase. The highest grain yield (5274 kg ha-1) and (5738 kg ha-1) was obtained in response to application of 200 kg ha-1 blended NPS and 92 kg ha-1 N supplemented, respectively. While the lowest grain yield (4830 kg ha-1) and (4294 kg ha-1) was obtained in response to application of 100 kg ha-1 blended NPS and zero kg ha-1 supplemented N, respectively. Similarly, treated mean increased grain yield by 53.36% over control mean (Table 4). The highest (200 kg ha-1) and the lowest 100 kg ha-1 blended NPS fertilizer rates were statistically at par with 150 kg NPS ha-1. Apart from nil rates of N supplemented, the preceding rate was not significantly different from the succeeding rates. Generally the highest (200 kg ha-1) of blended NPS and the highest 92 kg ha-1 of supplemented N enhanced grain yield by 9.2 and 33.6% as compared to 100 kg NPS ha-1 and nil N kg ha-1 supplemented, respectively.
The highest grain yield at the highest NPS and N rates might have resulted from improved root growth and increased uptake of nutrients and better growth favored due to synergetic effect of the three nutrients which enhanced yield components and yield. Nitrogen affects the vegetative as well as yields whereas phosphorus plays a fundamental role in metabolism and energy producing reaction and can withstand the adverse environmental effects, thus resulting in enhanced grain yield.
This result is concurrent with Shah et al. (2011) who reported maximum grain yield (4145.14 kg ha-1) from plots treated with 120 kg N ha-1, while minimum grain yield (2479.17) was recorded from control plots. The result is also in agreement with Bereket et al. (2014) who reported that grain yield of bread wheat significantly increased due to the main effect of nitrogen and phosphorus fertilization as well as obtained highest grain yields (4443 kg ha-1) and (3988 kg ha-1) at applications of 138 kg N ha-1 and 69 kg P2O5 ha-1, respectively. Malle et al. (2017 reported that application of 100 kg N/ha in combination with 13.6 kg S ha-1 resulted in highest grain yield of 9.26 tons ha-1 while the lowest 3.47 tons ha-1 was recorded from control plot for winter wheat.
Harvest index
Analysis of variance showed that harvest index (%) was significantly (p < 0.05) affected by main effect of supplemented N rates. However, the main effects of blended NPS fertilizer and the interaction of both factors did not significantly influence harvest index where there was significant (P < 0.05) difference between control mean and treated mean on harvest index.
Harvest index was increased with increasing application of N supplemented. The maximum harvest index (48.91%) was recorded with N supplemented at rate of 92 kg ha-1 which was statistically at par with preceding N supplementation of 69 and 46 kg ha-1 while the lowest harvest index (42.42%) was recorded with nil supplemented N. Similarly, in the treated mean, the harvest index was higher by 19.64% over control mean (Table 4) which was statistically at par with N supplementation of 23 kg ha-1. The increment in harvest index at highest rate of supplemented N might be attributed to greater photo assimilate production and its ultimate partitioning into grains compared to partitioning into straw, that is, proportionally higher grain yield than vegetative biomass yield.
In agreement with this result, Liu and Shi (2013) reported increased harvested index of winter wheat as N application increased from nil to 225 kg ha-1 and obtained the highest harvest index of 0.45 at the highest N rate of 225 kg ha-1. Esayas (2015) reported that durum wheat variety variably responded to blended fertilizers (N, P, S, Zn and B) and obtained the highest harvest index (33%) for variety Yerer and 42% for varieties Mangudo and Mukiye.
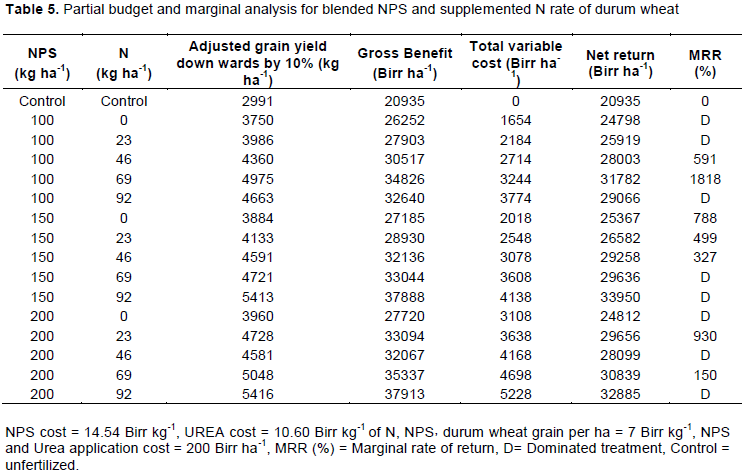
Partial budget analysis
To identify treatments with the optimum return to the farmer’s investment, marginal analysis was performed on non-dominated treatments. For a treatment to be considered as worthwhile to farmers, between 50 and 100% marginal rate of return (MRR) was the minimum acceptable rate of return (CIMMYT, 1988). As indicated in Table 5, the partial budget and dominance analysis showed that the highest net benefit 31,782 Birr ha-1 was obtained in the treatment that was treated with 100 kg ha-1 blended NPS and 69 kg ha-1 N supplemented while the lowest net benefit 2,0935 Birr ha-1 was obtained in the control treatment. The highest marginal rate of return 1.818% was obtained from the plot treated with 100.69 kg ha-1 blended NPS and N supplemented respectively. According to this criterion, a farmer’s investment of one Birr in 100.69 kg ha-1 NPS and supplementation N on durum wheat variety (Ude) recoups the one Birr and gives an additional 18.18 Birr.
Low volumes and poor quality of the national durum wheat production compels Ethiopia pasta industries to import the required raw material. Proper amount of fertilizer application in type and amount is the major constraints limiting durum wheat yield and grain quality. Due to this, Ethiopia is moving towards diversification and away from blanket recommendation of DAP and Urea, which have long been the only types of fertilizer imported for grain crops to blended fertilizer NPS which contains nutrients N: P2O5: S: 19:38:7. However, no studies have been undertaken in the study area on the effect of blended NPS on productivity and quality of durum wheat. Hence, field experiment was carried out to determine the effect of blended NPS in combination with supplemental nitrogen on growth, yield and grain quality of durum wheat in Arsi Negelle district, on a farmer’s field during 2016 cropping season.
The treatments consisted of factorial combination of three levels of NPS (100, 150 and 200 kg ha-1) and five levels of supplemental nitrogen (0, 23, 46, 69 and 92 kg ha-1) and control (no fertilizer). The experiment was laid out as a randomized complete block design (RCBD) and replicated three times per treatment. The main effect of blended NPS fertilizer was not significant on crop phenology, growth parameters and yield components parameters, but it significantly (P < 0.05) influenced plant height and grain yield. Increasing the rate of blended NPS fertilizer from 100 to 200 kg ha-1 increased grain yield and the highest grain yield (5274 kg ha-1) was obtained at the highest (200 kg ha-1) of blended NPS fertilizer.
The main effect of supplemented N fertilizer was significant on crop phenology and growth parameters except days to heading, yield components and yield parameters excluding number of kernels per spike, days to heading, number of kernels per spike, with all tested parameters highly significantly (p<0.01) influenced by supplemented N fertilizer. The 92 kg N ha-1 gave the highest thousand kernels weight (50.49 g), highest days for 90% physiological maturity (103 days), grain filling period (46.22 days), plant height (79.49 cm), biomass (11728 kg ha-1), grain yield (5738 kg ha-1), and harvest index (48.91%). The result also indicated that number of total tillers per m2 and productive tillers per m2 was significantly influenced by interaction of blended NPS fertilizer and supplemented N where the highest total tillers (343.3 per m2) and productive tillers (306.7 per m2) was obtained at combination of 150 kg NPS ha-1 and 92 kg ha-1 N supplemented. Moreover, the result indicated that apart from number of kernels per spike, the fertilizer treated means were significantly higher over control (no fertilizer application).
The economic analysis revealed that for a treatment to be considered worthwhile to farmers (100% marginal rate of return), application of 100 kg NPS ha-1 with 69 kg N ha-1 supplementation are profitable and recommended for farmers in Arsi Negelle district.