ABSTRACT
Jatropha curcas is a tree species introduced in Niger as a trial experiment to offset land degradation and for biofuel production. The objective of this study is to contribute to the understanding of this species’ potential for adaptation under the edaphic and climatic conditions of Niger through analysis and modeling of the leaf area dynamics. The nondestructive method is used to evaluate the leaf area growth using four provenances and 120 samples of leaves of J. curcas plants. The results show that leaf area is optimal during the wet season of the year with non-significant difference (P > 0.05), while during other periods it is significant (P < 0.05) between provenances. The logarithmic model is the most accurate, and the models developed have a correlation coefficient between 0.95 and 0.99. The error analysis shows a mean absolute percentage of error between 5.92 and 27.43%, depending on the provenances. The accuracies of the developed models were appreciated, with root mean square of error varying from 0.72 to 2.06 cm2. Contrary to the expectation, for production of J. curcas in Niger’s Sahelian climate and soil, it is necessary to ensure additional irrigation water to the plants, especially during the dry period of the year.
Key words: Exotic species, Jatropha curcas, adaptation, leaf area models, Niger.
Jatropha curcas is a latex shrub, native to America, from the family of Euphorbiaceae. This species is widespread in Africa in the Sudanian and Guinean savannas (Arbonnier, 2009). The tree species is considered for its multifaceted socioeconomic and environmental importance to society (Pandey et al., 2012; Bazongo et al., 2015; Traore et al., 2015). It improves the physicochemical properties of soils and crops’ yield. Its action in environmental protection through soil and water erosion control and the potential for carbon sequestration and biofuel production is quite remarkable (Openshaw, 2000; Berchmans and Hirata, 2008; Pandey et al., 2012; Bayen et al., 2016). In Niger, this species was introduced in 2000 in the research centers to understand its cycle of growth and development (Zakari, 2013). J. curcas can tolerate less than 300 mm of rain per annum and up to 40 °C in temperature (Pandey et al., 2012). The development of this species in the edaphic and climatic conditions of Sahel Niger, marked by less than four moist months and a high maximum temperature in the year, is led necessarily by its adaptation. In semi-arid and arid areas, woody species seek a compromise between survival and safety through leaf and twig shedding during the hard period of the year (Gleason et al., 2016). The transpiring area is an important indicator of the growth and development of the plant. The plant total leaf area provides information on the photosynthetic capacity and on the assessment of water losses by the flow of perspiration (Nemecek-Marshall et al., 1995; Lamade, 1997). Some studies indicate that the leaf area index can be a useful parameter for predicting the effects of vegetation upon microclimate, which could be used to make small-scale climate predictions (Hardwick et al., 2015).
In addition, the leaves are organs oriented for the interception of light, which is necessary for the photosynthesis mechanism. The light is captured by a wide range of chloroplasts straddling the air and the vascular tissues that drain water and export the products of photosynthesis (Lambers et al., 1998). Preliminary observations have shown that J. curcas eliminates leaves and twigs or reduces leaf area during periods of limited humidity (Ouédraogo, 2006; Moussa et al., 2017). Ouédraogo (2006) explained this phenomenon as an adaptation of the plant to the conditions of the environment. This kind of physiological mechanism aspect of drought stress could have an impact on the productivity of the species because reducing the leaf area would induce a reduction in CO2 assimilation rates and photosynthetic activities (Reddy et al., 2004). Despite its wide distribution throughout the world and its tolerance to drought (Ouédraogo, 2006), the development of J. curcas is still problematic in the arid conditions of Sahel Niger (Moussa et al., 2017). Thus, it is necessary to refine our knowledge of biology, especially the dynamic and foliar production of J. curcas in the edaphic and climatic conditions of Sahel Niger, so as to make better decisions when managing agrosystems. It is specifically necessary to understand the dynamic of the leaf area of ​​this species and to model it according to the time of growth. The modeling of the leaf area of J. curcas plants will make it possible to predict and, especially, to determine its rhythm of growth in order to better understand its elasticity. To carry out this study, two hypotheses were posed: (i) the growth of the leaf area in J. curcas plants depends on the period of the year (wet, dry, cold) in the Sahel and (ii) the dynamic of the leaf area in J. curcas plants follows an appropriate distribution that the analysis makes possible to determine.
Site
The trial was conducted at the Faculty of Agronomy in Abdou Moumouni University of Niamey, on a site located at latitude 2° 08'E and 13° 30'N. The meteorological data used were those of Niamey airport station. The data covered a period of ten years. The main climatic factors analyzed were rainfall, temperature, evapotranspiration, and relative humidity. The annual average rainfall was 535 ± 127 mm. The annual average temperature was 29.8 ± 0.98°C. The number of months during which water was used by the roots of plants was three months from July to September (Moussa et al., 2017). Winds were of two types: the harmattan blowing in the hot weather with high intensity from October to March and the monsoon wind of the rainy season. The soil was the leached ferruginous tropical kind. Analysis of soil samples from the site showed a sandy loam texture with a relatively neutral pH equal to 6.46. The total exchange capacity of the soil was 11.33 me/100 g. The available phosphorus and C/N were 36.44 ppm and 11.35% respectively.
Biological and experiment material
The biological J. curcas seed materials used in this study came from four provenances, namely Guinea-Bissau, Mali, Mexico, and Senegal. These materials were planted in a randomized complete block design. The block was composed of five lines of seed holes, each measuring 1m x 1m. Along each line, three seeds per seedling from each origin were sown in alphabetical order. The total number of seed holes was twelve on a line and sixty on the block. The block size was 13 m × 6 m.
Trial implementation and monitoring operations
Direct seeding was conducted on August 25, 2008 at four seeds per hole. After seed germination and seedling emergence, thinning to one plant per hole and resowing were carried out on September 25, 2008. In October 2008, corresponding to the inception of the dry season, the setting up of the trial was completed. During the dry period (October 2008-May 2009), regular watering was conducted every three days at twelve liters for three seed holes. In the next rainy season (June-September 2009), weeding was carried out. A phytosanitary treatment was carried out on September 15, 2009 with the Pyrical 480 EC. It was applied at a concentration of 70 ml of Pyrical in 15 L of water using a backpack sprayer or about 470 mg/L according to the standard, which was 480 mg/L. The purpose was to limit the damage caused by termites.
Measurement of leaf area
The measured sample was composed of ninety leaves including thirty each from the basal, median, and apical. Leaf area was measured by a nondestructive method. This method determined directly the leaf area without cutting (Lamade, 1997). To do this, the leaf of J. curcas was spread carefully on graph paper. The contour of the leaf was drawn using a criterion of 0.5 mm diameter. The area was given by counting the number of mm² intercepted by the leaf. These measures were assessed monthly from July to September. The data were used to calculate the average leaf area for the four provenances based on the measurement period. The total leaf area of a plant gives information on its photosynthetic capacity and the assessment of water loss by transpiration stream (Lamade, 1997; Hardwick et al., 2015). One-way ANOVA was used to compare the location mean of leaf area according to the same period of measurement at 95% of confidence level.
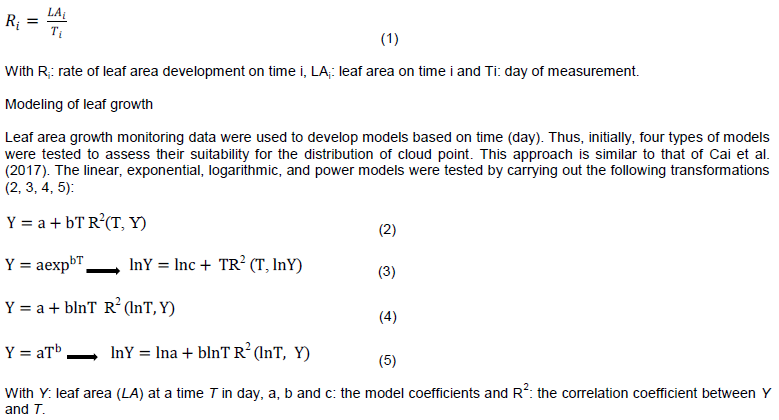
The leaf growth of J. curcas from a young age to maturity was followed. The measurements were carried out at the beginning of the rainy season on July 10, 2009 and ended on August, 2009, after leaf area growth remained constant. A sample of thirty young leaves (two days old after identification of the bud) was selected by location. These were labeled using a sewing thread to be distinguished. The area of each sampled leaf was determined every two days at the same hour by the direct method as described earlier. To illustrate the degree of leaf growth, the rate of leaf area multiplication by the time was calculated using the following formula (1):

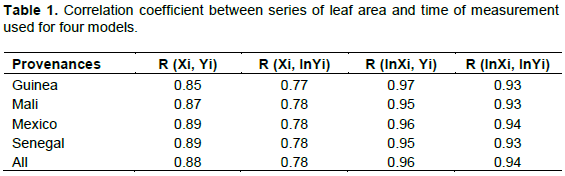
The best fit of the model was sought on the basis of the strong correlation between leaf area and number of growth days. The logarithmic model of the form Y = a + blnT was used because of the greater correlation between the Y (leaf area) and lnT (numeric logarithm of number of days) recorded parameters (Table 1). Thus, the model was developed using the R Commander Software version 2.15.3. The generalized linear model with Gamma link function was used to prevent the back-transformation problem (Ketterings et al., 2001; Packard, 2013). All leaf areas with standardized residues that deviated from the majority of individuals were considered outliers and discarded. This approach has been widely used in many biomass modeling studies (Zuur et al., 2010; Bayen et al., 2016; Moussa and Larwanou, 2018). This resulted in two series of data (leaf area and time), whose variance of residues was relatively homogeneous. Finally, the modeling was based on these last data.
Analysis of error
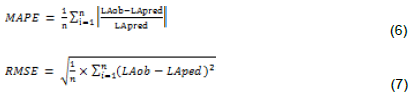
The model reliability was assessed by examining the mean absolute percentage of error (MAPE) and the root mean square of error (RMSE). The MAPE expresses the average percentage of error in absolute value, which may be misleading when predicting leaf area for a model. The RMSE is a model selection parameter used to aggregate errors into a single predictive power (Fayolle et al., 2013; Yao et al., 2013). The MAPE and RMSE were calculated using the following formulae:
Where, n is number of measurements, LApred is predicted leaf area and LAob is observed leaf area.
The model is considered to be reliable when MAPE and RMSE are weak. In some cases, according to Sileshi (2014), errors are tolerable in a model with a MAPE less than 10.
Leaf area
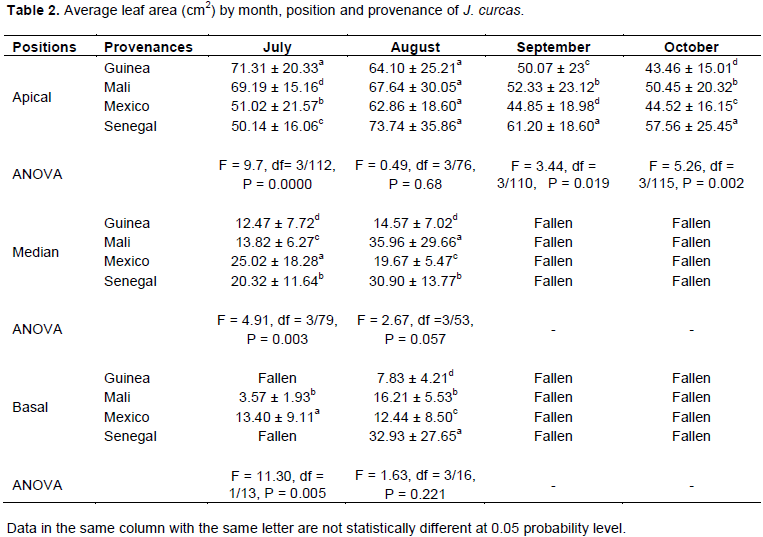
Table 2 shows that it was only in August and, to a lesser extent, in July that J. curcas plants carried basal, median, and apical leaves. During the other months of the study (September and October), only apical leaves were reported. In July (rainy season), the apical leaf area was 71.31 ± 20.33 cm2 for Guinea, 69.19 ± 15.16 cm2 for Mali, 51.02 ± 21.57 cm2 for Mexico, and 50.14 ± 16.06 cm2 for Senegal. Statistical analysis showed a highly significant difference between leaf areas in the apical position of these provenances (P = 0.000). The Guinea and Mali provenances had the largest apical leaf area compared to Mexico and Senegal in July 2009. The median leaf area was 12.47 ± 7.72 cm2 in Guinea, 13.82 ± 6.27 cm2 in Mali, 25.02 ± 18.28 cm2 in Mexico, and 20.32 ± 11.64 cm2 in Senegal. Statistical analysis of variance showed a significant difference between leaf areas in the median position of these provenances (P < 0.05). In July, the leaf areas of Mexico and Senegal in the median position were wider than those of Guinea and Mali. In the basal position, the leaf area was 3.57 ± 1.93 cm2 in Mali and 13.40 ± 9.11 cm2 in Mexico. The Guinea and Senegal provenances did not carry basal leaves in July. The statistical analysis of variance expressed a significant difference between the leaf areas in the basal position of the Mali and Mexico provenances (P < 0.05). Mexico had the widest basal leaf area compared to Mali. In August, the leaf area varied slightly compared to the previous month, and no significant differences were found in the apical position (P > 0.05). Therefore, significant differences were found in the median and basal positions (P < 0.05). In September and October, the apical leaf area of the plants decreased. It was 43.46 ± 15.01 cm2 for Guinea, 50.45 ± 20.32 cm2 for Mali, 44.52 ± 16.15 cm2 for Mexico, and 57.56 ± 25.45 cm2 for Senegal in October (the period marking the end of the rainy season). The ANOVA showed a significant difference between the apical leaf areas of these provenances (P < 0.05). The leaf area of Senegal had the highest apical area of the four countries in October.
Growth of leaf area
Figure 1 shows sigmoid curves in three phases: During the first phase, A, young leaves grew slowly. This lasted about six days. Thus, on the sixth day, the leaf area reached 8.53 ± 2.67 cm2 for Guinea, 7.65 ± 4.86 cm2 for Mali, 8.50 ± 4.49cm2 for Mexico, and 6.09 ± 3.08 cm2 for Senegal. The growth rate of the leaf area was 1.42 cm2/d for Guinea, 1.27 cm2/d for Mali, 1.41 cm2/day for Mexico, and 1.01 cm2/day for Senegal. The ANOVA showed a significant difference among provenances on the sixth day of leaf growth (F = 3.1, df = 3/96, P = 0.031). The second phase, B, was marked by a strong growth of the leaf area. This phase extended from the seventh to the twentieth day. On the twentieth day, the leaf area reached 57.14 ± 13.37 cm2 (Guinea), 62.30 ± 9.70 cm2 (Mali), 73 ± 18 cm2 (Mexico), and 58.78 ± 22.70 cm2 (Senegal). The growth rate of the leaf area, which increased strongly and reached its maximum at the twentieth day, was 2.85 cm2/d (Guinea), 3.11 cm2/d (Mali), 3.65 cm2/day (Mexico) and 2.94 cm2/day (Senegal).
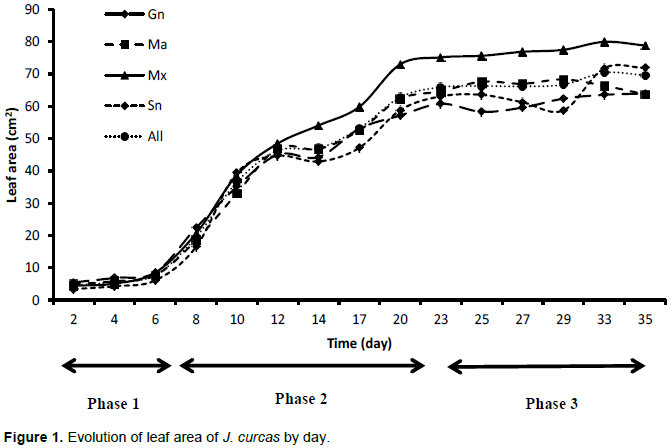
The ANOVA showed a statistically significant difference between provenances (F = 3.68, df = 2/95, P = 0.015). On the twentieth day of growth, the leaves of J. curcas plants from Mexico and Mali were wider than those from Guinea and Senegal. Finally, a third phase, C, was marked by the appearance of a plateau with a more or less stationary growth of the leaf area. Thus, until the thirty-fifth day, marking the end of measurement, the average leaf area hardly exceeded 63.98 ± 20.67 cm2 (Guinea), 63.71 ± 10.23 cm2 (Mali), 78.83 ± 23.93 cm2 (Mexico), and 71.90 ± 23.86 cm2 (Senegal). During this phase, the growth rate of the leaf area decreased and fell on the thirty-fifth day to 1.82 cm2/d (Guinea), 1.82 cm2/d (Mali), 2.25 cm2/d (Mexico), and 2.05 cm2/d (Senegal). ANOVA showed a nonsignificant difference between provenances (F = 0.38, df = 3/55, P = 0.766). On the thirty-fifth day of measurement, the variation in leaf area growth of J. curcas plants from Guinea, Mali, Mexico, and Senegal was not significant.
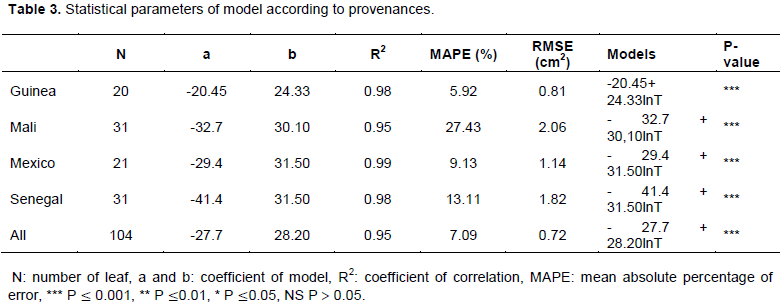
Model of growth of leaf area
The logarithmic models expressing the leaf area as a function of the measurement time were statistically representative for each provenance. The correlation was between 0.95 and 0.99. For the five models, the MAPE was 5.92, 27.43, 9.13, 13.11, and 7.09% for Guinea, Mali, Mexico, Senegal, and all provenances, respectively. It was highest for Mali and Senegal. The RMSE was equal to 0.81 cm2 (Guinea), 2.06 cm2 (Mali), 1.14 cm2 (Mexico), 1.82 cm2 (Senegal), and 0.72 cm2 (all provenances). This error was highest in Mali and Senegal (Table 3).
The introduction of new plant material in an environment presupposes knowledge of its growth and development cycle. J. curcas is a plant known for its ability to produce biofuel and contribute to improving the living conditions of rural communities. This plant has behaved well in the western part of West Africa (Ouedraégo, 2006). In Niger, in the Sahelian region, the first experiments showed an additional need for irrigation water for this species to complete its development cycle (Moussa et al., 2017; Zakari, 2013). Analysis of seasonal variation of leaf area is an important indicator in understanding the degree of adaptation of the plant to the environment (Cai et al., 2017).
A good compromise between water losses and gas exchange, particularly carbon dioxide, is a good indicator for improving biomass production and climate adaptation (Tardieu, 2005; Kim et al., 2017). Very often these exchanges take place through the leaf area. The development of the leaf area of J. curcas was most important during the wetter period (August) of the year.
From a general point of view, the water deficit leads to an architectural adjustment in the plant, which begins with the reduction of the transpiring area. In the worst case, leaves are eliminated, and small branches are taken to ensure survival (Gleason et al., 2016). Under the conditions of this study, where the water balance shows that the number of months during which the water is usable by the roots does not exceed three, namely July, August, and September (Moussa et al., 2017), the development of J. curcas under the dependence of rain water is of great concern. Despite a significant correlation being established between growth and adaptation in Euphorbiaceae, (Gleason et al., 2016), it nonetheless remains the case that J. curcas production requires water supplementation. Such observations of other growth parameters were made by Moussa et al. (2017), in particular on the growth in height, diameter, and multiplication of leaves and branches of J. curcas in Niger. In general, when the moisture decreases as in October, the plants lose water by perspiration through the leaves, and the leaf area decreases. Then, when water deficit is observed, the rate of cell division of the plant decreases; the cell walls, which have to deform to allow cell growth, become more rigid; and turgor decreases (Smith et al., 1997; François et al., 2006). This variability of leaf area by the season of the year for the same species has been observed elsewhere in Ulmus japonica (Cai et al., 2017). Even if the two species are different, this reflects the natural behavior of certain plant species in relation to the climatic conditions of the environment. The same observations were made between the dry periods of the year and the reduction in leaf area in many plant species by Kim et al. (2017). For the growth of young leaves of J. curcas, there are three phases: a slow phase, a phase of strong growth, and a stationary phase. The slow phase of early growth is due to the introduction of the compounds or structures necessary for growth. The active phase can be explained by accelerated cell divisions and growths. Finally, the stationary phase is the result of growth arrest and senescence of the cells (Heller, 1985). The peak of leaf growth is reached on average on the thirtieth day and usually there are fallen leaves after two months of growth. Ouédraogo (2006) observed a stunting of the leaves of J. curcas in a nursery on the forty-third day. The growth of leaves could also depend on environmental conditions and the intrinsic nature of the species. This has been demonstrated by the fact that leaf life and physiological function increase from deciduous to evergreen species and can ranged from 165 to 509 days, respectively (Brodribb et al., 2002; Athokpam et al., 2013).
Moreover, Humphries (1966) observed three relationships between area and cell number of successive leaves with the photoperiod: in phase (1), cell number increased at a greater rate than leaf area; in phase (2), leaf area decreased while cell number increased; in phase (3), cell number and leaf area decreased proportionally. These results corroborate those found in this study. For the data collected during this experimentation period, the logarithmic model responded the most compared to the other models. For the same species, leaf growth variation was confirmed by Cai et al. (2017). Depending on the time of year, the leaf area growth models developed by these authors can move from a linear model to a power model. The models developed in this study gave high correlation coefficients of close to 1. The validation of these models is not limited to the simple estimation of the correlation coefficient. A model can have a high coefficient of correlation and hide important errors. The analysis of MAPE revealed high errors between 5.92 and 27.43% in each of these models (Sileshi, 2014). These errors were higher in the Mali and Senegal provenances. This reflects the variability of leaf growth of these two provenances under the conditions of the experiment, which seemed more homogeneous in Guinea and Mexico. The low MAPE values of less than 10% indicate that these models were performing well. Even if these errors were high in Mali and Senegal, it is still possible to use the generic model of which they are weak. The accuracy of these models also remains significant with the low values of the RMSE, especially for the generic model and the provenances of Guinea and Mexico. Indeed, it is highly rare in the literature to find leaf area growth patterns. However, in some cases leaf area growth models have been developed with precisions of 93.96% and 96%, depending on the season of the year (Cai et al., 2017).
This study illustrated the dynamics of the leaf area of ​​J. curcas plants in sandy soil and the Sahelian climate of Niger. The growth of J. curcas leaves was more effective during the wet period of the year, including July and August, with a nonsignificant difference between provenances. At the lowest water deficit (September and October), J. curcas plants lost their medial and basal leaves and also reduced their transpiring area. To ensure the production of J. curcas under these conditions, it is necessarily important to provide the plant with a supplement of irrigation water at the end of the rainy season. The present study also saw the development of models of leaf area growth of J. curcas plants. To reach its full growth, the leaf took thirty days, following a sigmoid curve. The logarithmic model was chosen as the most efficient among the four types of tested models. These results are useful in understanding the cycle of growth and development of this plant in Niger. Better still, they will guide its management in agrosystems by the knowledge of its critical period of water need. The model thus developed can improve the production process of the species by predicting its leaf area to ensure good water efficiency.
The authors have not declared any conflict of interests.
REFERENCES
|
Arbonnier M (2009). Arbres, arbustes et lianes des zones sèches d'Afrique de l'Ouest. (3ème Edi.) Quoe, MNHN.
|
|
|
|
Athokpam FD, Garkoti SC, Borah N (2013). Periodicity of leaf growth and leaf dry mass changes in the evergreen and deciduous species of Southern Assam, India. Ecological Research 29 (2):153-165 .
Crossref
|
|
|
|
|
Bayen P, Bognounou F, Lykke A M, Ouédraogo M Thiombiano A (2016). The use of biomass production and allometric models to estimate carbon sequestration of Jatropha curcas L. plantations in western Burkina Faso. Environment Development Sustainability 18(1):143-156.
Crossref
|
|
|
|
|
Bazongo P, Traore K, Traore O, Bilgo A, Yelemou B, Sanon KB, Hien V, Nacro BH (2015). Caractérisation des systèmes de production de Jatropha dans les exploitations agricoles de la zone Ouest du Burkina Faso. International Journal of Biology and Chemistry Sciences 9(5):2432-2445.
Crossref
|
|
|
|
|
Berchmans HJ, Hirata S (2008). Biodiesel production from crude Jatropha curcas L. seed oil with a high content of free fatty acids. Bioresource Technology 99:1716-1721.
Crossref
|
|
|
|
|
Brodribb TJ, Holbrook NM, Gutiérrez MV (2002). Hydraulic and photosynthetic coordination in seasonally dry tropical forest trees. Plant, Cell and Environment 25:1435-1444.
Crossref
|
|
|
|
|
Cai H, Di X, Jin G (2017). Allometric models for leaf area and leaf mass predictions across different growing seasons of elm tree (Ulmus japonica). Journal of Forestry Research 28 (5):975-982 .
Crossref
|
|
|
|
|
Fayolle A, Doucet J-L, Gillet J-F, Bourland N, Lejeune P (2013). Tree allometry in Central Africa: Testing the validity of pantropical multi-species allometric equations for estimating biomass and carbon stocks. Forest Ecology and Management 305:29-37.
Crossref
|
|
|
|
|
François T, Pierre C, Jean-Louis D E, Triboï MZ (2006). Perception de la sécheresse par la plante. Conséquences sur la productivité et sur la qualité des produits récoltés. ESCo Sécheresse et agriculture.
|
|
|
|
|
Gleason SM, Westoby M, Jansen S, Choat B, Hacke UG, Pratt RB, Bhaskar R, Brodribb TJ, Bucci SJ, Cao K-F, Cochard H, Delzon S, Domec J-C, Fan ZX, Feild TS, Jacobsen AL, Johnson DM, Lens F, Maherali H, Martiınez VJ, Mayr S, McCulloh KA, Mencuccini M, Mitchell PJ, Morri H, Nardini A, Pittermann J, Plavcova L, Schreiber SG, Sperry JS, Wright IJ, Zanne AE (2016). Weak tradeoff between xylem safety and xylem-specific hydraulic efficiency across the world's woody plant species. New Phytologist 209:123-136.
Crossref
|
|
|
|
|
Hardwick SR, Toumia R, Pfeifer M, Turner EC, Nilus R Ewers RM (2015). The relationship between leaf area index and microclimate in tropical forest and oil palm plantation: Forest disturbance drives changes in microclimate. Agricultural and Forest Meteorology 201:187-195.
Crossref
|
|
|
|
|
Heller R (1985). Abrégé de physiologie végétale. Tome II. Développement (3èmeéd.). Masson.
|
|
|
|
|
Humphries EC (1966). Leaf growth of white mustard (Sinapis alba) in different environments. Planta 72(3):223-231.
Crossref
|
|
|
|
|
Ketterings QM, Coe R, van Noordwijk M, Ambagau Y, Palm CA (2001). Reducing uncertainty in the use of allometric biomass equations for predicting aboveground tree biomass in mixed secondary forests. Forest Ecology and Management 146:199-209.
Crossref
|
|
|
|
|
Kim K, Wang M-C, Sailesh R, Su-hong L, Xu J.-c, Zomer RJ (2017). Using leaf area index (LAI) to assess vegetation response to drought in Yunnan province of China. Journal of Mountain Science 14(9) :1863-1872.
Crossref
|
|
|
|
|
Lamade E (1997). Méthode rapide de mesure de l'indice foliaire du palmier à huile. Plantations, Recherche, Développement 4(6):385-389.
|
|
|
|
|
Lambers H, Chapin FS, Pons TL (1998). Photosynthesis, Respiration, and LongDistance transport. Plant Physiological Ecology, pp. 10-153.
Crossref
|
|
|
|
|
Moussa M, Larwanou M (2018). Allometric models for estimating aboveground biomass and carbon in Faidherbia albida and Prosopis africana under agroforestry parklands in drylands of Niger. Journal of Forestry Research 29(6):1703-1717.
Crossref
|
|
|
|
|
Moussa M, Chaibou I, Laminou OM, Banoin M (2017). Effet de l'écartement sur la croissance des jeunes plants de Jatropha curcas L. (Euphorbiacae) de quelques provenances au Sahel Niger. Afrique Science 13(1):24-39.
|
|
|
|
|
Nemecek-Marshall M, MacDonald RC, Franzen JJ, Wojciechowski C, Fall R (1995). Methanol Emission from Leaves. Enzymatic Detection of Gas-Phase Methanol and Relation of Methanol Fluxes to Stomatal Conductance and Leaf Development. Plant Physiology 108:1359-1368.
Crossref
|
|
|
|
|
Openshaw K (2000). A review of Jatropha curcas: an oil plant of unfulfilled promise.Biomass and Bioenergy 19:1-15.
Crossref
|
|
|
|
|
Ouédraogo M (2006). Etude biologique et physiologique du pourghère : Jatropha curcas L. (Euphorbiacae) en vue d'une meilleure production de carburant de substitution. Thèse de doctorat es-sciences naturelles. Université Ouaga I.
|
|
|
|
|
Packard GC (2013). Is logarithmic transformation necessary in allometry? Biological Journal of the Linnean Society 109:476-486.
Crossref
|
|
|
|
|
Pandey VC, Singh K, Singh JS, Kumar A, Singh B, Singh RP (2012). Jatropha curcas: A potential biofuel plant for sustainable environmental development. Renewable and Sustainable Energy Reviews 16:2870-2883.
Crossref
|
|
|
|
|
Reddy AR, Chaitanya KV, Vivekanandan M (2004). Drought-induced responses of photosynthesis and antioxidant metabolism in higher plants. Journal of Plant Physiology 161:1189-1202.
Crossref
|
|
|
|
|
Sileshi GW (2014). A critical review of forest biomass estimation models, common mistakes and corrective measures. Forest Ecology and Management 329:237-254.
Crossref
|
|
|
|
|
Smith SD, Monson RK, Anderson JE (1997). Plant Processes and Responses to Stress. Physiological Ecology of North American Desert Plants, pp. 45-71.
Crossref
|
|
|
|
|
Tardieu F (2005). Plant tolerance to water deficit: physical limits and possibilities for progress. External Geophysics, Climate and Environment 337:57-67.
Crossref
|
|
|
|
|
Traore M, Nacro HB, Doamba WF, Tabo R, Nikiema A (2015). Effets de doses variées du tourteau de Jatropha curcas sur la productivité du mil (variété HKP) en condition pluviale en Afrique de l'Ouest. Tropicultura 33(1):1925.
|
|
|
|
|
Yao X, Fu B, Lu Y, Sun F, Wang S, Liu M (2013). Comparison of four spatial interpolation methods for estimating soil moisturein a complex terrain catchment. PLoS ONE 8(1):5466.
Crossref
|
|
|
|
|
Zakari AH (2013). Entomofaune associée à Jatropha curcas L. au Niger et évaluation de l'activité insecticide de son huile. Thèse de Docteur en Sciences Agronomiques et Ingénierie biologique. Université De Liege - Gembloux Agro Bio-Tech.
|
|
|
|
|
Zuur AF, Leno EN, Elphick CS (2010). A protocol for data exploration to avoid common statistic problems. Methods Ecology and Evolution 1:3-14.
Crossref
|
|