ABSTRACT
The yield of upland rice (Oryza spp.) per unit area of production in Uganda is low, partly due to low soil fertility, and use of fertilizer and manure is also low. Trials to establish the response of upland rice to applied nutrients and economically optimal nutrient rates (EOR) were determined at Tororo, Kawanda and Kadesok. The increase in paddy yield was in the range of 91 to 173% with application of 50 to 120 kg N ha-1. Application of 10 kg P ha-1 and 20 kg K ha-1 resulted in a 10 to 46% additional increase, respectively. Nitrogen application was profitable for all cost of fertilizer to farm-gate price of produce (CP) ratios, with a three season mean economically optimum nutrient rate (EONR) ranging from 67 to 144 kg ha-1 and CP ratios varying from 2 to 12. Application of 10 kg P and 20 kg K ha-1 together with N reduced the mean EOR to a range of 47 to 97 kg ha-1 depending on the CP ratio. Application of Zn, S, B and Mg together with nitrogen, phosphorus and potassium fertilizer (NPK) increased paddy yield by 19% above the NPK yield of 3.7 t ha-1, indicating that either Mg, S, Zn and B or their combination limit rice production in Uganda. Trace elements were applied as a mixture. There is a need to establish which element limits rice production in addition to the economics of their use. This information is required for fertilizer blending in the region to produce blends of the right formulation. The cost of fertilizers increases with the nutrients applied, which has an implication for the appropriate quantity of fertilizers to be used. To reduce or stop soil degradation from nutrient mining requires interventions at policy level such as fertilizer subsidies, improved market for produce and input supply efficiency, and increased access to extension, information and credit by farmers.
Key words: Economic, fertilizer use, nitrogen, phosphorus, potassium, trace elements, secondary elements.
Upland rice production in Uganda has increased substantially due to high price offered but production equals about 75% of consumption (Government of the Republic of Uganda, 2009). The increased production has been achieved more through increased production area when compared with increased yields (WARDA, 2007). Average grain yield in Uganda is estimated to be 1.5 t ha-1 (FAOSTAT, 2011). Inadequate control of numerous constraints including biotic and abiotic, low use of inputs, and low inherent soil N and P contribute to the low yield (Mghase et al., 2010). Little, if any, fertilizer or manure is used for upland rice production as also for other crops in Uganda, as well as in other sub-Saharan African countries, due to high costs of fertilizer use relative to the price of rice (Gitau et al., 2011) plus other socioeconomic constraints. Unfortunately, soil nutrient mining is high and a major cause of land degradation in Uganda. The estimated mean depletion rates for nitrogen, phosphorus and potassium are -21, -8 and -43 kg ha-1 year-1, respectively, in Uganda (Wortmann and Kaizzi, 1998). Research findings indicate that upland rice respond to fertilizers with grain yield increase of more than 100% with application of N and P, to Azolla spp. and to a preceding Mucuna pruriens L. green manure crop (Kaizzi et al., 2007). Yield increases in the range of 2.1 to 5.2 t ha-1 in response to application of 80 to 120 kg N ha-1 were reported in Uganda (Onaga et al., 2012).
Paddy yield could be increased by 46 kg ha-1 per 1 kg ha-1 of applied N (Miyamoto et al., 2012). In the Ivory Coast, maximum yield was obtained with 50 kg ha-1 of NPK fertilizer 12:24:18 or with 12 kg ha-1 of urea-N applied. The low response was due to soil water deficit stress during grain fill (Galabi et al., 2011). Upland rice yields were increased from 1.7 to 2.3 t ha-1 with a Bray-1 soil test P of 4 mg kg-1, and with appropriate P application (Oikeh et al., 2010); and from 0.98 to 1.27 t ha-1 with Bray-1 of 2 to 3 mg kg-1 (Sahrawat, 2000) with 45 kg ha-1 P applied. The optimum N and P application rates for upland rice production by smallholders in Nigerian forest agro-ecosystems are 60 and 26 kg ha-1 of N and P, respectively (Oikeh et al., 2008). The objectives of this research were to quantify the yield response of upland rice to N, NPK, a combination of NPK, secondary and trace elements; to determine economically optimal nutrient rates for N, and for a combination of N together with 10 kg P ha-1 and 20 kg K ha-1 at different cost of nutrient (C) to farm-gate price of produce (P) [CP] ratio.
Site characteristics and experimental design
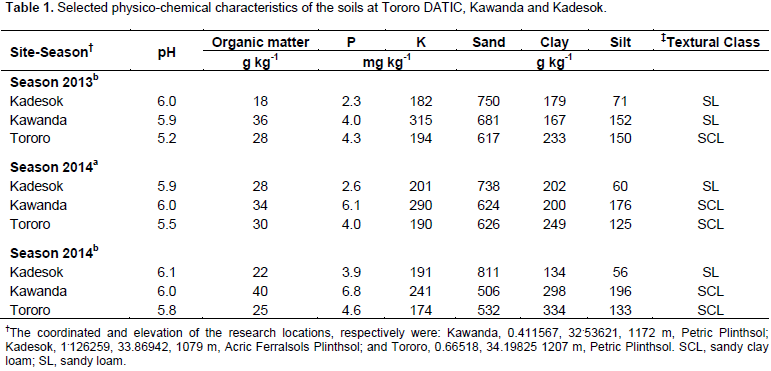
Response trials were conducted at three sites namely: Tororo DATIC, National Agricultural Research Laboratories (NARL) – Kawanda and at Kadesok, Pallissa District located in Lake Victoria Crescent and Southern Lake Kyoga Basin Agroecological Zones, respectively (Wortmann and Eledu, 1999). The rooting depth of the soils was over 1.0 m. Composite soil samples from 10 cores were collected from 0- to 20-cm depth, before planting and fertilizer application. They were use in determining selected physico-chemical properties. Particle size distribution was determined according to Bouyoucos (1936), soil organic matter by Walkley and Black (1934), and available P by Mehlich 3 (Mehlich, 1984). Soil properties varied across the research sites (Table 1). The soils at Kawanda were relatively more fertile than those of Tororo and Kadesok using soil fertility criteria established by Foster (1981). The soil organic matter levels on average ranged between 23 and 37 g kg-1 at Kadesok and Kawanda, respectively. The Mehlich-3 P at all sites was very low and exchangeable K was adequate. The soils are mainly Acric Ferralsol and Petric Plinthsol, with N and P availability closely related to soil organic matter content and presence or absence of fallow periods (Foster, 1981; Jones, 1972).
Experimental design
The trial design was a randomized complete block design with treatments replicated three times. The N rates evaluated were 0, 30, 60, 90, 120; the P–K rates evaluated were: 10–20; and N-P-K rates were 30–10–20, 60–10–20, 90–10–20, 120-10-20 60–20–20, 60–30–20, 60–10–40 and 60–10–60 kg ha–1. The N-P-K-S-Zn-Mg-B applications for diagnostic treatment were 60-10-20-33-2.5-10-0.5. The number of treatments were limited by the incomplete factorial arrangement in consideration of Liebig’s law of the minimum, proposed by J. von Liebig in 1840, expecting N to be the most limiting, followed by P, and K the least limiting major nutrient deficiencies. The N0 treatment was used as a control. However, the P and K effects were tested only with N applied. There was confounding of P and K treatments. The size of the plots was 4.2 m by 6 m.
Urea, triple super phosphate and potassium chloride were the N, P and K sources, respectively. The S, Zn, Mg and B sources were MgSO4, ZnSO4 and granular boron. Phosphorus fertilizer P was applied pre-plant, N and K fertilizers were applied in three splits with 25% pre-plant, 25% at tiller formation, and 50% at panicle initiation. At planting, the fertilizers were surface broadcast and incorporated. The side dress application of N and K was band-applied to the side of the row and covered immediately with soil.
Crop management and data collection
The fields were prepared using disk plow at 15 to 20 cm depth followed by secondary disk tillage at 10 cm depth. Seeds were planted at a spacing of 20 cm by 20 cm to give a final plant population of 50 plants m–2. Weeds were controlled by weeding with hand hoes twice or thrice depending on weed intensity. Chloropyrifos 5% (DursbanTM) was applied for control of the stem borer complex and the African rice gall midge. At harvest, plants from the inner rows in a 1.5 x 2.0 m area were cut at ground-level and air dried for at least 3 days. The panicles were threshed and the remnants were added to the straw and weighed together to determine the straw yield. The harvested grain was weighed, and grain yield calculated. Paddy yield was adjusted to 140 g kg-1 water content.
Data analysis
Data satisfied the assumptions of ANOVA. The data analyses were done by site-season using Statistix 10 (Analytical Software, Tallahassee, FL) with replications as random variables and varieties and nutrient application rates as fixed variables. When significant nutrient rate effects occurred, an asymptotic yield function was determined: Yield (t ha-1) = a – bcN, where a is maximum yield, b is maximum gain yield due to application of the nutrient, and cN determined the shape of the curvilinear response, where c is a curvature coefficient and N the nutrient rate. Upland rice response to applied N was determined with and without 10 and 20 kg ha-1 P and K, respectively, applied. The nutrient application rates (EOR) that gave the greatest net return ha-1 to fertilizer application, were calculated for a range of cost of nutrient (C) to farm-gate price (P) of produce ratio, that is, CP ratio. The CP ratios used were in the range 2 to 12. A paddy price of US$ 0.53 kg–1 (exchange rate of Uganda Sh. 3400 per US$) was used for the economic analysis. Equations were developed using cost of nutrient to farm-gate price of produce ratio of 2:12, non-linear regression analysis was used to relate EOR to CP ratio. Differences and relationships were considered significant at P ≤ 0.05.
Site characteristics
Rainfall distribution
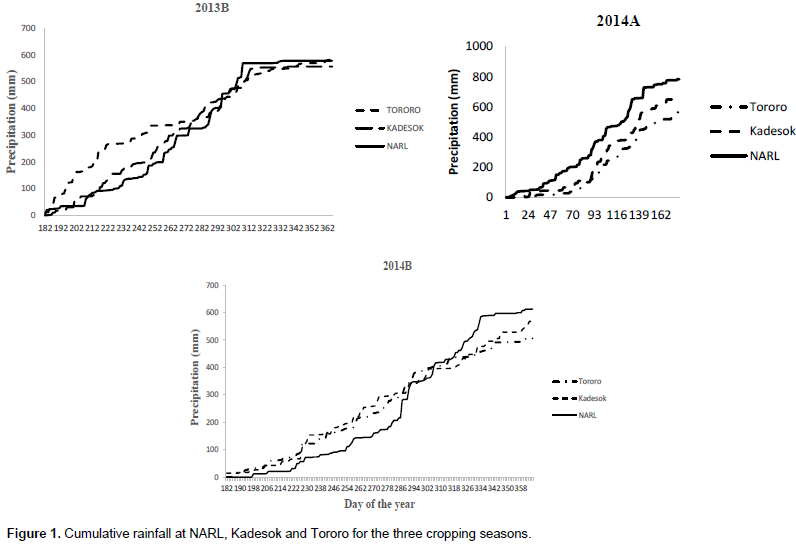
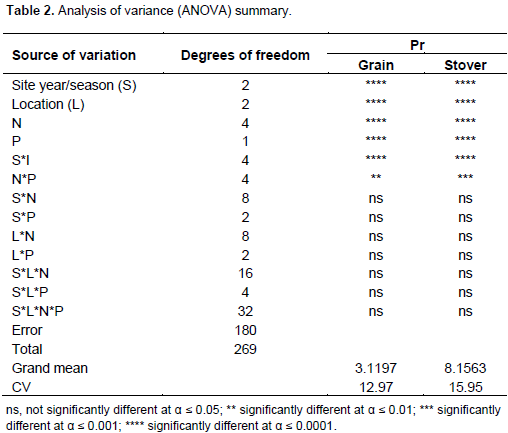
The cumulative rainfall during the three site years is presented in Figure 1. The Analysis of variance (ANOVA) summary is presented in Table 2.
Paddy yield response to nitrogen, phosphorus and potassium
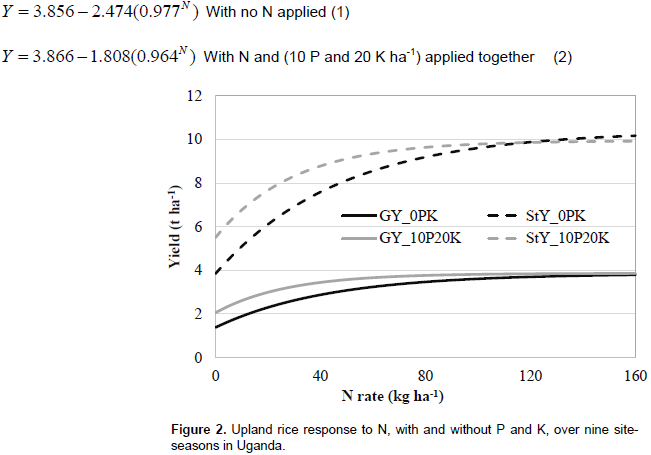
The observed response of paddy yield to N application was consistent with results from earlier research (Kaizzi et al., 2007; Onaga et al., 2012). The mean maximum paddy yield of 3.8 t ha–1 was obtained with application of 120 kg ha–1 N as compared to 1.4 t ha–1 with no N (N = 0 kg ha-1) applied (Figure 2). Results presented in Figure 2 indicate that paddy and straw yield were affected by N rate and N x PK interaction but not by 2- or 3-way interactions of N with location or year. The N x PK interaction was due to a greater response to N with 0PK when compared with 10P20K, but with each N practice reaching a plateau at similar yields. The yield response of paddy to applied N is:

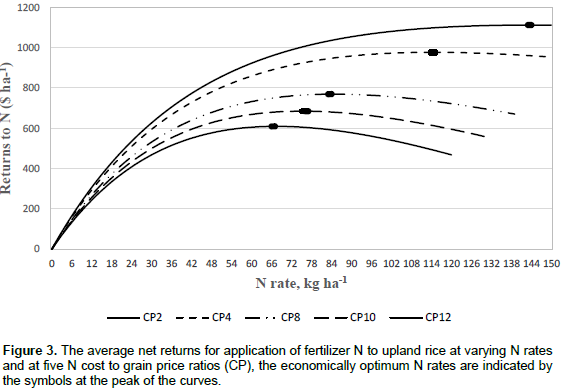
Application of nitrogen to rice was profitable for all CPs (from 2 to 12), with Economically Optimum Nitrogen Rates ranging from 60 to 149 kg ha–1, and the average for the three season ranged from 67 to 144 kg ha-1 depending on the CP (Figure 3). The high farm gate price of rice when compared with maize and sorghum results in relatively lower CPs and higher EONRs for rice. The significantly higher paddy yield with NPK, as compared to corresponding N treatment, confirmed that P and K limit rice production too. Though, phosphorus and potassium were applied together, the response is most likely due to phosphorus, because it is one of the most limiting nutrients in Uganda. According to Liebeg’s law of the minimum, the plant will first meet its N requirement, then P and thereafter K. The significant increase in paddy yield in response to P applied together with N is consistent with results reported by Oikeh et al. (2008) and Sahrawat (2000).
The mean EONR was reduced to the range of 47 to 97 kg ha-1 with application of a combination of 10 kg P and 20 kg K ha-1 and N depending on the CP ratio which were in the range of 2 to 12. The CP of fertilizer use must include fertilizer procurement and application costs, the interest rate or opportunity cost of the money used for fertilizer purchase, and the nutrient price. These added costs are very high in Uganda and other sub-Saharan African nations (SSA) because fertilizer is not easily available (Sanchez, 2002). Yet according to CIMMYT (1988), the opportunity cost for resource-poor farmers who have little access to money or credit is often 100% of the actual value due to other high priority needs for the available funds plus other investment opportunities. A BC ≥1 is therefore required for such an investment to be attractive to the finance-constrained farmers (Wortmann and Ssali, 2001). The value of grain or paddy used in determining CP, whether used for consumption by the producers or marketed, must consider the added costs of harvesting, processing, storage and marketing the increased production.
Smallholder farmers in Uganda like other SSA countries do not have enough money to purchase fertilizers for application at EOR; therefore, they maximize net returns ha-1. The only option farmers have is to apply fertilizers at less than EOR over large land which gives high total production and higher net returns when compared with application at EOR to less acreage. To maximize net returns on their constrained investment, smallholder farmers have to optimize their choice of crop-nutrient-rate combinations, while considering the CPs. The results of this study confirm that applying N to upland rice increases farm productivity with high profitability. Improved input supply and marketing efficiency, fertilizer subsidies, and improved access to credit could greatly reduce the cost of fertilizers or nutrient, hence the CP and therefore the BC of fertilizer use for upland rice production.
Net return on investment of fertilizers
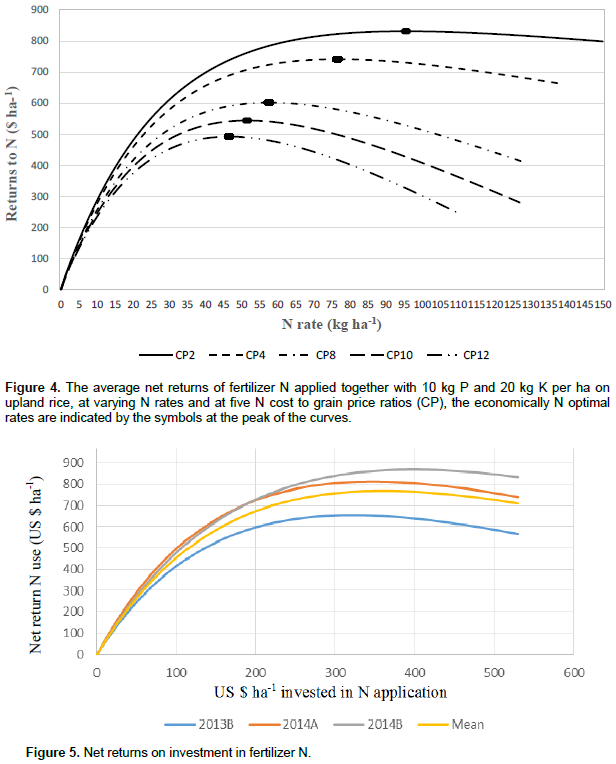
The amount of money invested on nitrogen applied alone, and in combination with 10 kg P and 20 kg K ha-1, are presented on the x-axis and the net returns to investment are presented on the y-axis of Figure 4. The curves show the profit potential of a nutrient applied to a crop in a given season and also the average of three seasons. The steepness of the curve indicates the level of net returns to investment, with high returns if the curve is steep. The slope decreases with increased rates of application; however, profit increases if the curve continues upward and vice versa. The peak of the curve is the point of maximum profit per unit area, referred to as the EOR. There is seasonal variation in the profitability of fertilizer use as observed in Figure 5. This is due to fluctuations in weather and variable costs including the price of fertilizers and produce.
It is important that farmers get adequate information and on a timely basis so that they can adjust based on EONR. Vlek (1990) reported that the profitability of fertilizer use in SSA is highly variable and depend on agro-climatic and economic conditions at local and regional levels. Applying fertilizers to replenish nutrients removed from the soil, to supply amendment nutrients, and also to reverse soil degradation caused by nutrient mining through soil erosion and limited/and or non-use of external inputs, require policy interventions. These interventions should include targeted fertilizer subsidies, improved market and storage facilities for produce, input supply efficiency, and/or increased access to information and credit to reduce the cost of fertilizers, hence, the cost of nutrient: farm-gate price of produce ratio (CP). The most important thing is to reduce fertilizer cost so that smallholder farmers with little money can apply fertilizers over larger acreage of their land and on several crops. Seasonal variation in the profitability of fertilizer use requires that farmers should have access to more accurate and reliable weather forecasts and stable grain prices to estimate better EONR for the season.
Seasonal and site effect on response of rice nitrogen, phosphorus and potassium
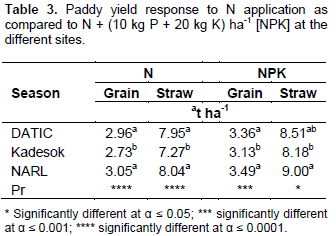
There was significant mean paddy rice yield response between sites (Table 3). This is attributed to differences in selected physico-chemical characteristics of the soil presented in Table 1.

Effect of Zn, S, Mg, B and NPK as compared to NPK
Application of secondary and trace elements significantly increased paddy and straw yield by 0.71 and 2.2 t ha-1, respectively over NPK only. The nutrients in the diagnostic package were a combination of N, P, K, Mg, S, Zn and B. This implies that either Mg, S, Zn and B or their combination also limit rice production in Uganda. However, trace elements were applied as a mixture, this will require conducting nutrient omission trials to establish which element limits rice production. There is need for data on crop response to secondary and trace elements, to guide in the formulations of fertilizer blends in SSA. A number of fertilizer blending fertilities have been established across the region but with limited data. Another critical issue to be addressed is the economics of fertilizer blends, because the profitability of fertilizer use decreases with application of more nutrients.
Application of 50 to 120 kg N ha-1 increased paddy rice yield by 91 to 173% and further 10 to 46% increase with application of 10 kg P ha-1 and 20 kg K ha-1 together with N, confirming that N, P and K limit rice production in Uganda. Therefore, application of N, P and K fertilizers is effective in increasing rice yield in Uganda. This has beneficial effects on food security, a primary goal of both the smallholder farmers and Government of Uganda. It increases farmer’s income through sales of surplus products, thus improving farm profitability. Fertilizer use on rice is profitable as observed from economic analysis. Nitrogen application was profitable for all CPs, with three-season mean EONR ranging from 67 to 144 kg ha-1 with CP ratios varying from 2 to 12. The EONR were reduced to the range 47 to 97 kg ha-1 depending on the CP ratio when N was applied together with 10 kg P and 20 kg K ha-1; this is due to the increased cost of fertilizers. The profitability of fertilizer use varies per season due to changes in variable costs and the price of produce. Therefore, farmers should adjust EONR based on current information on variable costs and anticipated produce price at the end of the season. The EOR for rice are relatively high as compared to maize and sorghum, due to the fairly high price of rice. The EOR are sufficient to reduce soil nutrient depletion but inorganic fertilizers should be used together with organic materials to derive the synergism between the two.
Application of Zn, S, B and Mg together with NPK resulted in an increase of 19% in grain yield above the NPK yield (3.67 t ha-1), indicating that either Mg, S, Zn and B or their combination are limiting yield in Uganda. Since trace elements were applied as a mixture, there is a need to conduct nutrient omission trials to establish which element limits rice production. The information is required by the fertilizer blending facilities established in the country to produce the right formulation; but in the region that is in SSA due to the mushrooming blending facilities, this will prevent exploitation of the smallholder farmers by the manufacturers. The economics of fertilizer blends should be determined, since the profitability of fertilizer use decreases with application of more nutrients. To reverse soil degradation due to nutrient mining, there is need for interventions at some policy level to reduce the CP ratios. These include but not limited to targeted fertilizer subsidies, improved markets for produce and input supply efficiency, collective marketing, better and timely access to information by farmers and affordable credit. The most important issue is to reduce fertilizer cost to enable poor farmers apply fertilizer to larger acreage and on different crops.
The authors have not declared any conflict of interests.
The authors are grateful to Alliance for a Green Revolution in Africa (AGRA) and Government of Uganda for funding the study through Optimizing Fertilizer Recommendation in Africa (OFRA) and East Africa Agricultural Productivity Enhancement Project (EAAPP).
REFERENCES
|
Bouyoucos GJ (1936). Directions for making mechanical analysis of soils by the hydrometer method. Soil Sci. 42:225-230.
Crossref
|
|
|
|
CIMMYT -International Maize and Wheat Improvement Center (1988). From agronomic data to farmer recommendations: an economics training manual. Mexico, D.F.
|
|
|
|
Food and Agriculture Organization Corporate Statistical Database (FAOSTAT) (2011). Food and Agriculture Organization, Rome.
View
|
|
|
|
Foster HL (1981). The basic factors which determine inherent soil fertility in Uganda. J. Soil Sci. 32:149-160.
Crossref
|
|
|
|
Galabi TJ, Camara M, Yao-Kouame A, Keli ZJ (2011). Profitability of mineral fertilizers in upland rice tray in Gagnoa area in central western Ivory Coast. J. Appl. Biosci. 46:3153-3162.
|
|
|
|
Gitau R, Mburu S, Mathenge M, Smale M (2011). Trade and agricultural competitiveness for growth, food security and poverty reduction: A case study of wheat and rice production in Kenya. WPS 45/2011. Tegemeo Institute of Agricultural Policy and Development. Nairobi, Kenya P 69.
|
|
|
|
Government of the Republic of Uganda (2009). Uganda national rice development strategy. Report of the Ministry of Agriculture, Animal Industry, and Fisheries. Kampala, Uganda.
|
|
|
|
Jones E (1972). Principles of using fertilizers to improve red ferrallitic soils in Uganda. Exp. Agric. 8:315-332.
Crossref
|
|
|
|
Kaizzi CK, Ssali H, Nansamba A, Vlek PLG (2007). The potential benefits of Azolla, velvet bean (Mucuna pruriens) and N fertilizers in rice production under contrasting systems of eastern Uganda. In. Bationo A, Kihara J, Kimetu J, Waswa B (eds) Advances in Integrated Soil Fertility Research in Sub-Saharan Africa: Challenges and Opportunities. Springer, The Netherlands, Pp. 423-433.
Crossref
|
|
|
|
Mehlich A (1984). Mehlich 3 soil test extractant: A modification of Mehlich 2 extractant. Commun. Soil Sci. Plant Anal. 15:1409-1416.
Crossref
|
|
|
|
Mghase JJ, Shiwachi H, Nakasone K, Takahashi H (2010). Agronomic and socio-economic constraints to high yield of upland rice in Tanzania. Afr. J. Agric. Res. 5:150-158.
|
|
|
|
Miyamoto K, Maruyama A, Haneishi Y, Matsumoto S, Tsuboi T, Asea G, Okello S, Takagaki M, Kikuchi M (2012). NERICA cultivation and its yield determinants: the case of upland rice farmers in Namulonge, Central Uganda. J. Agric. Sci. 4:120-135.
Crossref
|
|
|
|
Oikeh SO, Nwilene F, Diatta S, Osiname O, Touré A, Okeleye KA (2008). Responses of upland NERICA rice to nitrogen and phosphorus in forest agroecosystems. Agron. J. 100:735-741.
Crossref
|
|
|
|
Oikeh SO, Somado EA, Sahrawat KL, Toure A, Diatta S (2010). Integrated soil fertility management involving promiscuous dual-purpose soybean and upland NERICA enhanced rice productivity in the savannas. Nutr. Cycl. Agroecosyst. 88:29-38.
Crossref
|
|
|
|
Onaga G, Asea G, Lammo J, Kikafunda J, Bigirwa G (2012). Comparison of response to nitrogen between upland NERICAs and ITA (Oryza sativa) rice varieties. J. Agric. Sci. 4:197-205.
Crossref
|
|
|
|
Sahrawat KL (2000). Determining fertilizer phosphorous requirement for upland rice. Commun. Soil Sci. Plant Anal. 31:1195-1208.
Crossref
|
|
|
|
Sanchez PA (2002). Soil fertility and hunger in Africa. Science 295:2019-2020.
Crossref
|
|
|
|
Vlek PLG (1990). The role of fertilizers in sustaining agriculture in sub-Saharan Africa. Fertil. Res. 26:327-339.
Crossref
|
|
|
|
Walkley A, Black IA (1934). An examination of the Degtjareff method for determining soil organic matter, and a proposed modification of the chromic acid titration method. Soil Sci. 37:29-37.
Crossref
|
|
|
|
West Africa Rice Development Association (WARDA) (2007). Africa Rice Trends: Overview of Recent Developments in the Sub-Saharan Africa Rice Sector. Africa Rice Center Brief. Cotonou, Benin.
|
|
|
|
Wortmann CS, Eledu CA (1999). Uganda's agroecological zones: A guide for planners and policy makers. CIAT, Kampala, Uganda.
|
|
|
|
Wortmann CS, Kaizzi CK (1998). Nutrient balances and expected effects of alternative practices in farming systems of Uganda. In. Smaling EMA (ed) Nutrient balances as indicators of productivity and sustainability in sub-Saharan African agriculture. Agric. Ecosyst. Environ. 71:115-130.
Crossref
|
|
|
|
Wortmann CS, Ssali H (2001). Integrated nutrient management for resource-poor farming systems: A case study of adaptive research and technology dissemination in Uganda. Am. J. Altern. Agric. 16:161-167.
Crossref
|