Full Length Research Paper

ABSTRACT
Ten (10) medium staple cotton genotypes comprising of five commercial varieties and five experimental lines were evaluated for field performance, genetic and environmental variability. The trials were laid out in a randomized complete block design (RCBD) with three replications. Analysis of variance was done for total seed cotton yield, lint yield, boll weight, earliness and gin out turn (GOT %) using Genstat 14th edition while stability and adaptability analysis was done using the AMMI model and the GGE biplot software. Significant differences (P<0.05) in genotype performances were observed in all the traits except for boll weight and earliness. The environment (E) effect was significant (P<0.05) for seed cotton yield and gin out-turn percentage (GOT %). The genotype (G) effect significantly (P<0.05) accounted for differences in boll weight and earliness index. The genetic x environment (GEI) interaction was not significant across the two seasons. SZ 9314 showed wide adaptation to all environments, a well-known and recommended characteristic of the commercial variety. These results show that 644-98-11, 917-05-7 and SZ-95-7 are promising genotypes that can be registered for production in upland cotton ecologies worldwide and they can be incorporated in future cotton improvement program. It is suggested that fibre quality traits for these experimental lines should be assessed.
Key words: Stability, genetic variation, environmental variability, environment interaction (GEI), additive main effect and multiplicative interaction (AMMI), genetic by environment (GGE), gin out turn (GOT %).
INTRODUCTION
Cotton (Gossypium hirsutum L.) commonly referred to as the “king of fibres’ has global importance in the industrial production of fibre for the cloth industry, vegetable oil for human consumption and stock feed for domesticated animals (Sibanda, 2012). The crop is grown on commercial basis in both developed and developing nations by smallholder and large scale commercial farmers. Global production is on commercial basis by both smallholder and large scale commercial farmers. China, India, Brazil, United States of America and Pakistan in descending order form the top five cotton producing countries in the world (ICAC, 2013). However, Zimbabwe is among the top ten cotton producing countries in sub Saharan Africa and was, until recently, the regional standard bearer for quality (Gono, 2012).
The production of cotton in Zimbabwe is mainly clustered into two mega environments on the basis of altitude, levels of production and on the nature/types of varieties grown however, new areas in natural regions one and two of the country have also witnessed an upsurge in cotton growers; a feat that can be attributed to the effects of climate change. Expansion in new areas of production coupled with climatic pattern changes calls for the revision and redefinition of the breeding objectives as well as taking stock of germplasm which can adapt to the challenges associated with the emerging production environments. The target populations of environments (TPE) for cotton production have expanded prompting the need to increase our research sites, more rigorous variety testing schemes; minimize the effects of genetics by environment interaction (GEI) and to recommend adapted varieties for these new areas based on realistic research findings. Furthermore, the effects of climate change require a thorough and arduous variety testing scheme which ensures precise variety recommendation (Martin et al., 2013) to all cotton growing farmers. It is against this backdrop that the cotton breeding program continues to develop and evaluate a wide range of germplasm basically divided into medium staple middleveld, medium staple lowveld and the long staple cotton genotypes (Cotton Research Institute, 2012). Evaluation of varieties under different conditions representing different production environments is recommended to avoid selecting varieties which are only adaptable to a few environments. Proper GEI analysis groups with similar environments together (Ceccarelli et al., 2009) defines mega production environments as well. Classification of environments helps in culling similar testing environments which facilitate effective utilization of scare resources by testing germplasm in only different environments (Gono, 2012).
Usually, breeding programs focus on the development and selection of superior genotypes for seed cotton yield, lint yield and superior fibre quality (Feiyu and Weujun, 2013). In tandem with this focus, breeding objectives are meant to satisfy the needs of all stakeholders in the cotton value chain. The farmer is concerned with high seed cotton yield, the ginner requires high lint yield while the spinner considers fibre quality as important at their interface. Using the bulk pedigree breeding method with minor modifications, the cotton breeding programs generates new every season from the diverse gene pool available. The progeny (F1) are allowed to self in the first generation before selections are initiated in the succeeding season. Selections of the progenies continue for 2 - 3 generations and at F4 or F5 selected progenies will constitute the strains. Evaluations for either specific or broad adaptations are usually done.
Matching cotton variety selection with its production environment is often challenged by the occurrence of significant genotype x environment interaction in the variety development programmes. The objectives of this paper were to identify the most stable and adaptable cotton varieties combining the best on seed cotton yield, lint yield, ginning out turn, boll weights and earliness index. The study would also identify ideal test that are either representative of the target population of environments and also those that are discriminating in carrying out cotton research trials.
MATERIALS AND METHODS
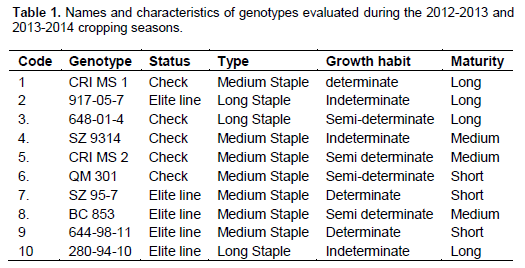
A total of 10 cotton genotypes were evaluated at eight locations which represent the major cotton growing areas in Zimbabwe. The genotypes consisted of five registered varieties which were used as checks and the other five genotypes which were elite cotton experimental lines. Genotypes used in the current project were selected based on merits (Table 1).
Testing locations and seasons
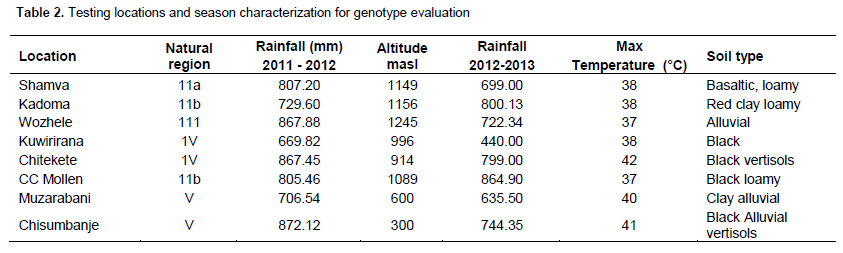
The genotypes were evaluated in eight locations which represented all major cotton growing areas of Zimbabwe. Characteristics of each location are presented in Table 2.
Trial design
The trials were laid out in a randomized complete block design (RCBD) with 3 replications at all the locations. Randomization was done at each individual site. Plot sizes measured 5 rows x 6 m x 1 m (30 m2).
Agronomic field management practices
Planting
The crop was planted on ridges after opening the planting furrows using a ridger. The seed was hand placed in the plots at a rate of 3-5 seeds per. The crop was thinned to one plant per station to achieve a desired plant population of about 33 333 plants per hectare.
Fertilizer application
Fertilizer application followed guidelines and recommendations from the cotton agronomy annual (C.T.C, 2008). A basal application of compound L (N: P: K: S = 5:18:10:8: {0.25B}) was manually banded at a rate of 250 kg per hectare to the planting furrows. Ammonium nitrate (34.5% N) was applied at a rate of 150 kg per hectare at the ninth week after crop emergence.
Pest control
A uniform cotton management regime was applied at all the trials to control all cotton pests. The general recommended cotton pest scouting and control protocol developed at Cotton Research Institute (C.R.I, 2012) was used. Pests were kept at below the economic thresholds levels following weekly scouting.
Weeding
An average of three weedings was done manually across all the test sites using hoes and ox drawn cultivators. No chemical weed control was ever applied.
Data management
Days to flowering and physiological maturity, plant height, seed cotton yield, yield components such as boll weight, boll mass and the number of bolls per plant were also recorded in the field.
Seed cotton yield
The total seed cotton yield was weighed using a digital scale after picking. The total yield is computed from the sum of weight of boll samples plus the seed cotton weights at picks 1, 2 or 3. Hence the total seed cotton yield is a collection of all the split bolls picked from each plot at each picking period.
Lint index or gin out turn ratios
Gin out turn ratios or lint ratios, refers to the amount of fibre that is produced from any given sample of seed cotton after removing the seeds. For the gin out turn percentage, 100 boll samples from each plot were weighed and ginned. The resulting lint was packed and all the seeds from the ginned 100 boll samples were weighed. The percentage of lint from each sample was then calculated using simple proportion to determine the gin out turn percentage. GOT = (total seed cotton sample – total ginned seed weights) x 100% / (total weight of ginned sample).
Data analysis
Data was analyzed using Genstat software 14th edition. Analysis of variance (ANOVA) for seed cotton yield and GOT % was done for each individual site in each season followed by a combined ANOVA across sites and across seasons in order to estimate the magnitude of the variance components on genotype performance. Significance of GEI necessitated the application of the additive main effect and multiplicative interaction (AMMI) model and the principal component analysis (PCA). Suitability and stability analysis for each variety on each production environment was estimated through the use of the genetic and genetic by environment (GGE) biplots (Gabriel, 1971).
RESULTS
The combined analysis of variance for yield, yield components and lint yield of cotton over two years indicated that there were significant differences (P<0.05) among the genotypes and genetic by environment interaction for all traits except on boll weight and earliness index. There were significant differences (P<0.05) in total seed cotton yield (TSC), lint yield and gin out turn (GOT %) among the test genotypes while traits such as boll weight (BWT), earliness and seed weight (SWT) were not significant (Table 3). Mean seed cotton yield ranged from 1171 to 1850 kg/ha with SZ 9314 as the best yielder (1850 kg/ha) and its yield was significantly different from the other genotypes.
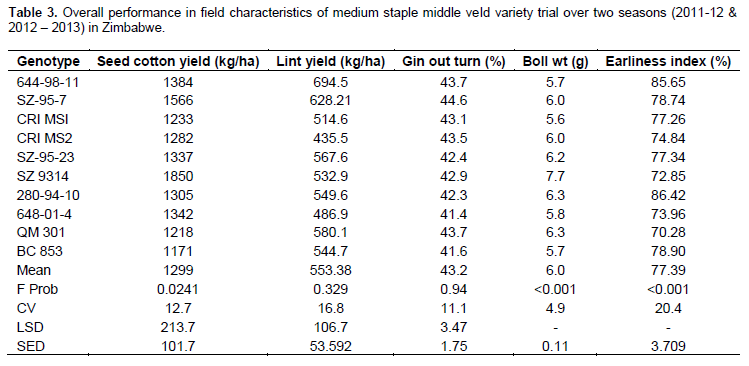
Across the two seasons, across all the testing sites SZ 9314 and 95-7 were the best performing genotypes in terms of mean seed cotton yield (1850 and 1566 kg/ha, respectively) (Table 3). GOT % values were generally high averaging at 43.2%. Genotype SZ 95-7 had the highest GOT % value of 44.6% while 648-01-4 had the least GOT % value (Table 3).
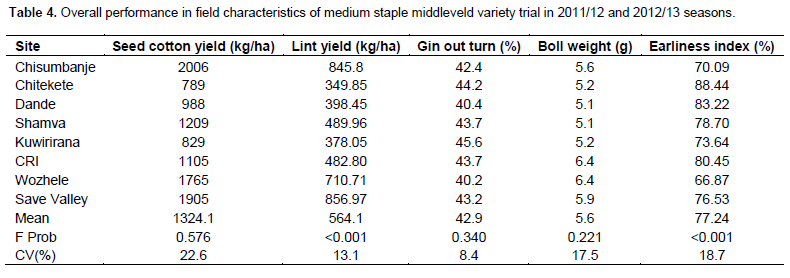
Earliness indices were high with genotypes 280-94-10 and 644-98-11 having 86.42 and 85.65%, respectively. Test site comparisons shows that Chisumbanje had the best mean seed cotton yield of 2006 kg/ha followed by Save Valley Experiment station with a seed cotton yield of 1905 kg/ha while Chitekete produced the least mean seed cotton yield of 789 kg/ha (Table 4). This can be attributed to the quality of the seasons in terms of annual rainfalls received at each site during the cropping period (Table 2).
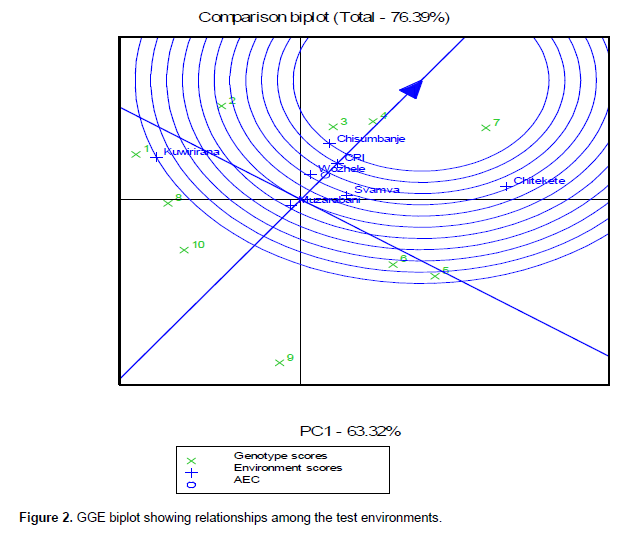
The environment (E), genotype (G) and genetic x environment interaction (GEI) effects were all statistically significant (P<0.05) for seed cotton yield, gin out-turn percentage (GOT %), boll weight (BWT), earliness index (ERL) and lint yield across the sites (Table 5).
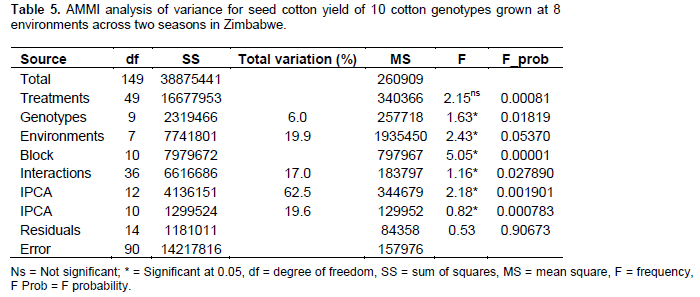
BC 853 and 917-05-7 had the least seed cotton yield but portrayed high stability for seed cotton yield. CRI MS1, CRI MS2, SZ-95-7, QM 301, 280-94-10 and 644-98-11 were good performers, giving seed cotton yields which were above the mean (Table 3). However, Figure 1 shows that CRI MS 2, BC 853 and 644-98-11 were highly unstable whilst CRI MS1, SZ-95-7, 917-05-7 and QM 301 were relatively stable (PC1 scores near 0).
Lower yielding sites included Shamva and CRI and high yielding sites were Chizvirizvi, Chitekete, Wozhele, Save and Chisumbanje. The biplot shows genotypes 280-94-10 being nearest to the average environmental coordinate (AEC) followed by 919-05-7 hence revealing minimal sensitivity to environmental and interactive forces. CRI, Chitekete, Shamva and Wozhele also showed lesser interactive forces than Save Valley Experiment station, Chisumbanje and Kuwirirana. Genotypes CRI MS1, 280-94-10, SZ 9314, and QM 301 showed large interactive effects and were adaptable at CC Moleen, CRI and Chitekete (Figure 1).
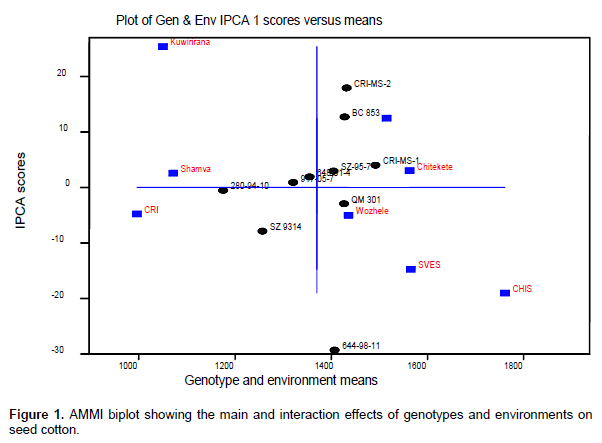
All environments that are close to the centre are ideal test environments. Chisumbanje is an ideal test environment while Wozhele and CRI are fairly good. Chitekete and Kuwirirana show that they are diverse environments because they are furthest apart. Figure 2 show that Chisumbanje, CRI, Wozhele and Chitekete are ideal test environments in discriminating and representativeness. AMMI partitioned the variance components into two principal components (PC 1 and PC 2). The two principle components explained 76.39% of the total variation (Figure 2) and they were both significant (Table 5).
DISCUSSION
Analysis of variance using the AMMI model was done to indicate the relative magnitude of genetic (G), environment (E) and genetic by environment (GE) interaction for seed cotton yield. The results show that the source of variation due to genotype (G), environment (E) and genotype x environment interaction (GEI) were significant at P<0.05. Genotype accounted for 4%, (E) for 35.8% and GEI for 23.8% of the total sum of squares (SS) respectively. The environment effect was responsible for the bigger part of the variation followed by GEI and lastly G. This large yield variation explained by environments indicated that the environments were highly discriminating and very diverse (Gabriel, 1971) and this is shown by the differences among the environmental means.
CRI MS2, 648-01-4 and 280-94-10 were closely associated and hence more adaptable at Wozhele whilst SZ-95-7, 644-98-11 and SZ-95-23 were adapted to Chisumbanje. Therefore, CC Moleen, CRI and Chitekete constitute a mega environment for the cultivation of CR1 MS 1, 280-94-10, SZ 9314, and QM 301.
These results indicate that traits with low heritability (seed cotton yield, lint yield, boll sizes) can be affected by environmental conditions more than traits with high heritability values.
The results further confirm that improvement of the characteristics having low heritability can be done through pedigree selection and or through progeny testing (DeLacy et al., 2001). The results agree with work done by Shankar and Dhayal (2013) where it was noted that the pedigree selection method can be used to improve traits with low heritabilities.
Chenu et al. (2011) used this phenomenon creatively in their study of cotton test locations and they managed to identify a minimum set of test locations for cotton research in India. An ideal test environment is one which should be both discriminating of the genotypes and representative of the mega environment (Chisumbanje, CRI and Wozhele are ideal test sites because of their near proximity to the inner concentric circle) (Campbell and Jones, 2005). Such sites can be used for early generation screening of experimental lines while discriminating sites can be used for selecting specifically adapted varieties in this mega environment. Kuwirirana on the other hand is highly discriminating and it can be used for culling of genotypes.
CONCLUSION
The study indicated that both genotypes and GE interaction were significant for both seed cotton yield and GOT%. This allowed easier selection of genotypes for these traits. CRI MS1, 644-98-11, SZ-95-7, QM 301 and SZ 9314 had seed cotton yields above the grand mean. SZ-95-7 (1466 kg/ha) and 644-98-11(1384 kg/ha) gave highest yields and had good GOT % as well. 644-98-11 had a high earliness index indicating early maturity. 644-98-11 and SZ-95-7 have since been tested for distinctiveness, uniformity and stability (DUS) by the seed certifying authority in Zimbabwe before release of proposal considerations.
Ideal test sites observed are Chisumbanje, CRI and Wozhele while discriminating and environments observed are Chitekete, Kuwirirana and Muzarabani. Kuwirirana is highly discriminating but not representative.
RECOMMENDATIONS
1. The study shows outstanding genotypes that can be registered for upland cotton cultivation although future work can focus on testing their performances across a wider region.
2. There is significant G x E interaction in cotton yield trials and hence this should be exploited by ensuring that more METs trials are conducted to see the effect of the different seasons and locations.
3. High yielding and stable genotypes identified are 644-98-11and SZ 95-7 and these should be used to improve seed cotton yield in other cultivars through incorporating them in hybridization and or backcross programs. The genotypes can also be used in cotton improvement programs in future as well.
4. Fibre testing should be conducted so as to assess their fibre quality parameters.
CONFLICT OF INTERESTS
The authors have declared that there is no conflict of interests.
REFERENCES
|
Campbell B, Jones MA (2005). Assessment of genotype x environment interactions for yield and fiber quality in cotton performance trials. Euphytica 144:69-78. Crossref |
||||
| Ceccarelli S, Guimaraes EP, Wetzien E (2009). Plant Breeding and Farmer Participation, FAO, Rome. | ||||
| Cotton Research Institute (2012). Annual report. Government printers, Harare, Zimbabwe. | ||||
| Cotton Training Centre (2008). The Cotton Production Handbook. Government Publishers, Harare, Zimbabwe, Cotton Training Centre, Kadoma. | ||||
| DeLacy IH, Cooper M, Lawrence P (2001). Genotype-by-Environment Interaction and Plant Breeding in Pattern Analysis over Years of Regional Variety Trials Relationship Among Sites. Louisiana. pp. 189-213. | ||||
|
Feiyu T, Weujun X (2013). Genetic effects and heterosis of within boll yield components in upland cottons. Euphytica 194(1):41-51. Crossref |
||||
|
Gabriel KR (1971). The biplot graphic display of matrices with application to principal component analysis. Biometrika 58:453-467. Crossref |
||||
| Gono LT (2012). Cotton Research Institute: An overview of the Research Highlights; current status and future strategies, P. Bag 765, Kadoma, Zimbabwe. | ||||
| International Cotton Advisory Committee (2013). Press release and annual cotton production highlights. Washington DC, USA. | ||||
| Martin KV, Kenneth GC, Joost W, Hochman Z (2013). Yield gap analysis with local to global relevance – A review. Field Crop 143(9): 4-17. | ||||
| Shankar LA, Dhayal RP (2013). Comparative yield component analysis in G. Hirsutum parents using fibre quality grouping, Euphytica 161(3):391-399. | ||||
| Sibanda S (2012). IR.uz.ac.zw/jspui/b.tsream/10646/882/5/02. PHd Thesis submitted to the University of Zimbabwe. Thesis_body.phd. pdf.tx. | ||||
Copyright © 2024 Author(s) retain the copyright of this article.
This article is published under the terms of the Creative Commons Attribution License 4.0


