ABSTRACT
Barley is a major cereal grown widely and used in several food products, beverage production and animal feed. Being the fourth most important cereal crop in the world and the fifth rank in Ethiopia, it is a cash crop and used as a source of malt by the brewery industries, as food for human and feed for animals. Genetic diversity assessment is a key component in breeding programs. High level of polymorphism, codominant and multi allelic nature of simple sequence repeats (SSRs) markers make them preferable for diversity analysis in plant species. In this study, 22 SSRs markers were used to characterize the genetic diversity of 39 released and elite barley varieties collected from barley breeding program in Ethiopia. The amplification of SSRs loci were obtained for 35 primer pairs and only 22 of them showed clear polymorphic patterns which produced a total of 73 alleles with an average of 5 alleles per locus. The data generated by these informative primers were sufficient to discriminate the analysed barley genotypes. Based on the dissimilarity matrices ranging from 0.11 to 0.58, the genotypes were grouped into three major groups. The calculated polymorphism information content (PIC) values ranges from 0.17 to 0.60 with an average of 0.47 which shows the importance of the markers for future diversity analysis of barley. Locus HVACL1 and HVM36 shows higher PIC and locus HVBDHN7 shows lower PIC in this characterized barley genotype. This result will be useful for barley germplasm management and improvement in terms of biodiversity protection and design of new crosses for future breeding purpose.
Key words: Barley, elite, polymorphism information content (PIC), released, similarity, simple sequence repeats (SSRs), varieties.
Barley (Hordeum vulgare L.), being the fourth most important cereal crop in the world, and ranks fifth in Ethiopia (CSA, 2012), is a cash crop and used for brewing malts, animal feed and human consumption (Hayes et al., 2002). The Ethiopian landrace barleys have been known to the botanical communities, notably from Vavilov's extensive collections and study. As cited by Abebe and Bjornstad (1997) Scheiemann stated that Ethiopia is considered as secondary center of diversity or center of origin for barley, which belongs to Poaceae. The diversity of barley in Ethiopia is quite high for an extended history of cultivation and variant agro-ecosystems (Eticha et al., 2010). Environmental factors such as varied soil types, altitudinal variation and climatic factors contribute to the diversity of barley manifested in Ethiopia. The entire cultivated barley of Ethiopia is a farmer variety or landrace (Hadado et al., 2010). The morphological characterizations of landraces of barley were studied (Eticha et al., 2010). The development of molecular markers makes it easy to assess genetic diversity in crops at DNA level (Reif et al., 2003). Molecular markers such as RAPD (Fernández et al., 2002; Meszaros et al., 2007), AFLP (Zhang and Ding, 2007a), ISSR (Fernández et al., 2002), STS (Meszaros et al., 2007) and SSR (Turuspekov et al., 2001; Matus and Hayes, 2002; Feng et al., 2006; Meszaros et al., 2007; Zhang et al., 2007b) can be used to estimate genetic diversity. Ramsay et al. (2000) developed SSR markers for molecular characterization and linkage mapping of barley. Molecular diversity of H. vulgare L. was studied using SSR markers (Wang et al., 2010; Hadado et al., 2010) and the primers were designed by Ramsay et al. (2000). Chaabane et al. (2009) also characterized barley collections of Tunisia, Syria and Denmark by SSR markers. But, the barley collections were not from Ethiopia.
SSRs are codominant, abundant, informative and their detection is very simple (Matus and Hayes, 2002). This makes them an excellent molecular marker system for analysis of genetic diversity. In this study, the authors used a set of 35 SSRs from seven linkage groups (five per each) of barley genome of which 22 were polymorphic to characterize 39 released and elite verities of barley obtained from barley breeding program of Holeta Agricultural Research Center. The objectives of this study were to assess genetic diversity and relationship of released and elite barley varieties for use in improvement and germplasm management.
Plant materials
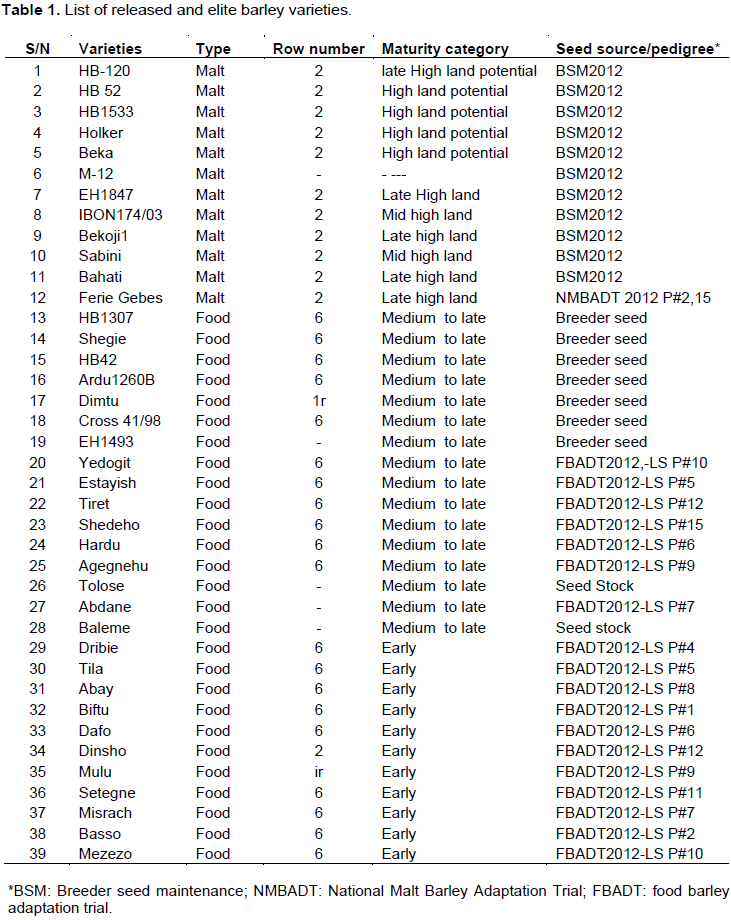
A total of 39 released and elite barley varieties were used in this study (Table 1). These barley varieties were provided by barley breeding program units of Holeta Agricultural Research Center.
Genomic DNA extraction
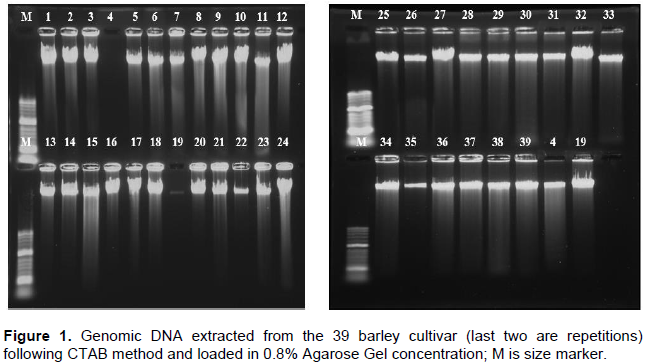
Five seeds of each genotype were sown in plastic pot of dimension (6.8 x 6.8 x 7.8 cm) and allowed to grow in greenhouse compartment in 2016, at National Agricultural Biotechnology Research Center. The soil mixture was red ash, frost soil and animal dung in the ratio of 1:1:1 and sterilized at a temperature of 150°C for 3 h. Two weeks later, the seedlings ranging from five to seven leaves were targeted and approximately, 100 mg young leaves tissues of each genotype were used for DNA extraction. DNA was extracted from each fresh and dried leaf following modified CTAB method (Doyle and Doyle, 1990).
The presence and absence of gDNA was checked in agarose gel electrophoresis (0.8% Agarose in 100 ml of 1XTAE, 5 μL of gDNA+1.5 μL of 1X Loading dye) run for 30 min at 100 V (Figure 1). DNA quality and concentration was estimated using Nano Drop Spectrophotometer (ND-8000, Thermoscitnific). DNA samples were then diluted to a concentration of 20 ng/μL using ddH2O and stored at -20, -80 and -196°C (Yuanzheng and Angell, 2005).
Acquisitions of SSR markers and PCR amplification
SSR markers acquisition
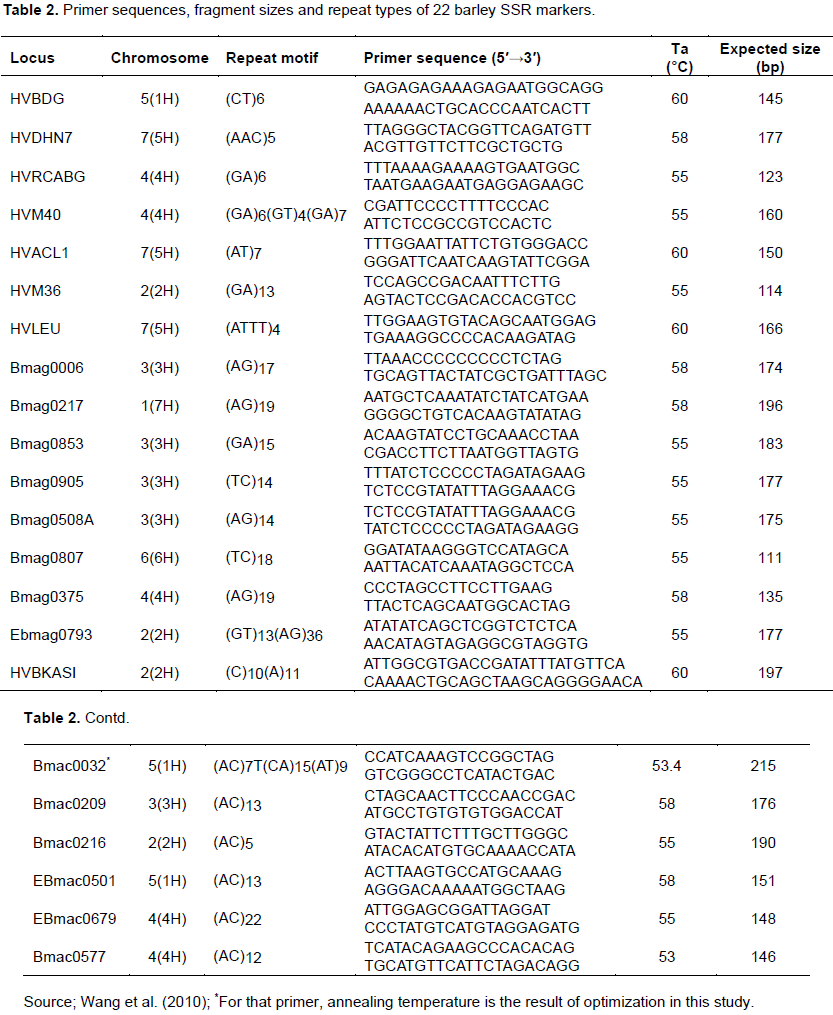
Literature based search was done to find appropriate SSR markers for barley. Accordingly, thirty five SSR markers were found from Wang et al. (2010). All of them were screened for amplification and usefulness and 22 of them were found to be polymorphic (Table 2). The consistency of the band profiles SSR markers was assessed across the DNA samples by repeating amplifications and only the repetitive PCR products were scored.
PCR optimization, primer screening and PAGE
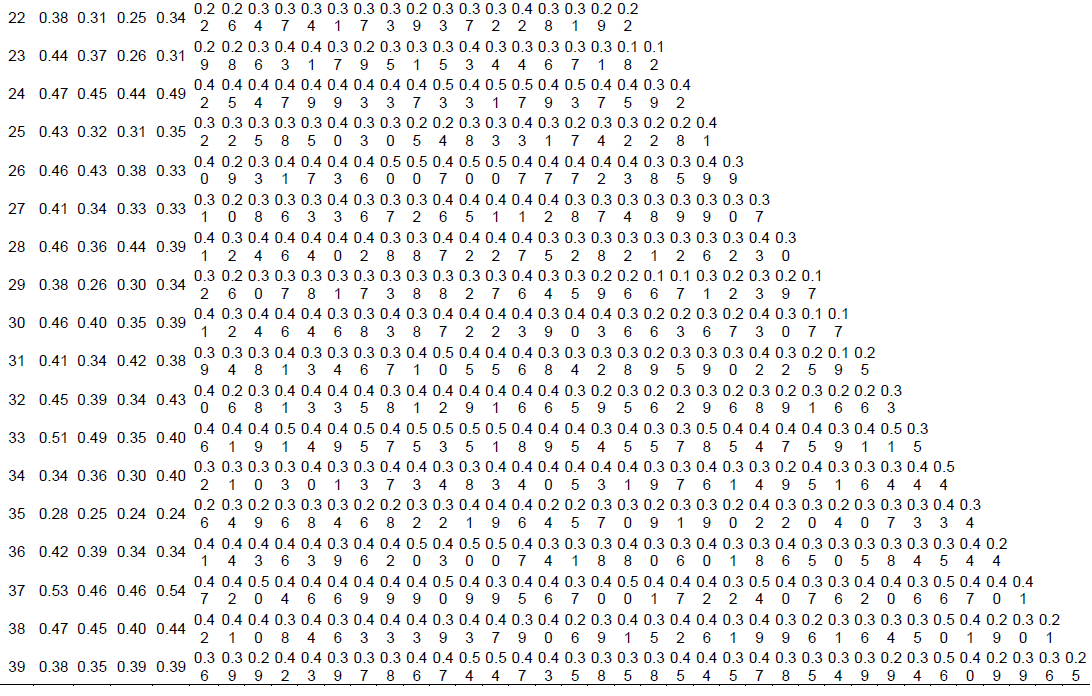
Polymerase chain reaction was optimized starting from the reaction set up described in Wang et al. (2010). Accordingly, PCR was carried out in a 25-μL final volume containing 2 μL of 20 ng/μL genomic DNA templates, 2.5 μL of 1X PCR buffer containing 15 mM Mg2+, 0.5 μL of 15 mM dNTP mixture (2.5 mM of each), 1.25 μL of 5 u/μL of Taq DNA polymerase, and 0.25 μL of 10 μM forward and reverse primers and 1.6 ng/μL of gDNA (20 ng/μL of stock) for amplification. Depending on the primer pair used, DNA amplification was performed using master cycler (Pros, eppendorf), with a thermo cycler program of 1 cycle 4 min at 94°C of initial denaturation, followed by 35 cycles 30 s denaturation at 94°C, 30 s annealing (specific for each primer) (Table 2 ) and 30 s of extension at 72°C. The final extension was for 10 min at 72°C with final holding at 4°C. For primer Bmac0032, gradient PCR between 45-65°C was applied to get an optimum annealing temperature (Table 2). The success of the PCR and the associated yield was assessed in 2% agarose gel (2 g agarose in 50 ml of 1xTAE, 5 μL of gDNA+1.5 μL of 1X Loading dye with gel red (mix (1000:1)) and run for 30 min at 100 V. Once the optimization is over, the same PCR setup (as described above) was applied for amplification of SSRs with all the 22 primers across the entire barley genotypes studied. Microsatellite allele separation was carried out using polyacrylamid gel electrophoresis also called native DNA PAGE with a dual vertical electrophoresis apparatus (Cleaver, CS500 volt). The recipes used were polyacrylamide gel (5 μL of 10x TBE, 22 ml of 40% (29:1, acrylamid: bis acrylamid solution), 66 μL of TEMED, 80 μL of Nuclease free water) and 5 μL of PCR product +3μL of 1X Loading dye) run at 150 V for 1:30 h. PAGE picture (Figure 2) was captured using gel documentation system (3uv bench top, M-20 transilluminator).
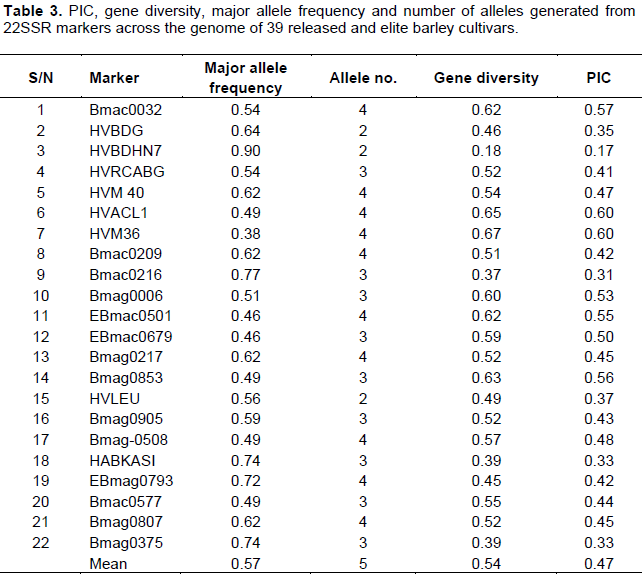
Data analysis
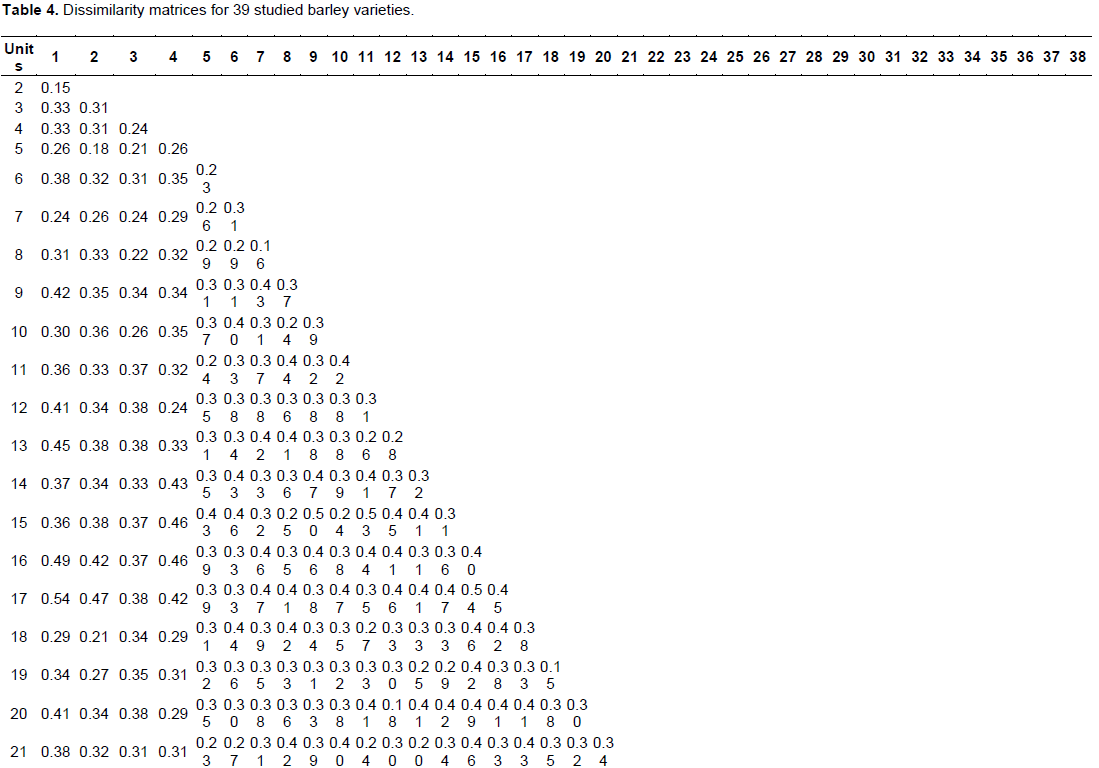
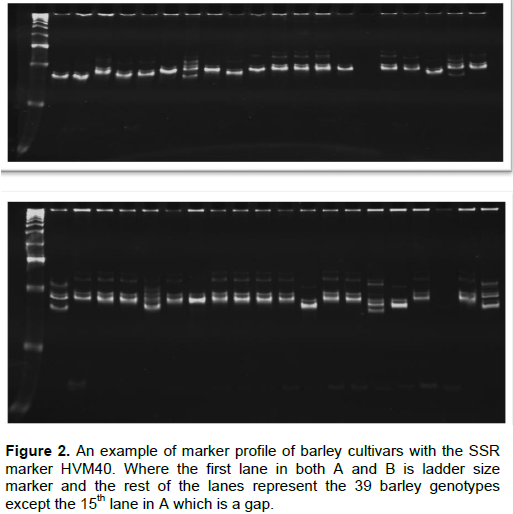
The number of alleles detected by each SSR marker was estimated for each genotype and all SSR marker loci were scored as described by Struss and Plieske (1998). Data obtained from SSR analysis were scored as presence (1) or absence (0) of fragments for each barley genotype. Polymorphism information content (PIC), number of allele, allele frequency and gene diversity were calculated using Power Marker V3.25 (Liu and Muse, 2005) (Table 3). Dendrogram was constructed using Darwin 6.0 software (Perrier et al., 2003; Perrier and Jacquemoud-Collet, 2006) based on the dissimilarity matrices and neighbour joining (NJ) clustering method.
PIC statistics and SSR analysis
The PIC values of markers can provide an estimate of discrimination power in a set of accessions by taking not only the number of alleles, but also the relative frequencies of each allele (Smith et al., 2000). Based on this, the PIC value of this study was calculated using Power marker v3.25 and found to range from 0.17 to 0.60 and provide an estimate of discrimination power in a set of released and elite barley accessions. Similarly, number of allele, allele frequency and gene diversity was calculated using power marker v3.25, and resulted in minimum and maximum values of 2, 4 for number of allele, 0.38, 0.90 for allele frequency and 0.18, 0.67 for gene diversity, respectively (Table 3).
Dendrogram obtained with SSR markers
Dendrogram obtained from application of Darwin 6.0 using the dissimilarity matrices (Table 4), grouped the genotypes into three major groups. Cultivar Misrach and Mezezo showed greater genetic distance as compared to Cultivar Dafo, and HB120 with HB52 which showed lower genetic distance (Table 4).
SSR markers in barley genetic diversity analysis
In this study, 22 SSR markers were chosen for 39 released and elite barley genetic diversity analysis and they were from Chr. 1, Chr. 2, Ch. 3, Chr. 4, Chr. 5, Chr. 6 and Ch7 (Table 2). As far as genome coverage is concerned, it may be arguable that the number of selected markers is low for barley genetic diversity study. However, we still obtained many alleles, and most of them were polymorphic. Although, some barley germplasms were not discriminated by the cluster analysis (Figure 3), the general classification was informative. It indicated that the genetic structure of barley germplasms in the study was high, which mainly attributed to difference in the genetic background of the studied barley cultivar. Therefore, it is inferred that the SSR marker used were relatively of high efficiency for barley genetic analysis and could reveal the genetic differences of barley germplasms as described in previous studies (Maroof et al., 1994; Struss and Plieske, 1998; Turuspekov et al., 2001; Matus and Hayes, 2002; Feng et al., 2006; Zhang et al., 2007b; Mikel and Kolb, 2008).
Genetic diversity for barley germplasm protection and barley breeding
With the cluster analysis, we were to identify relatively fewer number of genotype group (Figure 3) instead of total discerning of the whole genotypes in many possible groups. Two possible reasons may be attributed to the obtained result. One of the reasons could be some of the studied materials were duplications of the others or might have been developed from very closely related sister lines. In each case, the obtained result is justified. The other could be the smaller number of SSR markers used leading to smaller genome coverage which otherwise could be a good source of additional discrimination power used. In either case, we optimistically consider the SSR markers appear to provide an optimal platform to identify duplicated materials in the barley germplasm collection (Struss and Plieske, 1998), and they are helpful in managing the barley collections for subsequent barley improvement programs.
However, the result suggests that a more comprehensive result could also be obtained if more representations of germplasms and number of good genome coverage are considered future barley diversity study.
SSR markers in new variety protection
As a general knowledge and fact, molecular fingerprinting is an effective and accurate way to identify crop varieties (Nandakumar et al., 2004). In this study, it was found that the SSR marker have at least distinguished the released barley cultivars from other elite barley cultivars. This suggests that we can protect the breeder rights of the released barley cultivars by using SSR markers. Similarly, we can identify all barley landraces by SSR fingerprinting which intern allows us to find out whether there are varietal duplications or mistakes in a given germplasm collection.
In conclusion, genetic variation is a raw material for plant breeding and assessments of existing similarities or differences in any crop germplasm pool. It plays a great role in a predictable area to improve agricultural production and productivity, to solve food insecurity in developing world. This study was conducted to determine the levels of genetic variation in released and elite Ethiopian barley materials. The good information content of the markers used, estimated extent of diversity and limited clustering among the studied barley materials are basic outcomes of this study upon which a more comprehensive study can be built. Relatively speaking however, the results can still be used for the consumption of barley breeding programs where breeders should think of the distinctness of the varieties already released and their future plans to release new ones. Finally, diversity study such as this is useful for the establishment of genetic relatedness and molecular characterization of barley germplasm. This in turn benefits barley breeding programs to make choice of the genotypes to be used in crosses and will facilitate the germplasm management.
The authors have not declared any conflict of interests.
REFERENCES
|
Abebe D, Bjornstad A (1997). Geographical, altitudinal and agro-ecological differentiation of isozymes and hordein genotypes of landraces of barleys from Ethiopia: implications for germplasm conservation. Genet. Resour. Crop Evol. 44:43-55.
Crossref
|
|
|
|
Chaabane R, El Felah M, Ben Salah H, Ben Naceur M, Abdelly C, Ramla D, Nada A, Saker M (2009). Molecular Characterization of Tunisian Barley (Hordeum vulgare L.) Genotypes using Microsatellites (SSRs) Markers. Euro. J. Sci. Res. 36(1):6-15.
|
|
|
|
|
CSA-Central Statistics Agency (2012). Annual Statistics Bulletin. Addis Ababa, Ethiopia.
|
|
|
|
|
Doyle JJ, Doyle JL (1990). Isolation of plant DNA from fresh tissue. Focus 12:13-15.
|
|
|
|
|
Eticha F, Sinebo W, Grausgruber H (2010). On-farm Diversity and Characterization of Barley (Hordeum vulgare L.) Landraces in the Highlands of West Shewa, Ethiopia. Ethnobotan Res. Appl. 8:25-34.
Crossref
|
|
|
|
|
Feng ZY, Liu XJ, Zhang YZ, Ling HQ (2006). Genetic diversity analysis of Tibetan wild barley using SSR markers. Yi Chuan Xue Bao 33:917-928.
Crossref
|
|
|
|
|
Fernández M, Figueiras A, Benito C (2002). The use of ISSR and RAPD markers for detecting DNA polymorphism, genotype identification and genetic diversity among barley cultivars with known origin. Theor. Appl. Genet. 104:845-851.
Crossref
|
|
|
|
|
Hadado TT, Rau D, Bitocchi E, Papa R (2010). Adaptation and diversity along an altitudinal gradient in Ethiopian barley (Hordeum vulgare L.) landraces revealed by molecular analysis. BMC Plant Biol. 10(1):121.
Crossref
|
|
|
|
|
Hayes PM, Castro A, Marquez-Cedillo L, Corey A, Henson C, Jones BI, Kling J, Mather D, Matus I, Rossi CSato K (2002). Genetic Diversity for Quantitatively Inherited Agronomic and Malting Quality Traits. In. Diversity Barley (Von Bothmer R, Knupfeer H, van Hintum T and Sato K, eds.). USDAARS. Chapter 10. 2003. pp. 147-169.
|
|
|
|
|
Liu K, Muse SV (2005). PowerMarker: Integrated analysis environment for genetic markers data. Bioinformatics 21(9):2128-2129.
Crossref
|
|
|
|
|
Maroof MS, Biyashev RM, Yang GP, Zhang Q, Allard RW (1994). Extraordinarily polymorphic microsatellite DNA in barley: species diversity, chromosomal locations, and population dynamics. Proc. Natl. Acad. Sci. U. S. A. 91:5466-5470.
Crossref
|
|
|
|
|
Matus IA, Hayes PM (2002). Genetic diversity in three groups of barley germplasm assessed by simple sequence repeats. Genome 45:1095-1106.
Crossref
|
|
|
|
|
Meszaros K, Karsai I, Kuti C, Banyai J (2007). Efficiency of different marker systems for genotype fingerprinting and for genetic diversity studies in barley (Hordeum vulgare L.). S. Afr. J. Bot. 73(1):43-48.
Crossref
|
|
|
|
|
Mikel MA, Kolb FL (2008). Genetic diversity of contemporary North American barley. Crop Sci. 48:1399-1407.
Crossref
|
|
|
|
|
Nandakumar N, Singh AK, Sharma RK, Mohapatra T (2004). Molecular fingerprinting of hybrids and assessment of genetic purity of hybrid seeds in rice using microsatellite markers. Euphytica 136:257-264.
Crossref
|
|
|
|
|
Perrier X, Flori A, Bonnot F (2003). Methods for data analysis. In. Hamon P, Seguin M, Perrier X, Glaszmann JC (eds). Genetic diversity of cultivated tropical plants. Science Publishers, Montpellier, Inc. and CIRAD. pp. 31-63.
|
|
|
|
|
Perrier X, Jacquemoud-Collet JP (2006). DARwin software. http://darwin.cirad.fr/
|
|
|
|
|
Ramsay L, Macaulay M, Ivanissevich degli S, MacLean K, Cardle L, Fuller J, Edwards JK, Edwards, Tuvesson S, Morgante M, Massari A, Maestri E, Marmiroli N, Sjakste T, Ganal M, Powell W, Waugh R (2000). A Simple Sequence Repeat-Based Linkage Map of Barley. Genetics 156:1997-2005.
|
|
|
|
|
Reif JC, Melchinger AE, Xia XC, Warburton ML (2003). Genetic distance based on simple sequence repeats and heterosis in tropical maize populations. Crop Sci. 43:1275-1282.
Crossref
|
|
|
|
|
Smith JSC, Kresovich S, Hopkins MS, Mitchell SE, Dean RE, Woodman WL, Lee M, Porter K (2000). Genetic diversity among elite sorghum inbred lines assessed with simple sequence repeats. Aust. J. Crop Sci. 40:226-232.
Crossref
|
|
|
|
|
Struss D, Plieske J (1998). The use of microsatellite markers for detection of genetic diversity in barley populations. Theor. Appl. Genet. 97:308-315.
Crossref
|
|
|
|
|
Turuspekov Y, Nakamura K, Yoshikawa R, Tuberosa R (2001). Genetic diversity of Japanese barley cultivars based on SSR analysis. Breed. Sci. 51:215-218.
Crossref
|
|
|
|
|
Wang JM, Yang JM, Zhu JH, Jia QJ, Tao YZ (2010). Assessment of genetic diversity by simple sequence repeats markers among forty elite varieties in the germplasm for malting barley breeding. J. Zhejiang Univ. Sci. B 11(10):792-800.
Crossref
|
|
|
|
|
Yuanzheng Y, Angell C (2005). Clarifying the glass transition behaviour of water by comparison with hyper quenched inorganic glasses. Nature 427(6976):717-720.
|
|
|
|
|
Zhang D, Ding Y (2007a). Genetic diversity of wild close relatives of barley in Tibet of China revealed by AFLP. Yi Chuan 29:725-730.
Crossref
|
|
|
|
|
Zhang DL, Gao HY, Li SP (2007b). Analysis of genetic diversity on beer barley varieties in China by SSR. Acta Agric. Boreali-Occidentalis Sin. 16:72-76.
|
|