Full Length Research Paper
ABSTRACT
Upland rice (Oryza spp.) yields are low in Uganda, partly because of little fertilizer use. Three on-station trials and two clusters of on-farm trials were conducted in Uganda at approximately 1000 m elevation to determine: yield response to N, P and K application; economically optimal nutrient rates (EOR); and N use efficiency components. Mean grain yield, with hulls, was 1.3 and 3.7 Mg ha-1 with 0 and 100 kg ha-1 N applied, respectively. Grain yield response to applied P when compared with N was less, and mean yield was not increased with K application. Depending on fertilizer cost relative to grain price (CP), mean EOR ranged from 54 to 92 kg ha-1 N and 17 to 30 kg ha-1 P. Equations were determined for yield response, estimation of EOR, and the benefit: cost ratio (BC) for fertilizer N and P use. Grain N concentration and N harvest index at EOR were 1.55 and 0.55 kg kg-1, respectively. Mean recovery efficiency, partial factor productivity and agronomic efficiency declined with increasing N rate and were 0.75, 41 and 28 kg kg-1, respectively, at the EOR. Fertilizer N and P use can be highly and moderately profitable, respectively, for upland rice production in Uganda with high N recovery and agronomic efficiency. In maximizing net return on finance-constrained investment in fertilizer use, CP and investment capacity needs to be considered.
Key words: Economic, fertilizer use, nitrogen, phosphorus, potassium, use efficiency.
INTRODUCTION
Upland rice production is less important in Uganda when compared with maize (Zea mays L.) and sorghum (Sorghum bicolor L. Moench), but rainfed rice production has doubled (FAOSTAT, 2013) during the past decade due to high market value through expansion of area sown. Smallholders are more likely to apply fertilizer to rice when compared with other cereals because of the high market value of rice. However, levels of nutrient application are low, at least partly to high costs of fertilizer use relative to the value of rice, and mean grain yield in Uganda which is estimated to be 1.5 Mg ha-1 (Otsuka and Kalirajan, 2006). Inadequate control of numerous constraints may contribute to the low yield as found in Tanzania with biotic constraints, low input use and low availability of soil N and P constraining productivity (Mghase et al., 2010).
Currently there are no fertilizer recommendations for upland rice production in Uganda. Upland rice is produced across diverse situations in Africa and research findings for nutrient application to upland rice are mostly quite recent and indicate situation specificity but also some opportunity for generalization. Research in Uganda showed that upland rice grain yield can often be increased by more than 100% with application of N and P, and the crop is responsive to Azolla spp. and to a preceding green manure crop of Mucuna pruriens L. (Kaizzi, 2002; Kaizzi et al., 2007). Yield in Uganda was increased by 2 to 3.5 Mg ha-1 in response to 120 kg N ha-1 (Onaga et al., 2012). Miyamoto et al. (2012) found that paddy yield could be increased by 46 kg kg-1 of applied N. In Benin, yields were less with no N when compared with N applied in diagnostic trials (Koné et al., 2009). In the Ivory Coast, yield was maximized with just 50 kg ha-1 of NPK blended fertilizer 12:24:18 or with 12 kg ha-1 urea-N applied with the low responsiveness attributed to soil water deficits during grain fill (Galabi et al., 2011). In Burkina Faso, Ethiopia, Ghana and Nigeria, upland rice response to applied N was generally curvilinear to plateau with, on average, about 90% of the grain yield increase with 100 kg N ha-1 occurring with the first 50 kg N ha-1 (Apaseku et al., 2013; Habtegebrial et al., 2013; Oikeh et al., 2008; Okonji et al., 2012). On the dry savannah land of northern Nigeria, however, rice grain yield increased linearly with N rates up to 90 kg N ha-1 (Kamara et al., 2010). Koné et al. (2011) attributed situations of reduced grain yield and root development with N application to mid-season soil water deficits. Oikeh et al. (2008) determined 60 kg N ha-1 to be optimal for upland rice production by smallholders in Nigerian forest agro-ecosystems.
A curvilinear to plateau response to applied P is also common with about 40 and 65% of the response to application of 40 kg P ha-1 occurring, on average, with the 10 and 20 kg P ha-1 rates (Bationo, 2008; Apaseku et al., 2013; Okonji et al., 2012). Upland rice yields were increased from 1.7 to 2.3 Mg ha-1 with a Bray-1 soil test P of 4 mg kg-1 with P application (Oikeh et al., 2010), and from 0.98 to 1.27 Mg ha-1 with Bray-1 of 2 to 3 mg kg-1 (Sahrawat, 2000) with 45 kg P ha-1. Oikeh et al. (2008) determined 26 kg P ha-1 to be optimal for upland rice production in Nigerian forest agro-ecosystems. Given the inadequate information base for maximizing profit from fertilizer use on upland rice for production in Uganda, research was conducted to: 1) quantify the yield response of upland rice to N, P, and K; 2) determine economically optimal nutrient rates for N, P and K (EONR, EOPR and EOKR) at different CP; and 3) evaluate efficiency of N use by upland rice in Uganda.
MATERIALS AND METHODS
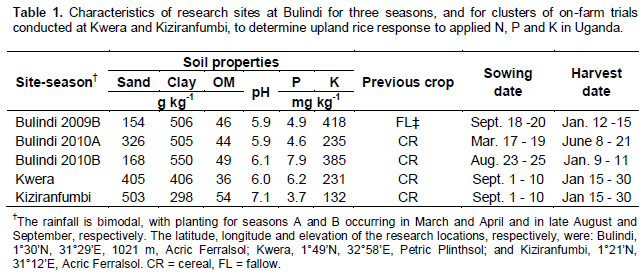
Five N, P and K response trials were conducted in western Uganda across three cropping seasons from 2009 to 2010 (Table 1). The location and season combinations are referred to as site-seasons. Three site-seasons were conducted at the Bulindi Zonal Agricultural Research and Development Institute and two site-seasons were clusters of single sets of treatments evaluated on-farm with four or five farms per cluster providing replication. Research was carried out in the Western Mid-Altitude Farmlands (Wortmann and Eledu, 1999). Bulindi trial sites received >50 mm rainfall in the two weeks before sowing and received 430 mm or more of rainfall by 100 days after sowing (Figure 1). Rainfall was less in season 2010B when compared with other seasons with only 55 mm from 23 to 55 days after sowing.
The soils were Acric Ferralsols except for pre-dominantly Petric Plinthsol at the Kwera on-farm location (Table 1). Surface soil samples for the 0- to 20-cm depth consisting of 10 cores per site-season were collected before planting and fertilizer application to determine basic soil properties. Sand, clay and soil organic matter content ranged from 154 to 503, 298 to 506 (Bouyoucos, 1936), and 36 to 54 (Walkley and Black, 1934) g kg-1 soil, respectively. Mehlich-3 P (Mehlich, 1984) ranged from 3.7 to 7.9 mg kg-1 soil. Exchangeable K was always >130 mg kg-1.
Site preparation at Bulindi included disk plowing at 15 to 20 cm depth followed by secondary disk tillage at 10 cm depth to reduce soil surface roughness. Land preparation for on-farm trials varied according to the practices of cooperating farmers but always included tillage. The previous crop and sowing dates varied (Table 1). Seeding rates were selected to achieve final plant populations of 50 plant m-2, with two plants per point and a spacing of 20 by 20 cm. Weed control was done using hand hoes twice or thrice depending on weed intensity and labour availability. During the season, chloropyrifos 5% (DursbanTM) was applied for control of the stem borer complex and the African rice gall midge (Orseolia oryzivora Harris & Gagné (Diptera: Cecidomyiidae).The experimental design was a randomized complete block design. The nutrient rates evaluated were the following: 0 (N0), 50, 100, and 150 kg N ha-1; 0, 12.5, 25.0, and 37.5 kg P ha-1; and 0, 30, 60, and 90 kg K ha-1. The N-P-K treatments were 0-0-0, 50-0-0, 100-0-0, 150-0-0, 50-12.5-0, 100-12.5-0, 150-12.5-0, 50-25-0, 100-25-0, 150-25-0, 50-37.5-0, 100-37.5-0, 150-37.5-0, 50-12.5-30, 100-12.5-30, 150-12.5-30, 50-25-60, 100-25-60, 150-25-60, 50-37.5-90, 100-37.5-90, and 150-37.5-90. The incomplete factorial arrangement limited the number of treatment in consideration of Liebig’s law of the minimum, proposed by J. von Liebig in 1840, expecting N and P to be the most and least limiting of the three nutrient deficiencies, respectively. The N0 treatment occurred only with P0 and K0, and P and K effects were tested only with N applied. Similarly, no K was applied for the P0 treatment. The K rates varied with P rates and the K effect was determined by subtracting at the plot level the P rate minus K treatments from the corresponding K-plus treatments after verifying that the P ´ K interaction was not significant. Varieties were a sub-plot factor including Nerica-4 and Superica-1. Nerica-4 is a genotype derived from the interspecific hybridization of WAB 56-104 (Oryza sativa, tropical japonica type) and CG 14 [Oryza glaberrima]). Superica-1 (O. sativa) is a Ugandan release. These Uganda releases were not hybrids and each variety had a maturity period of 120 days. The plot size was 4 by 6 m.
The N, P and K sources were urea, triple super phosphate and potassium chloride, respectively. Fertilizer P was applied pre-plant. Fertilizer N and K were applied with 25% pre-plant, 25% at tiller formation and 50% at panicle initiation. The fertilizers were surface broadcast applied at planting and incorporated. The side dress application of N and K was band-applied to the side of the row and covered with soil. The plants were cut at ground-level from the inner rows in a 1.5 x 2.0 m area and air dried for at least 3 days. The panicles were threshed and the harvested grain weight was determined. After adding the panicle remnants, the straw was weighed to determine the straw yield. The harvested grain was weighed and grain yield calculated. Grain yield was adjusted to 140 g kg-1 water content.
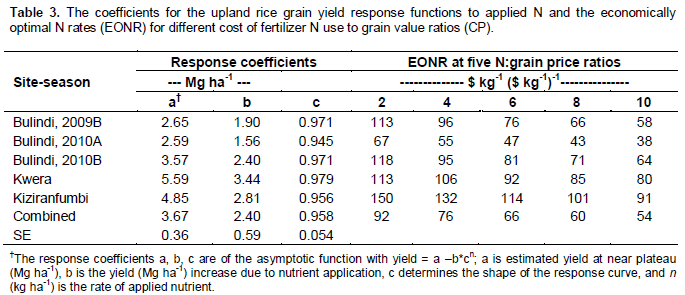
Grain and straw samples were oven-dried at 60°C, ground to pass a 0.5-mm sieve, and analyzed for total N in a single digest by a wet-ashing technique with colorimetric determination (Anderson and Ingram, 1993; Okalebo et al., 2002). The data analyses were done by site-season using Statistix 9 (Analytical Software, Tallahassee, FL) with replications as random variables and varieties and nutrient rates as fixed variables. Analysis of variance combined across the Bulindi seasons was done to test for nutrient rate interactions with seasons after verifying homogeneity of variance. When significant nutrient rate effects occurred for a site-season, an asymptotic yield function was determined: grain yield (Mg ha-1) = a - bcn, where a was near maximum grain yield, b was the yield increase due to nutrient application, and cn determined the shape of the curvilinear response where c was a curvature coefficient and n was the nutrient rate. Regression analyses by site-season and combined across site-seasons were done with plot data. Upland rice response to applied N was determined across all P levels after verifying a lack of N x P rate interaction, and response to applied P was determined with the zero N treatment omitted from the analysis.
The EONR and EOPR, or the nutrient application rates that gave the greatest net return ha-1 to fertilizer use, were calculated for a range of CP. A grain price of US$0.40 kg-1 (Uganda Sh. 2400 US$-1) was used for the economic analysis. Equations were developed using non-linear regression analysis to relate EOR to CP. The BC was considered to be the value of increased yield relative to cost of fertilizer use for the given application rate. Polynomial functions were determined for each crop-nutrient combination to estimate BC with application rate and CP as independent variables. Differences and relationships were considered significant at P ≤ 0.05.
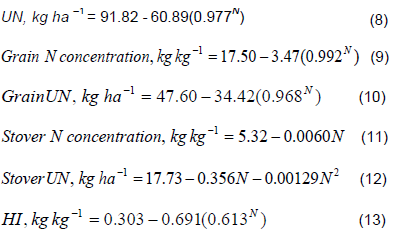
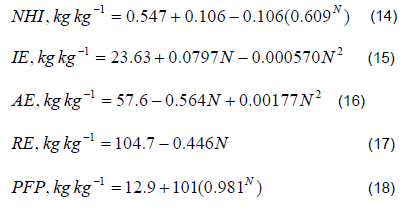
Nonlinear functions that related total N in the aboveground biomass at harvest (UN) to the N rate and grain yield were determined. Asymptotic regression analysis, using individual plot data, related NUE properties to N rate. Exceptions were for straw N concentration and uptake which had linear and quadratic relationships to N rate, respectively, and for RE and agronomic efficiency of N use (AE) which had linear and quadratic relationships to N rate, respectively. The NUE parameters included grain N concentration and content, HI, NHI, internal efficiency (IE) of total plant N taken up from soil and fertilizer, partial factor productivity (PFP), and physiological efficiency (PE), RE and AE for fertilizer N use (Cassman et al., 2002). The NUE components were calculated as follows: IE = Y/UN (kg kg-1) where Y is grain yield (kg ha-1); PFP = Y/N rate; NHI = grain N/UN; RE = (UN+N - UNN0)/N rate; PE = (Y+N - YN0)/(UN+N - UNN0); and AE = (Y+N - YN0)/N rate. The units for IE, PE, AE, and PFP were kg grain kg-1 N and kg N kg-1 N for NHI. The effects of NHI and grain N concentration on IE were determined using linear regression analysis.
RESULTS
The mean upland rice paddy grain yield at N0 was 1.42 Mg ha-1 and was more in on-farm trials than at Bulindi (Table 2). The predicted mean maximum grain yield was 3.67 Mg ha-1 (Table 3), with no significant yield increase for >100 kg ha-1 N applied. The N ´ P rate and N rate ´ site-season interactions, and the interactions with variety, were not significant for grain yield but there was a relatively greater increase in straw yield in season 2010B due to N application when compared with the other seasons.
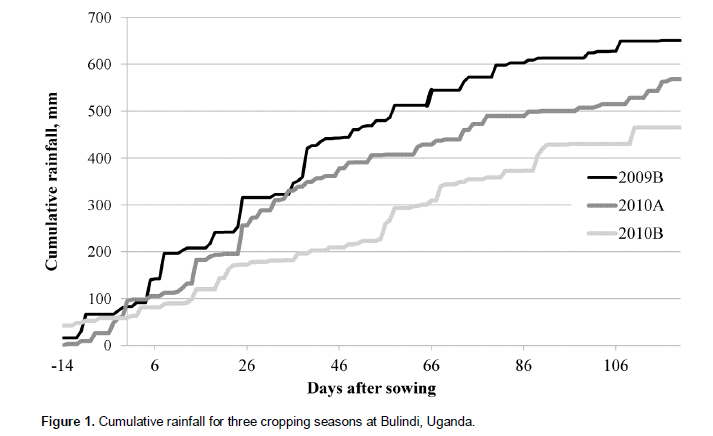
Upland rice grain yield increased in response to N application for all site-seasons (Tables 2 and 3). The predicted overall mean grain yield increase was 2.40 Mg ha-1. The results indicate a very high probability of response to applied N but the magnitude of the response varies. Mean yield response was greater for on-farm when compared with on-station trials but the mean curvature coefficients were similar. Grain yield was significantly increased by application of >50 kg ha-1 N for only two of the five site-seasons but this was not sufficient to result in an N rate x site-season interaction. Combined across all site-seasons, the grain yield response to applied N was
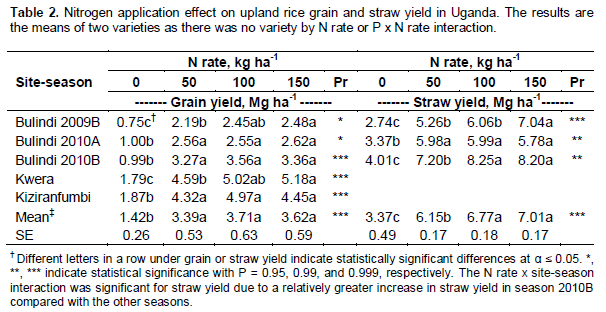
The b and c coefficients of Equations 1 and 2 were not significantly different at α = 0.05 using a z-test. Upland rice straw yield was increased by 50 kg N ha-1 for the three site-seasons where measured, with an additional increase by applying more N for two site-seasons.
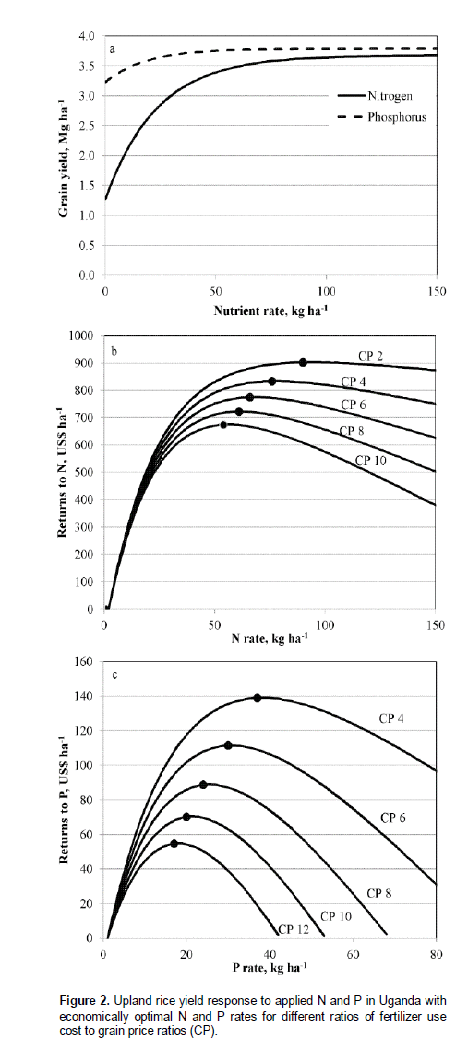
Net returns to N application were positive for all site-seasons and all CPs, and the site-season EONR ranged from 38 to 150 kg ha-1 depending on the CP (Table 3). The mean EONRs determined from the analysis combined across all site-seasons ranged from 54 and 92 kg ha-1 with CPs of 10 and 2, respectively (Figure 2). Net returns to applied N were more sensitive to N rate as the CP increased. The mean EONR can be estimated from the CP according to:

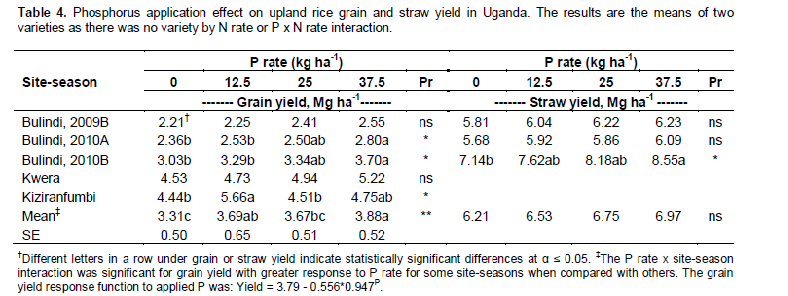
The P ´ K rate interaction was not significant but the P rate ´ site-season interaction was significant for grain yield with P application, in the presence of applied N, resulting in increased upland rice grain yield for three of the five site-seasons (Table 4). Yield increased with up to 25 kg P ha-1 for two site-seasons. In the combined analysis, grain yield was increased by 0.38 Mg ha-1 with 12.5 kg P ha-1. The yield response function from the combined analysis was:

Applying Equation 4, EOPR was determined to be related to CP, with CP for fertilizer P ranging from 4 to 12, as:

Straw yield was increased with 12.5 kg ha-1 P applied at Bulindi in the 2010B season only (Table 4). Mehlich-3 P was low, ranging from 4 to 8 mg kg-1, but there was no indication of a relationship between soil test P and grain yield response to applied P. Grain and straw yield were not affected by K application for any site-season.
The BC of fertilizer use was related to nutrient application rate and CP for ≤100 kg N ha-1 and ≤40 kg P ha-1 as follows:

The BC of fertilizer use was greater with N compared with P application, and decreased as application rate and CP increased.
Plant UN ranged from 31 to 89 kg ha-1 for N0 and with 150 kg N ha-1 and was 79 kg ha-1 at EONR (Table 5). Variation in UN accounted for 82 and 74% of the variation in biomass and grain yield, respectively. Mean grain yield was 14.7 kg kg-1 UN for N0 and 27.6 kg kg-1 UN across all N rates. Internal efficiency (IE), or the efficiency of converting UN to grain yield, is a function of NHI and grain N concentration. The linear effects of NHI and grain N concentration accounted for 72 and 11% of the variation in IE, respectively. Grain N concentration, NHI and IE at an EONR = 66 kg ha-1 for CP = 6 were 15.5 g kg-1, 55% and 35.4 kg grain (kg UN)-1, respectively, which were higher than for the 0N rate (Table 5). The IE decreased with increased N rates.
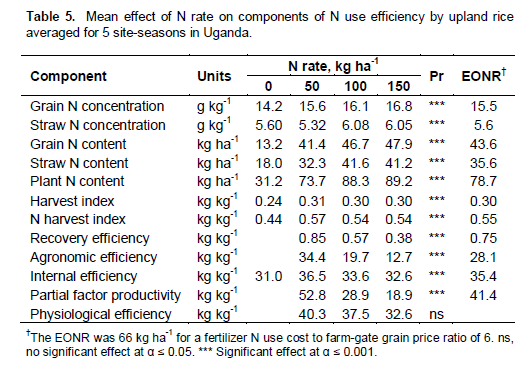
Mean PFP declined with increased N rate and was 41 kg kg-1 at EONR. Mean AE decreased with N rate and was estimated to be 28 kg kg-1 at EONR when compared with 52 and 64 kg kg-1 for sorghum and maize, respectively (Kaizzi et al., 2012a, b). Mean PE of fertilizer N was not affected by N rate which is consistent with the results of the sorghum and maize studies. The following equations, determined from plot data of the three site-seasons at Bulindi, represent the N rate effect on various components of NUE for upland rice in Uganda.
DISCUSSION
The mean yield of 3.67 Mg ha-1 is not high relative to genetic potential of upland rice indicating the importance of other abiotic and biotic constraints in addition to deficiencies of N, P and K. Inadequate rainfall was not an apparent constraint to grain yield in the Bulindi trials as yield was highest in the 2010B season when rainfall was least and less well-distributed when compared with 2009B and 2010A. Variety performance across N rates was similar. This was in agreement with Onaga et al. (2012) who evaluated more varieties and reported a variety x N rate interaction but which accounted for less than 1% of the N rate main effect on variation in yield.
The indigenous soil N supply was apparently low as indicated by a mean grain yield of 1.42 Mg ha-1 and 31 kg ha-1 UN with N0, even though SOM was always >36 g kg-1. In comparison, mean grain yield was about 2 Mg ha-1 across several other studies in Africa (Apaseku et al., 2013; Bationo, 2008; Habtegebrial et al., 2013; Oikeh et al., 2008; Okonji et al., 2012). For further consideration of these agricultural soils of Uganda to supply N, UN with N0 was 31 and 46 kg A1 by sorghum and maize, respectively (Kaizzi et al., 2012a, b).
The large response of upland rice grain yield to N application was consistent with earlier results from Uganda (Kaizzi, 2002; Kaizzi et al., 2007; Onaga et al., 2012), and with the responses of maize and sorghum in Uganda (Figure 3) (Kaizzi et al., 2012a, b). The response to applied N was about twice the mean for that of several studies cited above (Apaseku et al., 2013; Habtegebrial et al., 2013; Oikeh et al., 2008; Okonji et al., 2012). Yield with N applied and at N0 was more and less for maize and sorghum, respectively, when compared with upland rice. The coefficient values for b of 2.14 and 2.40 and for c of 0.94 and 0.96 for maize and upland rice, respectively, were not significantly different resulting in similar curve shape although a higher yield plateau for maize when compared with upland rice.
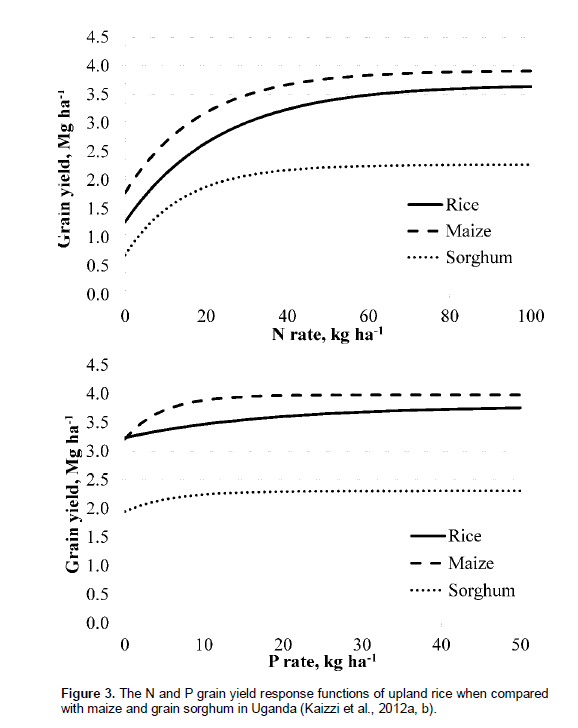
Upland rice response to applied P, with N applied, was near linear and to a higher P rate when compared with maize and sorghum which had little response beyond 10 kg ha-1 P. The significant but small increase in upland rice yield to P application, with N applied, was generally consistent with the responses reported by Oikeh et al. (2008) and Sahrawat (2000) but low and high when compared with results of Bationo (2008) and Apaseku et al. (2013), respectively.Depending on CP, the mean EONR and EOPR for upland rice ranged from 54 to 92 and 17 to 37 kg ha-1, respectively. Finance-constrained farmers commonly do not have enough money to apply fertilizer at EOR to maximize net returns ha-1 for all their cropland. Optimizing the choice of crop-nutrient-rate combinations, in consideration of CPs, is needed to maximize net returns on their constrained investment. Considering 14 other crop nutrient combinations in Uganda using common CP values, Kaizzi et al. (2012c) found that the decreasing order of BC for fertilizer nutrients applied at EOR was bean (Phaseolus vulgaris L.) N > groundnut (Arachis hypogaea L.) P = maize N = soybean (Glycine max L.) P > sorghum N > groundnut K > maize P > bean P > soybean K and > K applied to maize or sorghum. The BC for N applied to upland rice at EOR is greater than for any of the above and the BC for applied P to upland rice is less and more when compared with soybean P and sorghum N. This order could change with changes in relative CP due to changed grain values or nutrient costs. The upland rice EONR allows for BC >2, but BC >2 at EOPR only if CP ≤4 for fertilizer P. The results demonstrate that N application to upland rice can increase farm productivity with high profitability and should have priority over the 14 other crop-nutrient response functions evaluated here and in Kaizzi et al. (2012a, b, c) when fertilizer use is financially constrained. Phosphorus application for upland rice can be profitable when CP is not too high and/or when applied as less than EOPR.
Recovery of applied N in the aboveground upland rice biomass was 75% at EONR which is intermediate between the RE reported for maize and sorghum (Kaizzi et al., 2012a, b). The RE of sorghum was >100% as sorghum performance was poor at N0 and applied N apparently boosted plant vigor and root growth to recover nitrate-N that was otherwise lost to leaching beyond the root zone. Other fertilizer N use efficiency components were low at EONR for upland rice as compared to maize and sorghum including AE and PFP, but this is largely due to the higher EONR of upland rice associated with the higher market value of rice when compared with maize and sorghum. Agronomy efficiency for upland rice from this Uganda study with 50 kg N ha-1 applied was 34.4 when compared with a mean of 18 kg kg-1 calculated from several other studies (Apaseku et al., 2013; Habtegebrial et al., 2013; Oikeh et al., 2008; Okonji et al., 2012) implying relatively high efficiency and potential for high net returns to N applied to upland rice in Uganda.
CONCLUSION
Upland rice yield increased by 178% with N applied at the EONR for a CP of 6. Yield can be further increased with P application but the results demonstrate that N deficiency is much more limiting than P or K deficiency. The results indicate that N application for upland rice production is highly profitable and a priority fertilizer application option relative to 14 other crop-nutrient options of finance-constrained smallholder farmers in Uganda. Application of P is also likely to be profitable when applied at EOR, but less so compared to N, while K application is not likely to be profitable. The recovery and agronomic efficiencies of applied N are high for EONR or lower rates, implying little residual effect for the following crop but also little loss to the environment.
CONFLICT OF INTERESTS
The author(s) have not declared any conflict of interests.
ACKNOWLEDGEMENTS
The authors are grateful to the Alliance for a Green Revolution in Africa (AGRA) and the Government of Uganda for funding the study. The research was also partly supported by the Hatch Act and the U.S. Agency for International Development under the terms of Grant No. LAG-G-00-96-900009-00. The excellent cooperation of participating farmers, field assistants and village based facilitators was essential for good and efficient implementation of the many trials.
ABBREVIATIONS
AE, Agronomic efficiency of N use; BC, benefit/cost ratio; CP, fertilizer use cost to grain price ratio; EONR, economically optimal nitrogen rate; EOPR, economically optimal P rate; EOKR, economically optimal K rate; EOR, economically optimal rate; HI, harvest index; IE, internal efficiency; K0, no K applied; NHI, N harvest index; NUE, N use efficiency; N0, no N applied; PE, physiological efficiency; PFP, partial factor productivity; P0, no P applied; RE, recovery efficiency; SOM, soil organic matter; UN, total N in the aboveground biomass at harvest.
REFERENCES
| Anderson JM, Ingram JSI (1993). Tropical soil biology and fertility: A handbook of methods. CAB Int. Wallingford, UK. | ||||
| Apaseku JA, Mbatchou VC, Dogbe W, Dawda S (2013). Lowland NERICA and some sativa line rice responses to nitrogen and phosphorus in Guinea Savanna agroecoystem. Int. J. Res. Chem. Environ. 3:295-307. | ||||
| Bationo A (2008). Integrated soil fertility management options for agricultural intensification in the Sudano-Sahelian Zone of West Africa. p. 114. | ||||
|
Bouyoucos GJ (1936). Directions for making mechanical analysis of soils by the hydrometer method. Soil Sci. 42:225-230. Crossref |
||||
|
Cassman KG, Dobermann A, Walters DT (2002). Agroecosystems, nitrogen use efficiency, and nitrogen management. Ambio. 31:132-140. Crossref |
||||
| FAOSTAT (2013). Food and Agriculture Organization, Rome. | ||||
| Galabi TJ, Camara M, Yao-Kouame A, Keli ZJ (2011). Profitability of mineral fertilizers in upland rice tray in Gagnoa area in central western Ivory Coast. J. Appl. Biosci. 46:3153-3162. | ||||
|
Habtegebrial K, Mersha S, Habtu S (2013). Nitrogen and sulphur fertilizers effects on yield, nitrogen uptake and nitrogen use efficiency of upland rice variety on irrigated Fulvisols of the Afar region, Ethiopia. J. Soil Sci. Environ. Manag. 4:62-70. Crossref |
||||
| Kaizzi CK (2002). The potential benefit of green manures and inorganic fertilizers in cereal production on contrasting soils in eastern Uganda. Ph. D Thesis. Centre for Development Research. Ecology and Development Series No. 4. Cuvillier Verlag Gottingen. | ||||
|
Kaizzi CK, Byalebeka J, Semalulu O, Alou I, Zimwanguyizza W, Nansamba A, Musinguzi P, Ebanyat P, Hyuha T, Wortmann CS (2012c). Optimizing smallholder returns to fertilizer use: bean, soybean and groundnut. Field Crops Res. 127:109-119. Crossref |
||||
| Kaizzi CK, Ssali H, Nansamba A, Vlek PLG (2007). The potential benefits of Azolla, velvet bean (Mucuna pruriens) and N fertilizers in rice production under contrasting systems of eastern Uganda. In: Bationo A, Kihara J, Kimetu J, Waswa B (eds) Advances in Integrated Soil Fertility Research in Sub-Saharan Africa: Challenges and Opportunities. Springer, The Netherlands, pp. 423-433. | ||||
|
Kaizzi KC, Byalebeka J, Semalulu O, Alou I, Zimwanguyizza W, Nansamba A, Musinguzi P, Ebanyat P, Hyuha T, Wortmann CS (2012a) Maize response to fertilizer and nitrogen use efficiency in Uganda. Agron. J. 104:73-82. Crossref |
||||
|
Kaizzi KC, Byalebeka J, Semalulu O, Alou I, Zimwanguyizza W, Nansamba A, Musinguzi P, Ebanyat P, Hyuha T, Wortmann CS (2012b). Sorghum response to fertilizer and nitrogen use efficiency in Uganda. Agron. J. 104:83-90. Crossref |
||||
|
Kamara AY, Ekeleme F, Omoigui LO, Oikeh SO, Chikoye D, Tegbaru A (2010). Response of upland rice cultivars to nitrogen fertilizer in the savannas of Nigeria. Agron. J. 102:333-339. Crossref |
||||
|
Koné B, Amadji GL, Aliou S, Diatta S, Akakpo C (2011). Nutrient constraint and yield potential of rice on upland soil in the south of the Dahoumey gap of West Africa. Arch. Agron. Soil Sci. 57:763-774. Crossref |
||||
| Koné B, Amadji GL, Igue AM, Ogunbayo A (2009). Rainfed upland rice production on a derived savannah soil in West Africa. J. Anim. Plant Sci. 3:156-162. | ||||
|
Mehlich A (1984). Mehlich 3 soil test extractant: A modification of Mehlich 2 extractant. Commun. Soil Sci. Plant Anal. 15:1409-1416. doi:10.1080/00103628409367568 Crossref |
||||
| Mghase JJ, Shiwachi H, Nakasone K, Takahashi H (2010). Agronomic and socio-economic constraints to high yield of upland rice in Tanzania. Afr. J. Agric. Res. 5:150-158. | ||||
| Miyamoto K, Maruyama A, Haneishi Y, Matsumoto S, Tsuboi T, Asea G, Okello S, Takagaki M, Kikuchi M (2012). NERICA cultivation and its yield determinants: the case of upland rice farmers in Namulonge, Central Uganda. J. Agric. Sci. 4:120-135. | ||||
|
Oikeh SO, Nwilene F, Diatta S, Osiname O, Touré A, Okeleye KA (2008). Responses of upland NERICA rice to nitrogen and phosphorus in forest agroecosystems. Agron. J. 100:735-741. Crossref |
||||
|
Oikeh SO, Somado EA, Sahrawat KL, Toure A, Diatta S (2010). Integrated soil fertility management involving promiscuous dual-purpose soybean and upland NERICA enhanced rice productivity in the savannas. Nutr. Cycl. Agroecosyst. 88:29-38. Crossref |
||||
| Okalebo JR, Gathua KW, Woomer PL (2002). Laboratory methods of soil and plant analysis: a working manual. 2nd ed. TSBF-CIAT, Nairobi, Kenya. | ||||
| Okonji CJ, Okeleye KA, Oikeh SO, Aderibigbe SG, Nwilene FE, Ajayi O, Oyekanmi AA (2012). Rice yield and yield components as influenced by phosphorus and nitrogen application rates in the Moist Savanna of West Africa. J. Agric. Sci. Tech 2:1214-1223. | ||||
| Onaga G, Asea G, Lammo J, Kikafunda J, Bigirwa G (2012). Comparison of response to nitrogen between upland NERICAs and ITA (Oryza sativa) rice varieties. J. Agric. Sci. 4:197-205. | ||||
|
Otsuka K, Kalirajan K (2006). Rice Green Revolution in Asia and its transferability to Africa. Dev. Econ. 44:107-122. Crossref |
||||
|
Sahrawat KL (2000). Determining fertilizer phosphorous requirement for upland rice. Commun Soil Sci. Plant Anal. 31:1195-1208. Crossref |
||||
|
Walkley A, Black IA (1934). An examination of the Degtjareff method for determining soil organic matter, and a proposed modification of the chromic acid titration method. Soil Sci. 37:29-37. Crossref |
||||
| Wortmann CS, Eledu CA (1999). Uganda's agroecological zones: a guide for planners and policy makers. CIAT, Kampala, Uganda. | ||||
Copyright © 2024 Author(s) retain the copyright of this article.
This article is published under the terms of the Creative Commons Attribution License 4.0


