ABSTRACT
Information on the nature and magnitude of genetic variability is one of the prerequisites for a successful breeding program in selecting genotypes with desirable characters. To estimate the level of genetic divergence of lowland rice genotypes, a field experiment was conducted using thirty-six genotypes during 2017 main cropping season. The experiment was laid out 6x6 simple lattice design. Analyses of variances showed significant differences among traits tested, except harvest index. Principal components PC1, PC2 and PC3 accounted for 64.16% of the total variation. The highest inter-cluster distance was exhibited between cluster I and IV (D2 = 769.77), cluster I and VI (D2=485.33), cluster I and III (D2=232.35), cluster III and IV (D2=312), cluster III and VI (D2=197), cluster IV and VI (D2=746.51), cluster VI and V (D2=259.51) and cluster VI and VII (D2=140.15). The crosses between genotypes selected from cluster I with clusters IV, VI and III; cluster IV with clusters III, VI and V are expected to produce better genetic recombination and segregation in their progenies. The cluster means for cluster VI and I were characterized by early heading and early maturity. While cluster I, II, III, and IV were characterized by high mean performance for grain yield for most of its components.
Key words: Cluster analysis, divergence, genetic distance, principal component, rice.
Information on the nature and magnitude of genetic variability is one of the prerequisites for a successful breeding program in selecting genotypes with desirable characters (Dudly and Moll, 1969). It is of great importance for breeders to know the genetic divergence, which classifies a sample of subjects based on a set of different variables into different groups such that similar subjects are put in the same group (Fellahi et al., 2013). It also sorts genotypes into clusters, so the degree of association may be strong between members of the same cluster and weak between members of different clusters. Cluster analysis is performed using measure of similarity levels and Euclidean distance (Everitt, 1993).
Different researchers have grouped rice genotypes using cluster analysis. For example, Sinha and Mishra (2013) reported that using cluster analysis, thirty-four rice genotypes were grouped into five different clusters. In additional approaches, Padmaja et al. (2010) determined the genetic diversity of 150 genotypes of rice by using Mahalanobis D2 statistics, 13 clusters were determined. As utilized in this research study, principal component analysis reflects the importance of the highest contributor to the total variation at each axis of differentiation (Sharma, 1998). The major importance of principal component analysis is reducing the number of dimensions of a dataset with a number of correlated traits without missing any of the information (Jolliffe, 2002). Among the various sources of useful evidence, information of genetic divergence is important for breeders to improve yield, select drought tolerance rice genotypes and disease resistance. Therefore, the objective of this study was to determine the extent of genetic difference of low land rice genotypes and to identify important traits for selective genotypes.
Planting materials
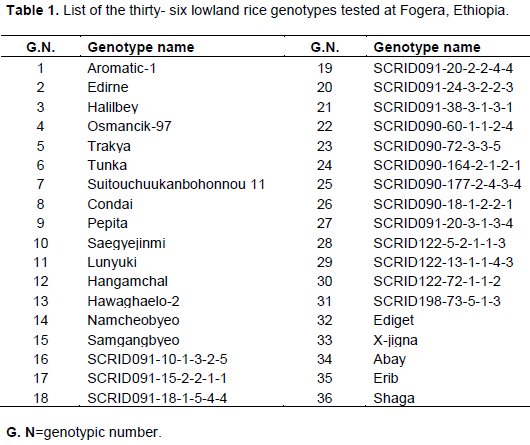
A total of thirty-six rice (Oryza sativa L.) genotypes that introduced from Asian and African rice considered for this study. The genotypes were found from Fogera National Rice Research and Training Center, Ethiopia (Table 1).

Experimental design and procedure
The experiment was laid out in a 6x6 simple lattice design. The dimension of an individual plot area was 1.2 m width x 2.5 m length (3 m2) with six rows for each entry. The spacing between blocks, plots and rows were 1, 0.5 and 0.2 m, respectively. The experimental field was well tilled and planting rows were prepared using a hand-pulled row-maker. Planting was done with the seed rate of 64 kg/ha (19.2 g/plot) and 3.2 g/row. Both Di-ammonium phosphate (DAP) and Urea fertilizers were applied at the rate of 100 kg/ha. The total dose of Urea was equally divided into three, and applied at planting, mid tillering and panicle initiation stages.
Data collection
Data were collected on plot and plant basis according to standard evaluation systems for rice (IRRI, 1998). Plant height (cm), panicle length (cm), number of panicles per plant, number of spikelet per panicle and number of grains per panicle were measured from ten randomly selected plants in the middle four rows of each plot. Data for days to 50% heading, Grain-filling period and days to 85% physiological maturity were collected from plot basis. However, Thousand-seed weight (g), biomass yield (kg/ha) and grain yield were collected on the four central rows.
Statistical analysis
Analysis of variance (ANOVA)
The collected data for all quantitative traits were controlled to analysis of variance for simple lattice design. Analysis of variance also performed using Proc lattice and Proc GLM procedures of SAS version 9.2 (SAS Institute, 2008) after testing the significant difference. Model for simple lattice design is:
Yijr= μ + Ar + Gij +Bir+Bjr+ eijr,
Where Yijr= the value observed for the plot in the rth replication containing the genotype Gij, μ= grand mean, Gij= genotype effect in
the ith row and jth column, Ar= replication effect, Bir=ith block effect, Bjr=jth block effect, eijr, = the plot residual effect.
Principal component analysis (PCA)
The principal component analysis was computed by using the princomp procedure of 9.2 version of statistical analysis system (SAS, 2008). Statistical analysis was computed by taking all factors at a time. The investigation of suitable multivariate technique for analyzing data for all the characters is considered. The following formula was computed scores on the first component which extracted by a principal component analysis.
PC1=b11(X1) +b12+⋯b1p=(Xp)
Where, PC1 = the subject’s score on principal component 1 (the first component extracted), b1p = the regression coefficient (or weight) for observed variable p, as used in creating principal component 1 and Xp = the subject’s score on observed variable p.
Cluster analysis
Clustering the genotypes into different groups was carried out by average linkage method. The appropriate number of clusters was determined from the values of Pseudo F and Pseudo T2 statistics using the procedures of SAS computer software version 9.2 to group sets of genotypes into similar clusters (SAS, 2008).
Genetic divergence analysis
The genetic difference between groups was determined using the Mahalanobis (D2) statistics (Mahalanobis, 1936). The D2 analysis was performed based on the mean values of all traits by using SAS software program. In matrix notation, the distance between any two groups was estimated from the following relationship.
D2ij= (Xi -Xj) S-1 (Xi – Xj)
Where, D2ij = the square distance between any two accessions i and j; Xi and Xj = the vectors for the values for accession ith and jth genotypes; and S-1= the inverse of pooled variance covariance matrix within groups.
Testing the significance of the squared distance values obtained for a pair of clusters was taken as the calculated value of x2 (chi-square) and tested against the tabulated X2 values at n-2 degree of freedom at 1 and 5% probability level, where n= number of characters used for clustering genotypes.
Analysis of variance
The analysis of variance showed that genotypes were highly significant (p < 0.01) for number of grains per panicle, days to heading, grain-filling period, days to maturity, thousand-seed weight, plant height, panicle length, number of spikelets per panicle, number of grains per panicle, biomass yield and grain yield indicating the existence of variability among the tested genotypes. However, harvest index showed non-significant variation on the tested genotypes (Table 2).
Principal component analysis
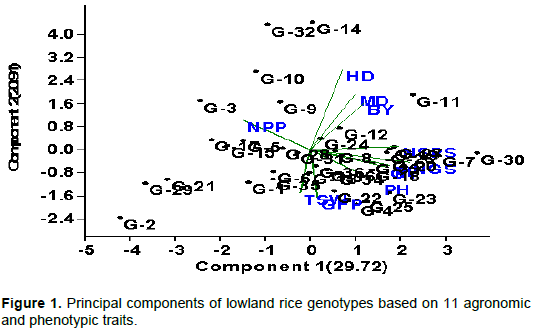
Principal component analysis reflects the importance of the largest contributor to the total variation at each axis for differentiation (Sharma et al., 1998). The result of the principal component analysis of the thirty-six rice genotypes by using 11 quantitative characters is displayed in (Table 3). The result showed that a total of 11 PCs were extracted. However, the first three principal components, with eigenvalues greater than one, contributed 64.16% of the total variability. PC1 with eigenvalue of 3.27 contribute 29.72% of the total variability, PC2 with eigenvalue of 2.3 contribute 20.91% and PC3 with eigenvalues of 1.49 contributed to 13.53% of the total variability (Figure 1). Similar finding was obtained by Worede et al. (2014) explained 73.5% of the total variability in rice using the first three PCs.
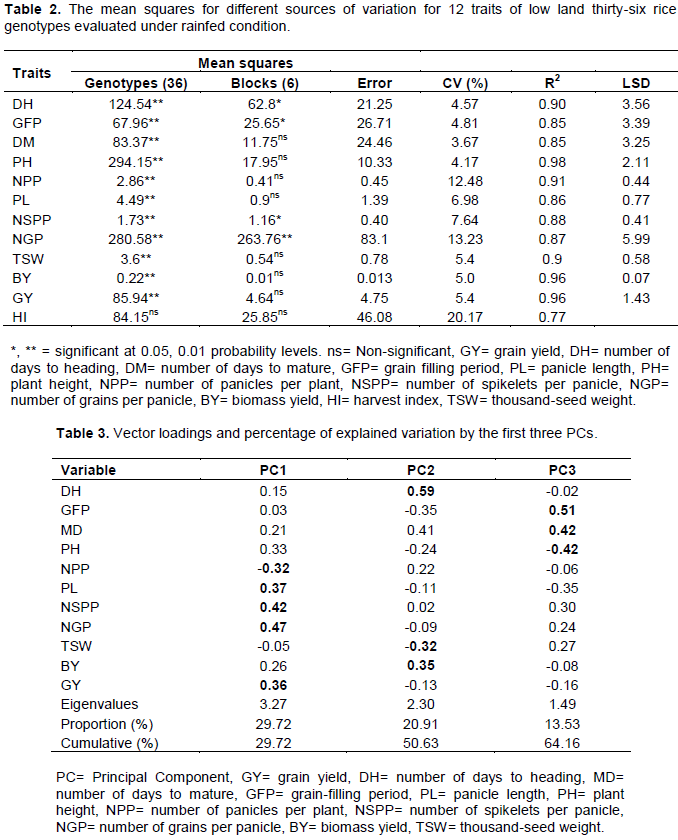
Variables important in the PC1 were number of grains per panicle (0.47), number of spiklets per panicle (0.42), number of panicles per plant (-0.32), panicle length (0.37) and grain yield per hectare (0.36) thus both vegetative and reproductive characters contributed to the component. The second principal component was associated with days to heading (0.59), thousand-seed weight (-0.35) and biomass yield (0.35), this component is weighted by phenological and yield contributing traits. PC3 is related to grain-filling period (0.51), days to maturity (0.42) and plant height (-0.42); both phenological and vegetative characters contributes positively and negatively to the component. Similar results have been observed by Sanni et al. (2012) and Sinha and Mishra (2013).
Cluster analysis
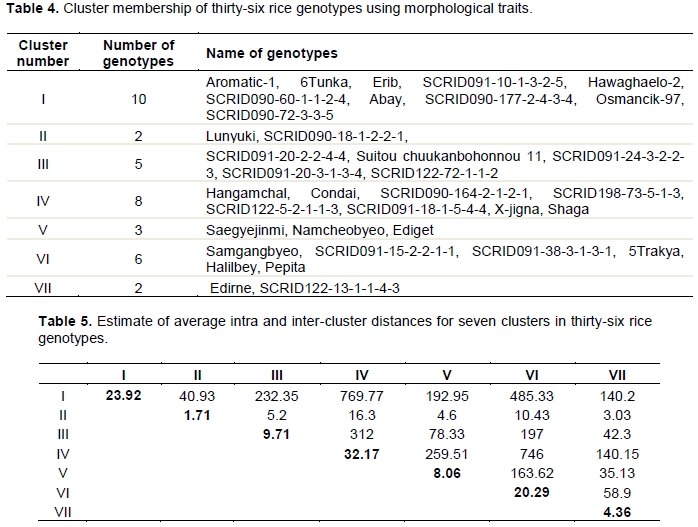
The clustering pattern of the thirty-six rice genotypes into seven clusters as shown in Table 4 revealed that the genotypes of heterogeneous origin were frequently present in same cluster. Although the genotypes originated in same place or geographic region were also found to be grouped together in the same cluster, the instances of grouping of genotypes of different origin or geographical regions in same cluster were observed in case of all the clusters. This indicated lack of any definite relationship or correlation between genetic diversity and geographic origin of the rice genotypes evaluated in the present study. Therefore, the selection of parental material for hybridization programme simply based on geographic diversity may not be a rewarding exercise (Fellahi et al., 2013). The choice of suitable diverse parents based on genetic divergence analysis would be more fruitful than the choice made on the basis of geographical distances. This finding is in conformity with the previous reports encouraging lack of parallelism between genetic and geographic diversity in rice. Cheema et al. (2004) supported that the number of clusters formed, number of genotypes in the clusters and superposition of the genotypes within the clusters indicated the possibility of genetic improvement for yield and yield components. Among the seven clusters, Cluster I was largest group consisting of ten genotypes, followed by Cluster IV having eight genotypes. Cluster VI with six genotypes, Cluster III with five genotypes, while Cluster II and VII had two genotypes each.
Average intra and inter- cluster distances (D2)
The estimates of average intra and inter- cluster distances for seven clusters, revealed that the genotypes present in a cluster had little genetic divergence from each other with respect to aggregate effect of 11 characters under study, while much more genetic diversity was observed between the genotypes belonging to different clusters (Table 5). Since, high or optimum genetic divergence is desired between the parents of hybridization plan for obtaining higher frequency of desirable recombinants, the chances of obtaining good segregants by crossing the little diverse genotypes belonging to same cluster are very low. In order to increase the possibility of isolating good segregants in the segregating generations, it would be reasonable to attempt crosses between the diverse genotypes belonging to clusters separated by large inter cluster distances. In the present investigation, high inter-cluster distances were shown by Cluster I from Cluster IV (769.77), VI (485.33) and III (232.35). Similarly, Cluster III recorded high order inter-cluster distances from Cluster IV (312), VI (197) and Cluster IV were obtained high class inter-cluster distance from cluster VI (746.51), V (259.51) and VII (140.15). Thus, crossing between the genotypes belonging to above stated cluster pairs is recommended for developing high yielding rice genotypes. The lowest inter cluster distance was observed between Cluster II and III (5.2), followed by Cluster II and V (4.6), Cluster II, VII (3.03). This indicated that the hybridization between the genotypes of above three cluster pairs having very low inter- cluster distances could not be rewarding due to little genetic diversity among their genotypes. These findings are similar to those of Baradhan and Thangavel (2011), Kumar and Verma (2015) (Table 5).
Cluster means
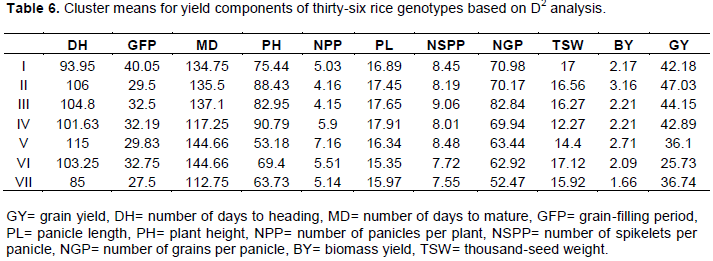
The cluster means for each of the eleven characters for seven clusters revealed that Cluster I with ten genotypes showed desirable highest cluster means for days to maturity and days to heading following second highest cluster means for plant height and number of grains per panicle (Table 6). Cluster II and V had undesirable high means for late days to heading and late days to maturity along with low to moderate means for most of the characters. Cluster IV having eight genotypes showed the highest cluster means for days to heading, days to grain filling period and day to maturity, possessing high performance for most of the characters following, the second highest cluster means for plant height, number of grains per panicle and grain yield. Cluster VI with six genotypes recorded desirable highest cluster means for days to maturity, plant height, number of grains per panicle and grain yield, following second highest mean for panicle length and thousand- seed weight, possessing desirable means for remaining characters. Among the clusters showing high inter cluster distances from Cluster I, III and IV, cluster I was most important and common for all three clusters. Cluster III with five genotypes exhibited undesirable highest cluster means for days to 50% heading, grain filling period and days to maturity, while highest desirable cluster means for plant height, panicle length, number of grains per panicle, the lowest cluster means for number panicles per plant, number of spikelete per panicles and biomass yield. Cluster II, with twelve genotypes, showed undesirable lowest cluster means for grain yield per plant and second lowest cluster mean for biological yield per plant and spikelets per panicle. Cluster V with three (Saegyejinmi, Namcheobyeo, Ediget) genotypes showed undesirable highest cluster mean for days to heading and days to maturity and second highest desirable cluster mean for plant height, number of grains per panicle and grain yield, besides having desirable moderate cluster mean for number of panicle per plant, panicle length, number of spikelets per panicle and thousand- seed weight but biomass yield showed desirable lowest cluster means. In general, genotypes of Cluster VI and I were characterized by early heading and early maturity. Genotypes of Cluster I, II, III, and IV were characterized by high mean performance for grain yield for most of its components.
Clustering was made to categorize quantitative traits into components for the sake of understanding the share constituents contribute to major variation in the study. The cluster based on D2 analysis on pooled mean of genotypes classified the 36 genotypes into seven clusters; which makes them to be highly divergent. The principal component analysis revealed that PC1, PC2 and PC3 accounted for 64.16% of the total variation. This result further confirmed the presence of ample genetic diversity for use in improvement program. The highest inter-cluster distance was exhibited between Cluster I and IV (D2 = 769.77), Cluster I and VI (D2=485.33), Cluster I and III (D2=232.35), Cluster III and IV (D2=312), Cluster III and VI (D2=197), Cluster IV and VI (D2=746.51), Cluster VI and V (D2=259.51) and Cluster VI and VII (D2=140.15), indicates wider genetic divergence among the clusters. The crosses between genotypes selected from Cluster I with Cluster IV, Cluster I with Cluster VI, Cluster I with Cluster III, Cluster III with Cluster IV, Cluster IV with Cluster VI, Cluster VI with Cluster V and Cluster VI with Cluster VII are expected to produce better genetic recombination and segregation in their progenies. Therefore, these rice genotypes need to be crossed and selected to develop high yielding variety. Thus, crossing between the genotypes belonging to above stated cluster pairs is recommended for developing high yielding rice genotypes. The cluster means for each of the eleven characters for seven clusters revealed that Cluster I with ten genotypes showed undesirable highest cluster means for days to maturity and days to heading following second desirable highest cluster means for plant height and number of grains per panicle. Cluster II and V had undesirable high means for late days to heading and late days to maturity along with low to moderate means for most of the characters. Cluster IV having eight genotypes showed the highest cluster means for days to heading, days to grain filling period and day to maturity, possessing high performance for most of the characters following, the second highest cluster means for plant height, number of grains per panicle and grain yield. Cluster VI with six genotypes recorded desirable highest cluster means for days to maturity, plant height, number of grains per panicle and grain yield, following second highest mean for panicle length and thousand- seed weight, possessing desirable means for remaining characters. Cluster III with five genotypes exhibited undesirable highest cluster means for days to heading, grain filling period and days to maturity, while highest desirable cluster means for plant height, panicle length, number of grains per panicle. Cluster V with three (Saegyejinmi, Namcheobyeo, Ediget) genotypes showed undesirable highest cluster mean for days to heading and days to maturity and second highest desirable cluster mean for plant height, number of grains per panicle and grain yield. In general, genotypes of cluster VI and I were characterized by early heading and early maturity. Genotypes of Cluster I, II, III, and IV were characterized by high mean performance for grain yield for most of its components.
The authors have not declared any conflict of interests.
The authors appreciate Fogera national rice research and training center for providing the seeds and land for planting and Habtamu Assega for his unreserved support during the field work.
REFERENCES
|
Baradhan G, Thangavel P (2011). D2 analysis in rice (Oryza sativa L.). Plant Archives 11(1):373-375.
|
|
|
|
Cheema AA, Rashid M, Ashraf M, Qamar ZU (2004). Genetic divergence in rice collections. Pakistan Journal of Botany 36(3):557- 566.
|
|
|
|
|
Dudly JW, Moll RH (1969). Interpretation and use of estimates of heritability and genetic variance in plant breeding. Crop Science 9:257-267.Everitt BS (1993). Cluster analysis. Wiley, New York, USA.
Crossref
|
|
|
|
|
Fellahi Z, Hannachi A, Bouzerzour H, Boutekrabt A (2013). Study of interrelationships among yield and yield related attributes by using various statistical methods in bread wheat (Triticum aestivum L.). International Journal of Agronomy and Plant Production 4(6):1256-1266.
Crossref
|
|
|
|
|
IRRI (1988). Manila, Philippines: Standard Evaluation System for Rice (SES). Revised edition, pp. 10-35.
|
|
|
|
|
Jolliffe IT (2002). Principal component analysis. 2nd ed. Springer-Verlag, New York.
|
|
|
|
|
Kohnaki ME, Kiani G, Nematzadeh G (2013). Relationship between morphological traits in rice restorer lines at F3 generation using multivariate analysis. International Journal of Advanced Biological and Biomedical Research 1(6):572-577.
|
|
|
|
|
Kumar A, Verma OP (2015). Correlation and path coefficient analysis in certain quantitative traits in rice (Oryza sativa L.) under saline-alkaline conditions. Research in Environment and Life Sciences 8(3):443-446.
|
|
|
|
|
Mahalanobis PC (1936). On the generalized distance in statistics. Proceedings of the National Academy of Sciences 2:49-55.
|
|
|
|
|
Padmaja D, Radhika K, Rao LVS, Padma V (2010). Studies on genetic divergence in rice germplasm. Crop Research 40(1/3):117-121.
|
|
|
|
|
Sanni KA, Fawole IA, Ogunbayo S, Tia DD, Somado EA, Futakuchi K, Sie M, Nwilene FE, Guei RG (2012). Multivariate analysis of diversity of landrace rice germplasm. Crop Science 52:494-504.
Crossref
|
|
|
|
|
Statistical analysis system (SAS) (2008). Statistical analysis system. Version 9.2, SAS Institute Inc., Cary, NC, USA.
|
|
|
|
|
Sharma PK, Gupta PK, Balayn HS (1998). Genetic diversity in a large collection of wheats (Triticum spp.). Indian Journal of Genetics and Plant Breeding 58(3):271-278.
|
|
|
|
|
Sharma JR (1998). Statistical and biometrical techniques in plant breeding. New Age International (P) limited, publishers. New Delhi P 432.
|
|
|
|
|
Sinha AK, Mishra PK (2013). Morphology based multivariate analysis of phenotypic diversity of landraces of rice (Oryza sativa L.) of Bankura district of West Bengal. Journal of Crop and Weed 9(2):115-121.
|
|
|
|
|
Worede F, Sreewongchai T, Phumichai C, Sripichitt P (2014). Multivariate analysis of genetic diversity among some rice genotypes using morpho-agronomic traits. Journal of Plant Sciences 9:14-24.
Crossref
|
|