Full Length Research Paper
ABSTRACT
In Senegal, as in other emerging African democracies, political corruption remains rampant. While all experts on Africa acknowledge the profound impact of widespread corruption on politics, there is disagreement on the role corruption plays on average citizens' behavior. Does corruption affect participation in Africa, and if so, does it do so because powerful patrons compel or bribe Africans to vote? Or, are Africans motivated to vote because they dislike corruption and want to punish or remove corrupt leaders? Using a field based experiment set in Senegal, we study the effect of perceptions of national-level corruption on political participation. We find that as perceived corruption increases, subjects are more likely to vote. We replicate these findings with Round 3 of the Afrobarometer survey.
Key words: Corruption, voting, turnout, ethnicity, participation.
INTRODUCTION
Why do Africans vote? They are among the world’s poorest and least educated citizens (Easterly and Levine, 1997; World Bank Development Report, 2000/2001: Attacking Poverty), and research on citizens in the world’s advanced industrialized democracies has consistently found that poverty and lack of education decrease the likelihood of voting (Brady et al., 1995; Verba and Nie; 1987; Wolfinger and Rosenstone, 1980). In addition, African countries are plagued by extremely high levels of corruption (Gyimah-Brempong, 2002), which a number of studies suggest should lower citizens’ perceptions of government competence and legitimacy (Anderson and Tverdova, 2003), with negative implications for turnout. Indeed, a recent multi-country aggregate level study finds that the higher the level of corruption in a particular country the lower the aggregate level of turnout (Stockemer et al., 2013). Taken together, these two bodies of research imply that turnout in Africa should be low. In fact, turnout in Africa is surprisingly high.[i] How can we explain this puzzle?
Work on predictors of turnout in Africa does not support the standard socio-economic model of voting. In a comprehensive analysis of the predictors of aggregate levels of turnout in 32 Sub-Saharan African countries, Kuenzi and Lambright find that neither level of economic development nor economic performance affects levels of turnout (2007).
Bratton and van de Walle (1992, 1997) suggest that for Africans perceptions of corruption may be a more salient indicator of government performance than economic conditions and so a more influential factor in citizens’ decisions to participate. Manzetti and Wilson argue that in the context of developing democracies, neither economic condition nor corruption alone is sufficient to explain political attitudes; instead, one must account for the interaction of these two variables on attitudes toward government (2006, 133). Extending Manzetti and Wilson’s study, we explore how perceptions of corruption and economic conditions interact to affect political participation, specifically turnout.
As we demonstrate, in the context of Senegal, neither the direct effects of economic conditions nor corruption are sufficient to capture the effect that both factors have on voting. Following Manzetti and Wilson, we expect that corruption motivates citizens to vote and this effect increases as economic conditions worsen. Even under good economic conditions, we expect perceptions of government corruption to increase the likelihood of voting. However, in the absence of high levels of perceived corruption, we expect those in good economic conditions to be more likely to vote than those in poor economic conditions.
We implement our experiment on a sample of university students in Senegal, a developing country classified by Freedom House as ‘free’ or ‘partly free’ from 2001 to 2008.[ii] Given that our experimental design required us to select one country as the site for the experiment, there were two primary reasons for selecting Senegal. First, Senegal is representative of many emerging democracies in Africa in several ways. Voting is meaningful in Senegal.[iii] Senegal meets the criteria for our theory: It has had high levels of corruption along with very low levels of economic growth and development. Low levels of economic growth and development mean that many Senegalese citizens are living in poverty. According to World Bank estimates, 48.3% of Senegalese lived below the poverty line in 2005.[iv] Furthermore, in 2007 (the year prior to implementation of our experiment) economic growth was 5% and GDP per capita (PPP) was $1,745.[v] Our theory depends on economic conditions being salient, if not paramount, to citizens in order to affect their vote choice; this makes Senegal an excellent test-cast. Additionally, our theory depends on government corruption being rampant and highly salient. In 2007, Senegal received 3.6 on the Transparency International Corruption Index, which makes it an excellent candidate to test our theory.[vi] Second, although ethnic identity is an important predictor of political participation in many African countries, in Senegal ethnicity plays little or no role in politics (Fatton, 1986; Erdmann, 2007).[vii] In order to establish the effect that corruption has on participation, it is useful to conduct the basic experiment in a country in which ethnicity is not a factor. In this way, Senegal may be the prototypical case for other democracies in Africa as democratic institutions may erode ethnic voting over time (Lynch and Crawford, 2011). For our survey analysis, we use data from Round 4 of the Afrobarometer survey of Senegal, chosen because it was conducted at about the same time as the experiment.
To investigate the direct and interactive effects of economic conditions and corruption on decisions to vote in Senegal we use two methodologies, a structured experiment and survey analysis. Experiments are commonly used to study the micro-foundations underlying individual decisions to participate in both developed (Cover and Brumberg, 1982; Gerber and Green, 2000) and developing democracies (Brader and Tucker, 2006; Wantchekon, 2003; Henrich et al., 2001). Given that most studies of turnout in developing countries rely on aggregate level data, our study provides insight into how key factors impact individuals' decision to vote. Thus, we use a structured field-based experiment as our primary method, which we implemented in June and July 2007 on a convenience sample of university students in Senegal. This experiment allows us to assess the impact on subjects’ predisposition to vote when their economic circumstances as well as perceptions of corruption are jointly manipulated; thus, the experiment is an internally valid method used to test the direct as well as interactive effects of economic conditions and corruption on subjects’ decisions to vote (McDermott, 2002). To test for external validity of our experimental results, we conduct analysis on Round 4 Afrobarometer survey data, was conducted in Senegal between May and June 2008. By using both experimental and survey methods, we are able to blend the benefits of two micro-level methodologies in such a way as to provide a rich analysis of the impact of perceptions of corruption and economic conditions on turnout in Senegal.
In the next section, we discuss the literature and theory pertaining to the direct and potentially interactive effects of corruption and economic conditions on voters’ turnout. Next, we discuss the design and implementation of our experiment. Following the explication of our experimental results, we report the results of regression analyses of the effects of perceptions of corruption and economic conditions on turnout in Senegal. In both the experiment and survey, we find that subjects who identify leaders as corrupt are more likely to vote than those who do not view leaders as corrupt. Those who experience good economic conditions are more likely to vote than those that experience bad economic conditions. And finally, the positive effect of perceived corruption on likelihood of voting is particularly strong for those living in bad economic conditions.
Predicting voters’ turnout in Africa
Economic conditions. According to existing research, economic conditions may impact political participation differently in developing as opposed to developed economies, although results are not conclusive. Classic work on the predictors of individual-level voting consistently find that good economic conditions positively affect citizens’ likelihood of voting in advanced industrialized democracies (Brady et al., 1995; Rosenstone and Hansen, 1993, Verba et al., 1995), findings corroborated by studies of turnout at the aggregate level (Powell, 1982; Blais and Dobrzynska, 1998).[viii] In Rosenstone’s words (1982), poor economic circumstances dampen participation because “when a person experiences economic adversity his scarce resources are spent on holding body and soul together – surviving – not on remote concerns like politics” (Wolfinger and Rosenstone, 1980, Hirschman, 1970). On the other hand, Radcliff (1992) argues that citizens facing economic hardships may engage in political activity as a means of seeking redress for their grievances (pg. 446). He finds that although economic downturns demobilize electorates in developed countries, they mobilize electorates in developing countries (Pacek and Radcliff, 1995).[ix] Norris finds that income does not consistently predict likelihood of voting across developing democracies (2002).
In general, studies of the impact of socioeconomic variables on turnout in Africa report results are inconsistent with those found in developed democracies. In a multi-country study using aggregate data, Kuenzi and Lambright find that neither level of economic development nor economic performance affects levels of turnout in sub-Saharan elections (Kuenzi and Lambright, 2007). Work based on individual-level data tends to support this null finding. Using data from surveys of three African countries (Ghana, Zambia and South Africa), Bratton and Mattes find that respondents’ economic conditions have little or no impact on perceptions of government legitimacy, and, by implication, may have little impact on participation (2001). Kramon finds that neither income nor education impact voting in Kenya (2013).
On the other hand, in their recent study of individual-level predictors of voting, Kuenzi and Lambright (2011) provide convincing evidence that in Africa poor economic conditions actually increase the likelihood of voting. Analyzing data from Afrobarometer Round 1 surveys of ten African countries, they find that a number of variables highlighted in the literature on turnout significantly increase the likelihood that an individual will vote (e.g. partisanship, membership in voluntary organizations, age and education). However, in contrast to results found in developed democracies, Kuenzi and Lambright find that the lower one’s economic status the greater one’s likelihood of voting, and rural residents are more likely to vote than urban residents. In a related inquiry, Lindberg (2012) finds that when citizens evaluate the national economy as improving, they are more likely to support the incumbent.
Inconsistency of results on impact of economic conditions on turnout in Africa suggests that context matters and, just as Bratton and others have argued, factors other than their own and their country’s economic situation may be impacting Africans’ evaluations of their governments’ performance and so turnout. Corruption is a major contextual factor distinguishing developed from developing countries, an explanatory variable that is generally missing from analyses of turnout in developing countries.
Corruption.[x] Most contemporary studies suggest that perceived corruption leads to worsening confidence in government (Anderson and Tverdova, 2003; Tavits, 2008; Bowler and Karp, 2004; Redlawsk and McCann, 2005; Manzetti and Wilson, 2006). Classic studies on turnout in American politics conclude that when voters’ trust and confidence in government decline, they will be less likely to vote (Abramson and Aldrich, 1982; Southwell, 1985; Powell, 1986). A recent multi-country aggregate level study (including six countries in Africa) of the impact of level of corruption (as measured by the Political Risk Services’ International Country Risk Guide) on aggregate turnout finds a significant negative relationship—corruption dampens turnout (Stockemer et al., 2013). However, these researchers do not distinguish effects across developed and developing democracies, and regional studies provide mixed support for these findings. For example, Stockemer and Calca (2013) find that corruption increases turnout in municipal elections in Portugal. At the micro-level, Kostadinova (2009) finds a weakly positive effect of corruption on turnout in her study of eight post-communist democracies in Eastern Europe. Similarly, Shi (1999) finds that voters in China are prompted to turn out in local elections in order to punish corrupt officials. Although Davis et al. (2004) find that perceptions of corruption decrease the likelihood of voting in three Latin American democracies (McCann and Dominguez, 1998), the preponderance of evidence collected to date suggests that in developing democracies where corruption is typically a widely recognized and acute problem, perceptions of governmental corruption may increase the likelihood of voting because citizens who view corruption as a reflection of governmental incompetence and illegitimacy may be motivated to remove incumbents and hence may be more likely to participate (Gamson, 1968; Seligson 2002; Anderson and Tverdova, 2003).
Experts have long cited corruption as one of the most important factors affecting attitudes toward government in Africa (Hope and Chikulo, 2000; Mbaku, 2007), and according to Transparency International’s Corruption Perceptions Index corruption in Africa is among the worst in the World.[xi] Yet, the impact of corruption on turnout in Africa has not yet been addressed. Work on Africans’ trust, confidence and satisfaction with their government finds that political evaluations, including perceptions of governmental corruption, are highly relevant (Bratton and Mattes, 2001; Mattes and Bratton, 2007). Bratton et al (2005) find that perceptions of corruption decrease citizens’ satisfaction with democracy. Literature that links corruption to poor economic performance (Mauro, 1995, 1997a, 1997b)shows that high levels of corruption negatively affect economic conditions. From the perspective of the public’s opinion of their elected representatives, research suggests that the combination of high corruption and bad economic conditions ought to significantly increase citizens’ motivation to “throw the rascals out”.
Do Perceptions of Government Corruption Condition the Effects of Economic Circumstances on Participation? There are empirical and theoretical reasons to believe that perceptions of corruption may condition the effect of economic circumstances on turnout. As Manzetti and Wilson (2006) argue, in developing democracies, neither economic performance nor corruption alone is sufficient to explain political attitudes, and by extension political participation. In their analysis of political attitudes in Argentina, Manzetti and Wilson (2006) find that citizens’ attitudes toward government depend interactively on both their perceptions of government corruption as well as their own economic situation. Among those who perceive a high level of governmental corruption, those who are also economically disadvantaged are less likely to have confidence in their government than those who are doing well. Participation may result from such an interaction. When economic conditions are improving, but corruption is high, the positive impact of improving economic conditions on turnout may be dampened by perceptions of corruption. On the other hand, when economic conditions are improving and corruption is perceived to be low better economic conditions may increase the likelihood of voting. Speaking generally, Mishler and Rose theorize that “The effects of macro-political and economic performance on trust are indirect and mediated at the micro level by individuals’ value-laden perceptions. Although individuals are unlikely to overlook either runaway inflation or gross corruption, they may discount the importance of one in favor of the other depending on their individual circumstances” (2001, pg. 55).
In Africa, where scholars have found inconsistent empirical support for the positive impact of economic conditions on turnout, it may be that in the face of consistently poor economic performance citizens gauge the performance of their political representatives based on other criteria, in particular corruption. Thus, we expect to find that those who perceive a high level of corruption are particularly motivated to vote, and this effect is augmented when their own economic circumstances are poor. We investigate the possibility that to understand the impact of economic conditions and corruption on turnout, we must account for their interactive effects.[xii]
In both the experiment and survey, participants were asked about their past or future voting behavior, the dependent variable in each analysis. In each case, the 2007 Senegalese presidential election would have served as the empirical referent; therefore, it is worth noting that during this important election, both economic conditions and corruption were highly salient to voters. Although voters had witnessed increased infrastructure development, including a new coastal highway in Dakar and promises of a new airport and university, employment remained low and prices for commodities were soaring. President Wade was having trouble keeping the lights on for his citizens. As one voter explained, "What the old man promised us, he didn't do … I need a real job, not a nice road. Not an airport. As soon as I save enough money, I will take the boat, even if it means losing my life” (Callimachi, 2007). Infrastructure projects are often perceived to be wasteful and corrupt in Senegal; therefore, it is not surprising that in addition to poor economic conditions, governmental corruption remained a top issue in 2007 (USAID, 2007; Freedom House’s Senegal Country Report, 2007[xiii]). Villalón notes that “Popular discourse regularly derides such projects as prestige expenditures for Wade and as opportunities for corruption and enrichment for his inner circle. A series of corruption scandals has fed the perception that a select few are becoming extremely wealthy at public expense, while life remains hard for the vast majority” (Villalón, 2011).
Participation in Senegal: Evidence from a field-based experiment
We conducted our experiment at the University of Dakar, Cheikh Anta Diop (UCAD). Two hundred and eight students from the university participated in the experiment.[xiv] Our purpose was to test whether subjects who were informed about national-level corruption were more or less likely to vote and whether or not this relationship was conditioned by the subjects’ economic circumstances. We also tested for the direct effect of economic circumstances on voting. As discussed above, the experiment provides a test of internal validity for our theory.
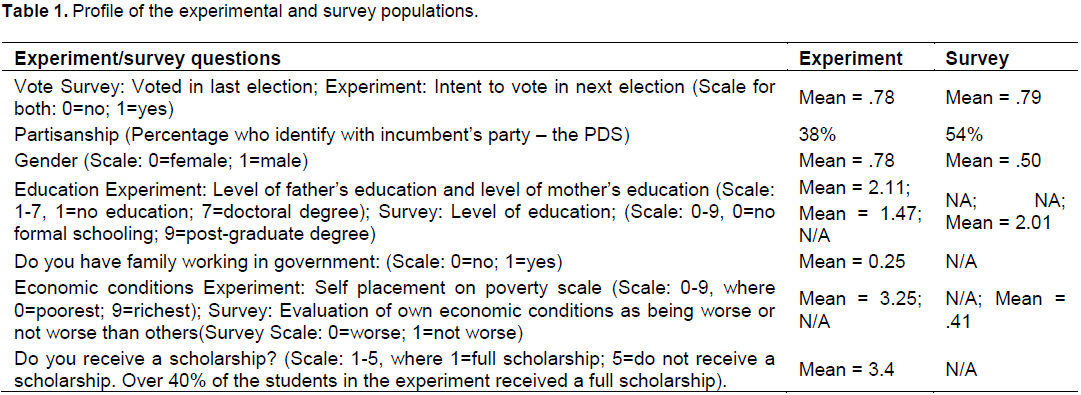
By its nature, the sample of university students used in the experiment was not representative; clearly, they are more educated, younger, and more male[xv] than the general Senegalese population, which is why we replicate our findings using the representative survey sample from the Afrobarometer. We were fortunate that the survey was carried out at about the same time as our experiment. As can been seen in Table 1, those who participated in our experiment and those surveyed by the Afrobarometer were equally likely to vote. Furthermore, although the scales used on the two samples differ, participants in the experiment ranked their family’s economic conditions as being about 36% of the relevant scale (which ranged from 0 to 9) and participants in the survey ranked their own economic conditions as being about 41% of the relevant scale (captured by a 0 for worse or 1 for not worse); thus, both samples had comparable perceptions of their own or their family’s level of poverty.[xvi] Finally, although the students sampled in the experiment were more educated than their parents, when we compare the education level of students’ parents with the education level of survey respondents, we find that students’ parents had an average education comparable to those surveyed (completed primary education). Thus, the student sample came from a comparably educated and no richer socio-demographic group. The most important difference between our student and survey sample was level of partisanship; the younger, student sample was less partisan (38%) than the survey sample (54%).
[i] Average turnout in the most recent elections in six democracies (Benin, Botswana, Ghana, Namibia, Senegal and South Africa) is 77%, with lowest reported turnout in Senegal (57%) and highest in Namibia (84%).Turnout figures are based on the proportion of the voting age population that participated in the last presidential election (or parliamentary election in Botswana and South Africa). Data were taken from the IDEA (Institute for Democracy and Electoral Assistance) web site. In those elections where two rounds were held, we used turnout for Round 1. Turnout figures were: Benin 84.82%, Botswana76.71%, Ghana 80.15%, Namibia 84.81%, Senegal 57.12%, South Africa 77.30%). Because turnout was not reported for the Namibian 2009 presidential election, we report results for 2004.
[ii] We used Freedom in the World County Ratings, 1972 – 2008, published by Freedom House and available online at www.freedomhouse.org. From 2009 through 2012, Senegal slipped to partially free on the index, due to increasingly authoritarian behavior by then-incumbent President Abdoulaye Wade. Wade lost his bid for reelection in the 2012 presidential elections and in 2013, Senegal regained status as a free country, according to the Freedom House metric.
[iii] As evidenced by two peaceful transitions of power at the Presidential level: the first instance occurring when Abdoulaye Wade’s Senegalese Democratic Party (PDS) ousted the Socialist Party, which had held power since Independence and the second more recent instance when Macky Sall’s Alliance for the Republic ousted President Wade and the PDS in 2012.
[iv] See World Bank “Poverty headcount ratio at national poverty line (% of population), available at http://data.worldbank.org/indicator/SI.POV.NAHC/countries/SN?display=graph, accessed October 14, 2014.
[v] GDP data are from World Bank Indicators, http://data.worldbank.org.
[vi] Transparency International defines corruption as the abuse of public office for private gain and measures the degree to which corruption is perceived to exist among a country's public officials and politicians. The Corruption Perceptions Index ranges from zero (highly corrupt) to ten (squeaky clean). Transparency International considers 5.0 to be the borderline score distinguishing countries that do and do not have a serious corruption problem.
[vii] Senegal is relatively homogenous. About 50 percent of citizens are Wolof with a handful of smaller ethnicities. 90 percent of citizens speak one or both of the national languages (French and Wolof). 95 percent of the population is Muslim.
[viii] Scholars argue that the aggregate relationship between economic development and turnout is due to a relationship between economic development and levels of education and income (Lipset 1959). Further, economic performance is associated with more political trust and support (Anderson and Tverdova 2003, pg. 102).
[ix] A similar argument has been posited by the relative deprivation literature that predicts greater magnitudes of civil strife as deprivation intensifies (Gurr 1993).
[x] By corruption we refer to “the misuse of public office for private gain” (Sandholtz and Koetzel 2000).
[xi] For comparisons of corruption in countries around the world, see Corruption Perceptions Index, published annually by Transparency International (TI), available online at www.transparency.org. This index shows that levels of corruption in sub-Saharan Africa are among the worst in the world.
[xii] We are interested in how individuals’ perceptions of the extent of government corruption impact their likelihood of voting. Thus, we are not studying the impact of corrupt behavior, such as vote buying, on turnout (e.g. Fatton 1986, Lemarchand and Legg 1972, Chabal and Daloz 1999, Conroy-Krutz and Logan 2013, Kramon 2013).
[xiii] Available at FreedomHouse.org, https://www.freedomhouse.org/report/freedom-world/2007/senegal#.VLQC5nsYPf0, accessed January 12, 2015.
[xiv] Students are commonly used in experimental work in political science and other social sciences (see Kinder and Palfry 1993 for a rigorous defense of the use of students in experimental work; also see Kam et al. 2007 for an analysis of subject types within and across a variety of political science journals). We follow this tradition because we needed a literate sample for the experiment.
[xv] For cultural reasons, it was difficult to recruit women to the study; thus, the experimental sample included 78% males and 22% females.
[xvi] Only 25% of the sample had family working in the government. 71% had mothers with no formal education; 49% had fathers with no formal education. On the poverty self-placement scale, 27 of the students characterized their personal predicament as “0”, i.e. the poorest measure, while only 1 respondent selected “9”, i.e. the wealthiest measure. Excluding the 43 students who replied “don’t know”, 64% of students answered in categories 0-4 on the poverty scale, while only 35% answered in categories 5-9 (mean=3.20). Overall, students in the sample evaluated themselves as “poor” and were worried about their personal financial situations; 25% of respondents were extremely worried about their financial situations, whereas only 15% were not worried.
EXPERIMENT DESIGN
Procedure: We recruited students by posting flyers in common areas around the university campus. The flyers described the study as a survey about students’ perceptions of university conditions (the cover story). Upon entering the laboratory, the cover story was repeated to the subjects to minimize characteristic demands, such as subject hypothesis guessing. Next, each participant was given a survey packet, containing a pretest questionnaire, a newspaper article corresponding to the assigned treatment, and a posttest questionnaire (these items are available upon request). Students were randomly assigned to one of the four treatments, consisting of a newspaper article containing combinations of our economic and corruption treatments:
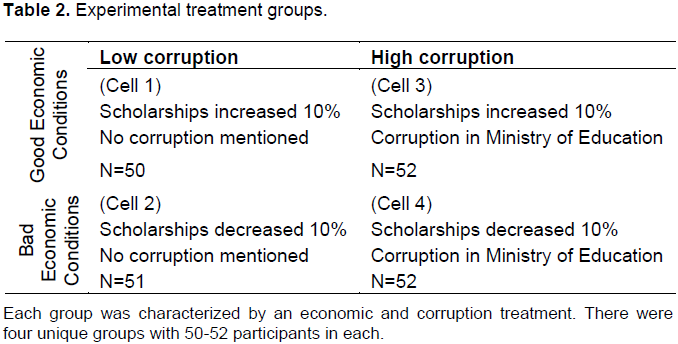
(1) good economic conditions, no corruption, (2) bad economic conditions, no corruption, (3) good economic conditions, corruption, and (4) bad economic conditions, corruption (Table 2). There were 50 to 52 participants in each treatment, for a total of just over 200 students.[i] The pretest questionnaire included a battery of socio-demographic questions. The posttest questionnaire contained questions about participants’ intentions to engage in political participation (our dependent variables). After completing the packet, subjects were compensated[ii] and debriefed.[iii]
Independent Variables (i.e. Treatments): Our treatments consisted of notional newspaper articles.[i] The baseline story in each article reported on classroom conditions at the university, specifically, over-crowding:
“The Ministry of Education was told last September that student scholarships must be cut if UCAD is to improve poor classroom conditions. Topping a list of classroom problems are over-crowded classrooms and a shortage of qualified teachers.”
Following the baseline story, a combination of economic and corruption conditions were presented in each article. The articles were made to look as though they were clipped from a national newspaper and copied to paper. Using random assignment, subjects were placed in one of the four treatments (Table 2).
We constructed our corruption treatment to elicit a change in perceptions of governmental corruption. Subjects in the corruption treatment were told that the Ministry of Education was facing allegations of having paid wages to family members who were not employed by the Ministry. Nepotism of this sort is a form of national-level corruption commonly found in African countries (Hope and Chikulo, 2000; Mbaku, 2007; Meredith, 2005), and it is particularly relevant to the population from which we drew our participants. Subjects in the “low corruption” treatments received articles that did not mention corruption in the Ministry of Education.
We constructed our economic treatment to elicit a change in subjects’ perceptions of their own well-being. Traditionally, income has been the preferred means of capturing personal economic conditions (Kinder, 1981; Pacek and Radcliff, 1995; Radcliff, 1992). However, in Senegal, where poverty and unemployment persists, manipulating income is not likely to elicit feelings of personal relevance among the general population. Further, our subjects are drawn from a student population that is unlikely to be employed. Following work by Darke and Chaiken (2005), who stress the importance of crafting experimental treatments that are relevant to the sample, we use change in scholarship funding as a relevant, valid, and reliable measure of personal economic experience for university students. Most students at the University of Dakar receive scholarships or financial aid from the government in order to attend the University.[ii] Among our student sample, 43% of students receive full scholarships (merit-based); 21% receive partial scholarships; 2% receive partial scholarships with financial aid; 19% finance their education with financial aid; and 19% pay their own tuition (for general statistics on our student and survey samples, see Table 1). Therefore, our “economic conditions” treatment is an increase or decrease in student scholarships, where an increase in scholarships of 10% is intended to elicit positive perceptions of economic conditions, while a decrease of 10% elicits negative perceptions.[iii]
Dependent Variable: The posttest questionnaire contained questions about intentions to vote (as well as attitudes toward/evaluations of political elites). The dependent variable vote is simply the posttest question that asked: “Do you intend to vote in the next national election”. It is coded “1” if the respondent did intend to vote and “0” otherwise.
Analysis: In order to analyze the impact of our treatments on voting behavior, we first ensured that the subjects were randomly and evenly distributed on key individual characteristics across the treatments. Random and even assignment across the four treatments holds constant all of the other factors that may impact participation, thus ensuring that only the treatment effects are driving the results. For example, imagine that attachment to the President’s party (which, at the time of the study was the Senegalese Democratic Party, or PDS) impacts participation. If we ensure that all of the subjects who identify with the PDS are evenly assigned across the four treatment groups, then any impact that attachment to the PDS has on participation will be distributed equally among the treatment groups. Thus, any difference we observe in participation between the treatment groups will be due to the treatment, not partisanship. We verified that subjects were evenly assigned to the treatments by examining the frequency and chi-squared distributions for potential indicators across the treatment groups. For example, the range in frequency across treatment groups for subjects who identify with the PDS is 21 – 28%, and the chi-squared is 0.9, which means that in none of the treatment groups is there a (statistically) significantly larger (or smaller) number of partisans. We used the responses from the pretest questionnaire to test for random and even assignment across several other potential predictors, including: gender, previous voting behavior, level of family income, interest in politics, religion, religious attendance, level of scholarship recipient, father’s and mother’s education, economic evaluations (regarding personal predicaments and national predicaments), and whether or not subjects had family working in the government. None of the chi-squared tests were significant for these variables across the treatment groups. Thus, the only explanatory variables in our experiment are the treatments. This enables us to use difference of means tests to analyze the data rather than a regression analysis where we would need to control for factors that were not randomly distributed across the treatments.[iv]
[i] All of the items were written in French, one of the official languages in Senegal.
[ii] This fact was determined upon personal communication between the authors and the Dean of Social Sciences and Humanities at UCAD, Professor Saliou Ndiaye.
[iii] Based on interviews with University officials, we determined at 10% increase or decrease in scholarships to be a realistic amount for the economic conditions treatment.
[iv] For specific examples of the use of differences in means in posttest-only designs, see the study of cross-cutting cleavages in Mali by Dunning and Harrison (2010). Also, Hibbing and Alford (2004) use difference of means analysis in their experiment to study perceptions of legitimacy and acceptance of authoritarian decision makers. This method is justified when random assignment across the treatments in verified and is recommended as the simplest appropriate interpretation of experimental results. Because we are interested in differences across treatment groups, analysis of posttest results is most appropriate (see Dunning and Harrison (2010) and Hibbing and Alford (2004)).
[i] Samples of this size are common in experimental work (for examples, see Merolla et al. 2008, Farrar et al. 2009, Coan et al. 2008).
[ii] Subjects were compensated 1,000 F cfa for their participation. This is approximately equivalent to U.S. $2.00.
[iii] Debriefing was a critical element of the design for three reasons. First, we wanted to assure the subjects that their confidentiality and anonymity would be maintained. Second, because corruption was a treatment in two of the four conditions, it was necessary that participants knew that the newspaper articles were fictitious, i.e. that the Ministry of Education was not actually corrupt in the way the treatment suggests. Third, because the study took place over a two week period, participants were instructed not to discuss the experiment with anyone.
EXPERIMENT RESULTS
To interpret the experimental results, we compare the mean response for intention to vote (0, 1) between and across treatment groups. To determine the independent effect of economic conditions on voting, we compare the mean intention to vote for Row 1 (Table 2, Cells 1 and 3) with the mean intention to vote for Row 2 (Table 2, Cells 2 and 4). To determine the independent effect of corruption on voting, we compare the mean intention to vote for Column 1 (Table 2, Cells 1 and 2) with the mean intention to vote for Column 2 (Table 2, Cells 3 and 4).
In Table 3, we present the independent effects of economic conditions and corruption on vote. The two rows of Table 3 report differences in means for vote. The mean for good economic conditions is higher than the mean for bad economic conditions; the mean difference is 0.10 and is significant at 0.04, which indicates that, all else equal, those in the bad economic conditions treatment are less likely to vote. This is consistent with the argument that when subjects face economic adversity, they turn their attention away from politics, the effect of which is a decrease in voting (Rosenstone, 1982). In rows 3 and 4 of Table 3, we see that the mean of high corruption is larger than for low corruption, with a mean difference of 0.11 (p-value=0.03). This suggests that individuals are more likely to turn out when they perceive governmental corruption. To summarize: When considered independently, worsening corruption – i.e. an increase in perceived corruption – increases the likely-hood of voting; whereas worsening economic conditions decrease the likelihood of voting.
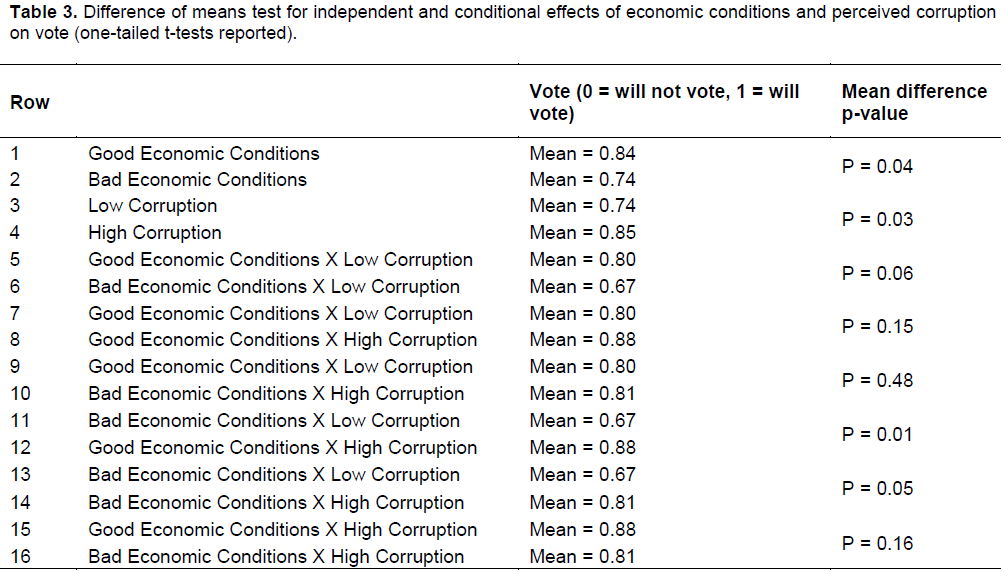
Following Manzetti and Wilson (2006), we are also interested in the combined (or interactive) effects of the economic and corruption treatments, which we obtain by comparing each of the treatments (rows 5 to 16 in Table 3). If we compare rows 5 and 6, we see that subjects in a low corruption treatment are more likely to vote if their economic conditions are good (row 5, mean=0.80) rather than bad (row 6, mean=0.67), and this difference is significant (p-value=0.06).[i] In other words, when perceived corruption is low, bad economic conditions continue to suppress voter turnout. However, when perceived corruption is high, economic conditions have no effect on the likelihood of voting (difference in means between rows 15 and 16 is not significant). Likewise, when economic conditions are good, an increase in perceived corruption does not significantly increase the likelihood of voting (compare rows 7 and 8), but when economic conditions are bad, an increase in perceived corruption significantly increases the likelihood of voting (compare rows 13 and 14). These results tell us that corruption has a strong positive effect on participation when economic conditions are bad, and good economic conditions increase likelihood of voting when perceived corruption is low. Thus, analysis of the impact of economic conditions on turnout will be inconsistent and misleading so long as the interaction between economic circumstances and perceived corruption is not taken into account.
In summary, the experimental results show that corruption increases the intent to vote. This suggests that in addition to having a negative impact on political attitudes (as shown in the studies of Anderson and Tverdova, 2003 and Manzetti and Wilson, 2006 and 2007), exposure to corruption increased the intention of these African students to become active in politics. These results may be surprising to some, who might expect corruption to decrease citizens’ expectations of governmental responsiveness. If corruption did decrease expectations of responsiveness, then citizens in the treatments for high corruption would have been less likely to vote. The evidence, however, shows that they are more likely to vote. In addition, results strongly support the conclusion that Africans use corruption as an indicator of government performance, and so when economic conditions are bad, perceptions of corruption motivate them to vote the rascals out. Our results also suggest that in Senegal, a country with pervasive and high corruption, corruption is a highly salient factor in citizens’ participatory calculus. This was perhaps an especially salient issue during the time frame of the study, when tension between the opposition parties and PDP were escalating.
Participation in Senegal: Evidence from the 2008 Afrobarometer Survey
To test the external validity of our experimental findings, we analyze the 2008 Round 4 Afrobarometer survey of Senegal, the timing of which corresponded as closely as possible to the timing of our experiment. Mean values and coding scales of our dependent and independent variables are summarized in Table 1.
Dependent variables
To measure our dependent variable, we use a simple dichotomous measure of self-reported participation in the last election before the survey was conducted (the presidential election occurred in February of 2007, about a year before the survey was conducted in Senegal). The variable is based on Question Q23D from the Round 4 Afrobarometer survey, and is coded 1 if the respondent reports having voted, 0 otherwise.[i]
Explanatory variables
Perceptions of corruption: In our experiment, we primed our subjects to think about the corruption of national-level political figures in the Ministry of Education. In the Afrobarometer survey, respondents are not asked about particular ministries; however, they are given the opportunity to assess the corruption of different national-level officials, including the office of the president. Among elected officials in Senegal, the president is highly visible and relevant, and in every competitive election so far, the president’s party has also won an overwhelming majority of the seats in parliament; hence, the president dominates by reputation and in fact. (For example, turnout for the 2007 presidential election was about 70%, whereas turnout for the 2007 parliamentary election was about 34%).[ii] Perceptions of presidential corruption are by far the most relevant to national level participation and the only form of corruption we found to be associated with a respondent’s decision to vote, and so we use respondents’ perceptions of corruption of the president’s office as our measure of perceived corruption (Table 4).
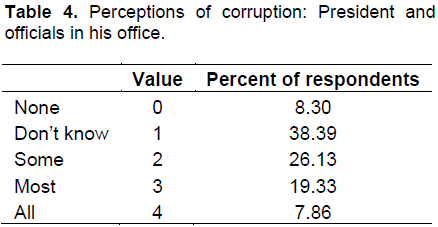
In the survey, respondents were asked to assess the extent to which the president and officials in the president’s office are corrupt (Question Q50A). The measure is a four-point scale ranging from “none” to “all of them”. The percentage of people who believe that “none” of the officials in the president’s office are corrupt is the same as the percentage that believe all are corrupt, 8%. Approximately 26% believe that some are corrupt, and 19% believe that most are corrupt. A sizeable proportion of respondents (about 39%) responded “don’t know”. As discussed in Mattes and Bratton, there are several options when a large number of responses fall into the “don’t’ know” category (2007, see Appendix C). The least appealing is to drop these responses – in our case, this would eliminate close to 40% of respondents. The most appealing option is to recode the ‘don’t know’ responses to some “theoretically defensible spot on the response scale” (p. 207). In the case of the corruption variable, one could argue that respondents who ‘don’t know’ if members of the president’s office are corrupt are having trouble assessing whether some or none of them are corrupt. To create the adjusted scale for the corruption variable, we rescaled the original variable to create an additional category between ‘none’ and ‘some’, and we recoded the ‘don’t know’ responses to fall into this category. The new variable ranges from 0 to 4, where 0 indicates the respondent thinks none of the officials are corrupt, 1 that the respondent doesn’t know if officials are corrupt, 2 that some are corrupt and so on (see Table 4).[i]
Economic conditions[ii]: In our experiment, we expressly designed our economic treatment to be relevant to our students’ personal economic situation, and results of the experiment demonstrate differences in voting behavior between those in good versus poor economic conditions. Our primary measure of personal economic conditions is based on question Q5, which asks respondents to assess their present living conditions as compared to those of others in Senegal. We use this measure to identify those respondents who consider their personal living conditions to be worse than those of others. While there are many possible measures of personal economic conditions in the Afrobarometer survey, only this question asks respondents to evaluate their living conditions relative to those of others. For example, the number of respondents who rate their relative living conditions as worse or much worse than other Senegalese is 427 out of 1,185, as opposed to the 813 respondents who, when asked simply to rate their living conditions, answered ‘bad’ or ‘fairly bad’, a number that includes well over half the sample. To capture the group of respondents who consider their living conditions to be worse than those of others in Senegal, we created a dummy variable coded 1 for those who responded to Question Q5 with the answer “worse” or “much worse”, and 0 otherwise.
Although our primary measure of economic conditions is the self-assessment of relative economic status (Question Q5), we include employment status and having had to go without food as a means to control for objective conditions not captured by the self-assessment. Obviously, being employed is related to a respondent’s economic situation, although the correlation between being employed and the comparative measure of living conditions is only .14. More importantly, being employed captures key features of a respondent’s social environment. Research suggests that citizens who are employed in a job with regular working hours and a regular working location are more likely to be interested and engaged in political activity, even if they are not members of a union. Thus, we expect being employed to have a positive and significant effect on likelihood of voting. The measure of employment status is coded 0 if the respondent is unemployed, 1 otherwise. Of the 1,197 respondents who answer the Afrobarometer question (Q94), only 142 were employed, and those only part time. We also include a control for objective level of poverty; we use Question Q8A, which asks respondents how often they have had to go without enough food. The correlation between the self-assessment of relative economic condition and the variable ‘Gone Without Food’ is .34. This measure ranges from 0, which indicates that the respondent has never gone without enough food, to 4, which indicates that the respondent always has to go without enough food.
Control variables
Social characteristics: Respondents’ level of education is a ten-category variable ranging from no formal schooling through post-graduate education. Age is measured in years. Gender is coded 0 for males and 1 for females.
Political interest: To capture the effect of political interest on participation, we include two measures. The first is based on a question from the Afrobarometer survey that asks respondents about their interest in public affairs (Q13). This question ranges from 0 to 3, where 0 corresponds to “not at all interested” and 3 corresponds to “very interested”. The second is based on the question in the Afrobarometer survey that asks respondents if they feel close to a political party (Q85). In general, we expect partisans to be more likely to vote than non-partisans, since partisanship taps into overall commitment and interest in politics as well as support for a particular political party.[iii]
Interaction of perceptions of corruption and economic conditions
Recall that in our experiment, we found that for those in the bad economic circumstances treatment groups, high corruption significantly increased the likelihood that they would vote. Therefore, we use the survey data to explore the possible interactive effect of corruption and economic conditions on voting. We create an interaction between perceptions of presidential corruption and the dummy variable capturing those who consider their personal economic conditions to be worse than others. The interaction will take on the value of 0 when conditions are good and the value of the perceptions of corruption variable when conditions are bad.
In the following section, we discuss the results of the basic model of voting as well as the interactive model.
Predictors of voting
We report the results of regression analyses of predictors of voting in Table 5. Our dependent variable, vote, is dichotomous. We report the results of logit regression for Models 1 and 2 in Table 5, including log odds estimates as well as predicted probability of voting based on these estimates.
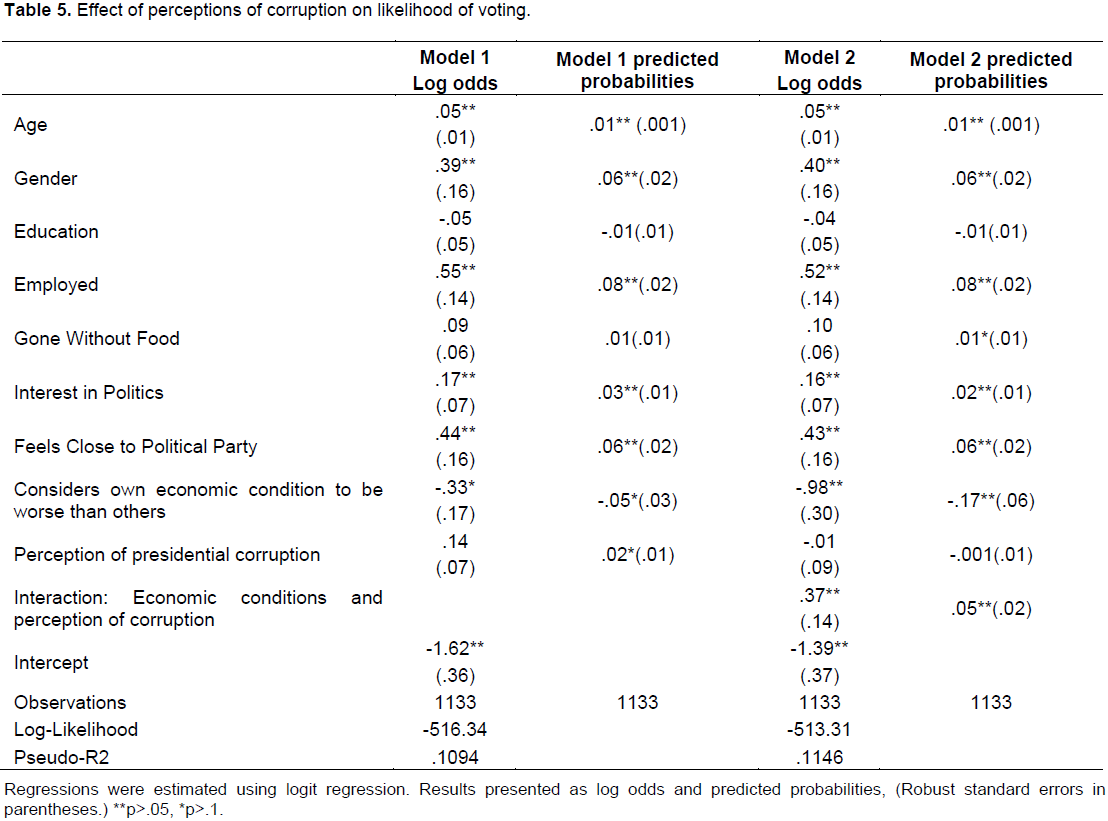
In Table 5 Model 1, we report the results of our basic model, which captures the direct effects of economic conditions and perceived corruption only.
Perceptions of corruption: As we found in the experiment, perceptions of corruption increase the likelihood of voting. Respondents who perceive the president and his office to be corrupt are more likely to vote than those who do not. Holding all other explanatory variables constant at their means, the average marginal effect of a one unit increase in the five point scale measuring perceptions of presidential corruption is to increase the probability of voting by 2%, and this effect is significant at the .05 level.
Economic conditions: In our analysis of survey data, the primary measure tapping into respondents’ personal economic situation – respondents’ relative assessment of their own living conditions – has a negative and significant impact on the probability of voting, mirroring the relationship uncovered in our experiment. The average marginal effect of perceiving oneself to be living in bad economic conditions is to reduce the probability of voting by 5%, and this is significant at the .05 level. Going without food increases the likelihood of voting, but the effect is not significant. Being employed, which captures more than merely economic conditions, has a significantly positive effect, with an average marginal effect on the probability of voting of 8%.
Age, gender, education and employment status: As expected, the older the respondent, the more likely he or she is to have voted. Surprisingly, women are more likely to vote than men. Also surprising, education does not affect voting behavior.
Political interest. As expected, those who are engaged in politics, who are interested or feel close to a political party, are more likely to vote. A one unit increase on the scale of political interest increases the probability of voting by 3%, and partisans are 6% more likely to vote than non-partisans, and these effects are significant.
In general, our effort to replicate our experimental findings using an alternative source of data, one that captures variation in the entire Senegalese population rather than in a small, student-based, subsample, has been successful, providing important external validation of the experimental findings.
Interactive effects
Our final analysis concerns the interaction of perceptions of corruption and economic conditions on probability of voting (Kam and Franzese, 2007). In Model 2, in addition to the variables included in Model 1, we include the interaction of the variable capturing those who consider their economic conditions to be worse than others (coded 1 for those who consider their situation to be worse) and the variable capturing perceptions of presidential corruption (scaled 0 to 4) because we are interested in whether perceptions of government corruption mitigate the negative impact of bad economic conditions on turnout.
In our interpretation of the results reported in Model 2, we note first that the effects of the control variables on voting are unchanged with the inclusion of the interaction. Once the interaction is added to the model, the coefficient on the perceptions of corruption variable tells us the effect of perceptions of corruption on the voting behavior of those in good economic conditions. As can be seen, the effect is positive but not significant, coinciding with our experimental results: When economic conditions are good, increased perceived corruption does not significantly increase likelihood of voting. The coefficient on the variable capturing bad economic conditions is large, negative, and significant; this coefficient captures the effect of bad economic conditions on voting for respondents who perceive no presidential corruption. Thus, for respondents living in bad economic circumstances who believe that the president and his administration are not corrupt, poor living conditions lowers their likelihood of voting (from those in good economic circumstances who do not think the president is corrupt) by 17%, and this effect is significant. Once we control for the interactive effect of economic conditions and perceptions of corruption, we find that the dampening effect of feeling that one is economically worse off than others on voting actually increases.
Finally, the positive coefficient on the interaction of economic conditions and perception of corruption shows that, as we found in the experiment, for respondents’ who perceive their economic conditions to be worse than that of others, the probability that they will vote increases as their perception of governmental corruption increases. Again, the impact of perceptions of corruption on voting is augmented by inclusion of the interaction.
[i] The most commonly chosen solution when the researcher is faced with a large number of ‘don’t know’ responses is to set these responses to the mean; however, this has the potential to increase artificially the fit of the overall regression model. Further, when considering responses to questions about perceptions (not facts), ‘not knowing’ is meaningful. In this case, a ‘don’t know’ response suggests that the respondent is having a very hard time evaluating the presence or absence of governmental corruption, and this falls meaningfully between a response of ‘none’ and ‘some’. The correlation between the two alternative approaches – setting ‘don’t knows’ to the mean or rescaling – is .79. To ensure that our choice of coding strategy is not driving our results, we ran our models with each alternative, setting ‘don’t’ know’ responses to the mean value for each of the three corruption variables, or rescaling ‘don’t know’ responses to fall between ‘none’ and ‘some’ on the original scale. Substantively, our results do not depend on coding strategy, but like Mattes and Bratton (2007), for theoretical reasons, we find the rescaled variable most appealing.
[ii] For all variables capturing economic conditions, we coded ‘don’t know’ answers to the mean response of those who answered the question.
[iii] In fact, when we include dummy variables to capture whether or not respondents feel close to the president’s party or an opposition party, we find that the effect of both variables is positive and highly statistically significant. Although the relationship between partisanship and voting behavior is interesting and important, this complex question demands much more attention and space than we can devote to it in this paper. Therefore, we control not for particular partisan affiliations, but simply for being a partisan.
[i] The Afrobarometer includes only one question on voting behavior – whether or not the respondent voted in the last election. Fortunately, the last election referenced in the question occurred in 2007, the year in which we carried out our experiment. Thus, the predictors of participation should be as comparable as possible across our two methodologies.
[ii] Data were taken from the Institute for Democracy and Electoral Assistance (IDEA) website, www.idea.int/vt/index.cfm.
[i] We consider significance at the 0.10 level or lower. This is standard for experimental work of this kind.
DISCUSSION
As discussed, studies of the impact of economic conditions and of corruption on voter turnout are inconclusive, especially in developing democracies, and we theorize that lack of definitive findings may be due to the fact that these studies do not account for the impact of individuals’ economic conditions on the salience of perceptions of corruption for voting behavior. To correct this, we extend Manzetti and Wilson (2006) to investigate whether or not this interaction impacts individuals’ behavior, in this case, decisions to vote. In Senegal, as in other emerging African democracies, governmental corruption remains a serious threat to the country’s development both economically and politically. If citizens connect corruption with poor economic circumstances (as research by economists, such as Mauro, suggests), we ought to find that corruption is particularly salient to voters who perceive their economic conditions to be bad. Indeed, our findings confirm these expectations.
We implemented a field based experiment designed expressly to uncover the ways in which the interaction between corruption and economic conditions affects citizens’ decisions to vote. In the experiment, we find independent effects for economic conditions and perceptions of corruption: Both good economic conditions and perceptions of corruption increase the likelihood of voting. Our finding that good economic conditions increase the likelihood of voting contradicts literature that examines the effects of economic conditions on voting; our finding that corruption increases the likelihood of voting lends support to research in Portugal (Stockemer and Calca, 2013), Eastern Europe (Kostadinova, 2009), and China (Shi, 1999), but contradicts findings of the opposite in Latin America (Davis et al., 2004) and globally (Stockemer et al., 2013).
Importantly, we also find an interactive relationship between corruption and economic conditions. Specifically, corruption has a particularly strong positive effect on the likelihood of voting when economic conditions are poor. Our analysis of survey data from Senegal supports the experimental findings. Absent perceived corruption, respondents living in bad economic conditions are significantly less likely to turn out to vote than respondents living in good economic circumstances. However, respondents who are aware of political corruption – in our case corruption of the office of president – especially if they are living in bad economic conditions are motivated to vote. Indeed, the greater the perceived corruption of the president’s office, the more likely the respondent is to vote, and this effect is significant for each increase in perceived corruption. The survey data provide external validation of the experimental findings.
Our findings are important for moving scholarship forward in two key ways. Theoretically, our study suggests that individual motivations to go to the polls in Senegal are affected by an interaction between perceptions of corruption and poor economic conditions. Thus, in a country like Senegal, where corruption is high and economic conditions are generally bad relative to developed countries, perceptions of corruption may serve to motivate citizens to vote in higher numbers than traditional explanations of participation would predict. This finding contributes to a small literature on the interactive effects of economic conditions and corruption on political outcomes (Manzetti and Wilson, 2006). While Manzetti and Wilson demonstrate an interactive effect on attitudes, we demonstrate a similar effect on voting behavior. Second, the fact that we were able to replicate the basic relationships in the analysis of survey data collected at a slightly different time and by an independent source lends external validity to our results. Despite poverty and widespread corruption, in Senegal, the conditions and stakes of political engagement change dramatically once democratization has begun in earnest. Both the students in our experiment and the citizens surveyed respond to corruption and poor economic conditions with increased participation in elections. This innovative research design leverages the best of two methods in order to maximize the power of the analysis of voter turnout.
Our study is limited in that it pertains to one developing democracy in Africa: Senegal. We chose Senegal precisely because we believe it to be a representative case of other developing democracies, characterized by relatively poor economic conditions and corruption, but where citizens nevertheless vote in large numbers. In so doing, we control variables that are relevant to the Senegalese case, but may be less relevant for other countries (and other countries may need controls that we do not account for here, for example ethnicity). Future research can extend our theoretical and methodological contribution in this study by examining other contexts in Africa, for example in Ghana, where ethnic cleavages are politically salient, or in Kenya, which is somewhat less democratic than is Senegal but where corruption is an important political issue (e.g. the 2002 election that ousted the decade-long leader Daniel arap Moi and ushered in the Rainbow Coalition led by Mwai Kibaki). As with all uses of the experimental design, no one study can be conclusive, thus, the study can be extended to cross-national designs that incorporate variation along the key variables in this study: economic conditions, corruption, and voting behavior.
CONFLICT OF INTEREST
The author has not declared any conflict of interests.
DISCLAIMER
The views expressed in this paper are those of the authors and do not reflect the official policy or position of the United States Government, the Department of Defense, or any of its components.
REFERENCES
|
Abramson PR, Aldrich J (1982). The Decline of electoral Participation in America. Amer. Pol. Sci. Rev. 76:502-521. http://dx.doi.org/10.2307/1963728 |
||||
|
Anderson CJ, Tverdova YV (2003). Corruption, Political Allegiances, and Attitudes Toward Government in Contemporary Democracies. Am. J. Pol. Sci. 47(1):91-109. http://dx.doi.org/10.1111/1540-5907.00007 |
||||
|
Blais A, Dobrzynska A (1998). Turnout in Electoral Democracies. European J. Polit. Res. 33(2):239-262. http://dx.doi.org/10.1023/A:1006802916256 http://dx.doi.org/10.1111/1475-6765.00382 |
||||
| Brader T, Tucker JA (2006). Reflective and Unreflective Partisans? Experimental Evidence on the Links Between Information, Opinion, and Party Identification. Unpublished manuscript. | ||||
|
Brady HE, Verba S, Scholzman KL (1995). Beyond SES: A Resource Model of Political Participation. Am. Pol. Sci. Rev., 89:271-294. http://dx.doi.org/10.2307/2082425 |
||||
|
Bratton M, van de Walle N (1992). Popular Protest and Political Reform in Africa. Comp. Pol. 24(4):419-442. http://dx.doi.org/10.2307/422153 |
||||
|
Bratton M, van de Walle N (1997). Democratic Experiments in Africa: Regime Transitions in Comparative Perspective, Cambridge/United Kingdom: Cambridge University Press. http://dx.doi.org/10.1017/CBO9781139174657 |
||||
|
Bratton M, Mattes R (2001). Support for Democracy in Africa: Intrinsic or Instrumental? Brit. J. Pol. Sci., 31:447-474. http://dx.doi.org/10.1017/S0007123401000175 |
||||
| Bratton M, Mattes R, Gyiman-Boadi E (2005). Public Opinion, Democracy, and Market Reform in Africa, Cambridge/United Kingdom: Cambridge University Press. | ||||
|
Bowler S, Karp JA (2004). Politicians, Scandals, and Trust in Government. Political Behavior, 26(3):271-287. http://dx.doi.org/10.1023/B:POBE.0000043456.87303.3a |
||||
| Callimachi R (2007). "Senegal's High Unemployment is Top Election Issue," The Washington Post February 24. | ||||
| Chabal P, Daloz JP (1999). Africa Works, Bloomington: The International African Institute in association with Indiana University Press. | ||||
|
Coan TG, Merolla JL, Stephenson LB, Zechmeister EJ (2008). It's Not Easy Being Green: Minor Party Labels as Heuristic Aids. Pol. Psy., 29(3):389-405. http://dx.doi.org/10.1111/j.1467-9221.2008.00636.x |
||||
| Conroy-Krutz J, Logan C (2013). Museveni and the 2011 Ugandan Election: Did the Money Matter?, in: Michael Bratton (ed), Voting and Democratic Citizenship in Africa, Boulder/Colorado: Lynne Rienner. | ||||
|
Cover AD, Brumberg BS (1982). Baby Books and Ballots: The Impact of Congressional Mail on Constituent Opinion. Am. Pol. Sci. Rev. 76(2):347-59. http://dx.doi.org/10.2307/1961114 |
||||
|
Darke P, Chaiken S (2005). The Pursuit of Self-Interest: Self-Interest Bias in Attitude Judgment and Persuasion. J. Person. and Soc. Psy. 89(6):864-883. http://dx.doi.org/10.1037/0022-3514.89.6.864 PMid:16393021 |
||||
|
Davis CL, Camp RA, Coleman KM (2004). The Influence of Party Systems on Citizens' Perceptions of Corruption and Electoral Response in Latin America. Comp. Pol. Stud. 37:677-703. http://dx.doi.org/10.1177/0010414004265879 |
||||
|
Dunning T, Harrison L (2010). Cross-Cutting Cleavages and Ethnic Voting: An experimental study of cousinage in Mali. Am. Pol. Sci. Rev. 104(1):21-39. http://dx.doi.org/10.1017/S0003055409990311 |
||||
|
Easterly W, Levine R (1997). Africa's Growth Tragedy: Policies and Ethnic Divisions. November. Q. J. Econ. 112:1203-1250. http://dx.doi.org/10.1162/003355300555466 |
||||
| Erdmann G (2007). The Cleavage Model, Ethnicity and voter alignment in Africa: Conceptual and methodological problems revisited, GIGA working papers 63. | ||||
|
Farrar C, Green DP, Green JE, Nickerson DW, Shewfelt S (2009). Does Discussion Group Composition Affect Policy Preferences? Results from three randomized experiments. Pol. Psy. 30(4):615-647. http://dx.doi.org/10.1111/j.1467-9221.2009.00717.x |
||||
|
Fatton RJ (1986). Clientelism and Patronage in Senegal. Afri. Stud. Rev. 29 (4):61-78. http://dx.doi.org/10.2307/524006 |
||||
|
Gamson WA (1968). Power and Discontent, Homewood: The Dorsey Press. PMCid:PMC1228952 |
||||
|
Gerber AS, Green DP (2000). The Effects of Canvassing, Telephone Calls, and Direct Mail on Voter Turnout: A field experiment. Am. Pol. Sci. Rev. 94(3):653-63. http://dx.doi.org/10.2307/2585837 |
||||
| Gurr TR (1993). Why Minorities Rebel: A Global Analysis of Communal Mobilization and Conflict since 1945. Int. Pol. Sci. Rev. 14:161¬-201. | ||||
|
Gyimah-Brempong K (2002). Corruption, Economic Growth, and Income Inequality in Africa. Econ. Gov. 3:183-209. http://dx.doi.org/10.1007/s101010200045 |
||||
|
Henrich J, Boyd R, Bowles S, Camerer C, Fehr E, Gintis H, McElreath R (2001). In Search of Homo Economicus: Behavioral Experiments in 15 Small-Scale Societies. Am. Econ. Rev. 91:73-78. http://dx.doi.org/10.1257/aer.91.2.73 |
||||
|
Hibbing JA, Alford J (2004). Accepting Authoritative Decisions: Humans as wary cooperators. Amer. J. Pol. Sci., 48:62-76. http://dx.doi.org/10.1111/j.0092-5853.2004.00056.x |
||||
| Hirschman AO (1970). Exit, Voice, and Loyalty, Cambridge/Massachusetts: Harvard University Press. | ||||
| Hope KR, Chikulo BC (2000). Corruption and Development in Africa: Lessons from Country Case Studies, New York City/New York: Palgrave. | ||||
| Kam CD, Franzese R (2007). Modeling and Interpreting Interactive Hypotheses in Regression Analysis, Ann Arbor/Michigan: University of Michigan Press. | ||||
| Kam C, Wilking JR, Zechmeister EJ (2007). Beyond the 'Narrow Data Base': Another Convenience Sample for Experimental Research. Pol. Beh. 20(4):163-82. | ||||
|
Kinder D (1981). Presidents, Prosperity, and Public Opinion. Pub. Opin. Quart., 45(1):1-21. http://dx.doi.org/10.1086/268631 |
||||
| Kinder D, Palfry T (1993). On Behalf of an Experimental Political Science, in: Donald Kinder and Thomas Palfry (eds), Experimental Foundations of Political Science, Ann Arbor/Michigan: University of Michigan Press. | ||||
|
Kostadinova T (2009). Abstain or Rebel: Corruption perceptions and voting in East European elections. Pol. Policy, 37:691-714. http://dx.doi.org/10.1111/j.1747-1346.2009.00194.x |
||||
| Kramon E (2013). Vote Buying and Electoral Turnout in Kenya, in: Michael Bratton (ed), Voting and Democratic Citizenship in Africa, Boulder/Colorado: Lynne Rienner. | ||||
|
Kuenzi M, Lambright GMS (2007). Voter Turnout in Africa's Multiparty Regimes. Comp. Pol. Stud. 40:665-690. http://dx.doi.org/10.1177/0010414006288969 |
||||
|
Kuenzi M, Lambright GMS (2011). Who Votes in Africa? An Examination of Electoral Participation in 10 African Countries. Party Pol. 17:767-799. http://dx.doi.org/10.1177/1354068810376779 |
||||
|
Lemarchand R, Legg K (1972). Political Clientelism and Development: A preliminary Analysis. Comp. Pol. 4(2):149-178. http://dx.doi.org/10.2307/421508 |
||||
|
Lindberg SI (2012). Have the Cake and Eat It: The rational voter in Africa. November. Party Pol. 19:945-961. http://dx.doi.org/10.1177/1354068811436030 |
||||
| Lynch G, Crawford G (2011). Democratization in Africa 1990-2010: an assessment. Democratization, 18(2):275-310. | ||||
|
|
||||
| Manzetti L, Wilson CJ (2006). Corruption, Economic Satisfaction, and Confidence in Government: Evidence from Argentina. The Lat. Am. 49(2):131-139. | ||||
|
Mauro P (1995). Corruption and Growth. Q. J. Econ. 110(3):681-712. http://dx.doi.org/10.2307/2946696 |
||||
| Mauro P (1997a). The Effects of Corruption on Growth, Investment and Government Expenditure: A cross-country analysis, in: KA Elliot, Corruption and the Global Economy, Washington DC: Institute for International Economics. | ||||
| Mauro P (1997b). Why Worry about Corruption? Econ. Iss., Washington DC: International Monetary Fund. | ||||
|
Mattes R, Bratton M (2007). Learning about Democracy in Africa: Awareness, Performance, and Experience. Am. J. Pol. Sci. 51(1):192-217. http://dx.doi.org/10.1111/j.1540-5907.2007.00245.x |
||||
| Mbaku JM (2007). Corruption in Africa: Causes, consequences, and cleanups, Boulder/Colorado: Lexington Books. | ||||
|
McCann JA, Dominguez JI (1998). Mexicans React to Electoral Fraud and Political Corruption: an assessment of public opinion and voting behavior. Elec. Stud. 17:483-503. http://dx.doi.org/10.1016/S0261-3794(98)00026-2 |
||||
|
McDermott R (2002). Experimental Methods in Political Science. Annu. Rev. Pol. Sci. 5:31-61. http://dx.doi.org/10.1146/annurev.polisci.5.091001.170657 |
||||
| Meredith M (2005). The Fate of Africa: A History of Fifty Years of Independence, New York City/New York: Public Affairs. | ||||
|
Merolla JL, Stephenson LB, Zechmeister EJ (2008). Can Canadians Take a Hint? The (in)effectiveness of party labels as information shortcuts in Canada. Canad. J. Pol. Sci. 41(3):673-96. http://dx.doi.org/10.1017/S0008423908080797 |
||||
|
Mishler W, Rose R (2001). What Are the Origins of Political Trust? Comp. Pol. Stud. 34(1):30-62. http://dx.doi.org/10.1177/0010414001034001002 |
||||
|
Norris P (2002). Democratic Phoenix: Reinventing Political Activism, Cambridge/United Kingdom: Cambridge University Press. http://dx.doi.org/10.1017/CBO9780511610073 |
||||
|
Pacek A, Radcliff B (1995). Economic Voting and the Welfare State: A Cross-National Analysis. J. Pol. 57(1):44-61. http://dx.doi.org/10.2307/2960270 |
||||
| Powell GB (1982). Contemporary Democracies: Participation, Stability, and Violence, Cambridge/Massachusetts: Harvard University Press. | ||||
|
Powell GB (1986). American Voter Turnout in Comparative Perspective. Am. Pol. Sci. Rev. 80:17-43. http://dx.doi.org/10.2307/1957082 |
||||
|
Radcliff B (1992). The Welfare State, Turnout, and the Economy: A comparative analysis. Am. Pol. Sci. Rev. 86(2):444-454. http://dx.doi.org/10.2307/1964232 |
||||
|
Redlawsk DP, McCann JA (2005). Popular Interpretations of "corruption" and their Partisan Consequences. Pol. Behav. 27(3):261-83. http://dx.doi.org/10.1007/s11109-005-4469-3 |
||||
|
Rosenstone SJ (1982). Economic Adversity and Voter Turnout. Am. J. Pol. Sci. 26(1):25-46. http://dx.doi.org/10.2307/2110837 |
||||
| Rosenstone SJ, Hansen JM (1993). Mobilization, Participation, and Democracy in America, New York City/New York: Macmillan. | ||||
|
Sandholtz W, Koetzle W (2000). Accounting for Corruption: Economic Structure, Democracy, and Trade. Int. Stud. Q. 44(1):31-50. http://dx.doi.org/10.1111/0020-8833.00147 |
||||
|
Seligson ME (2002). The Impact of Corruption on Regime Legitimacy: A comparative study of four Latin American countries. J. Pol. 64(2):408-433. http://dx.doi.org/10.1111/1468-2508.00132 |
||||
|
Shi T (1999). Voting and Nonvoting in China: Voting behavior in plebiscitary and limited-choice elections. J. Pol. 61:1115-1139. http://dx.doi.org/10.2307/2647556 |
||||
|
Southwell PL (1985). Alienation and Nonvoting in the United States: A refined operationalization. West. Pol. Q. 38:663-674. http://dx.doi.org/10.1177/106591298503800412 http://dx.doi.org/10.2307/448619 |
||||
|
Stockemer D, LaMontagne B, Scruggs L (2013). Bribes and Ballots: The Impact of Corruption on Voter Turnout in Democracies. Int. Pol. Sci. Rev. 34:74-90. http://dx.doi.org/10.1177/0192512111419824 |
||||
|
Stockemer D, Calca P (2013). Corruption and Turnout in Portugal – A Municipal Level Study. Crime Law Soc Change 60:535-548. http://dx.doi.org/10.1007/s10611-013-9481-7 |
||||
|
Tavits M (2008). Representation, Corruption, and Subjective Well-Being. Comp. Pol. Stud. 41(12):1607-1630. http://dx.doi.org/10.1177/0010414007308537 |
||||
| United States Agency for International Development (USAID) (2007). Corruption Assessment: Senegal. Washington, DC. | ||||
|
Verba S, Nie N (1987). Participation in America: Political Democracy and Social Equality, Chicago/Illinois: University of Chicago Press. PMid:3574548 |
||||
| Verba S, Schlozman KL, Brady HE (1995). Voice and Equality: Civic voluntarism in American politics, Cambridge/Massachusetts: Harvard University Press. | ||||
| Villalón LA (2011). Senegal: Assessing Risks to Stability. Cent. for Strat. Int. Stud. Afr. Prog. | ||||
|
Wantchekon L (2003). Clientelism and Voting Behavior: Evidence from a Field Experiment in Benin. World Pol. 55:399-422. http://dx.doi.org/10.1353/wp.2003.0018 |
||||
| Wolfinger R, Rosenstone S (1980). Who Votes?, New Haven/Connecticut: Yale University Press. | ||||
Copyright © 2024 Author(s) retain the copyright of this article.
This article is published under the terms of the Creative Commons Attribution License 4.0


