ABSTRACT
Tropical forest ecosystems harbor several species of small mammals. Diversity and abundance of small mammals in these forests reflect the quality and diversity of the ecosystems. The current study was carried out to assess abundance and species composition of small mammals (rodents and shrews) in three habitat types (Pterolobium, Juniperus and Cadia habitats) in Hugumburda forest, a dry afromontane forest in the Tigray region of North Ethiopia. The habitat types were selected based on the floristic compositions (plant species diversity) and level of human disturbance. All together, 179 individual small mammals belonging to seven rodent and one insectivore species were captured in 4,320 trap nights. The rodent species, with their relative abundance, were Stenocephalemys albipes, 55 (30.7%); Mastomys awashensis, 53 (29.6%); Arvicanthis dembeensis, 26 (14.5%); Lophuromys flavopunctatus, 22 (12.3%); Mus (Nannomys) setulosus, 14 (7.8%); Arvicanthis abysinicus 4 (2.2%); Dendromus mystacalis, 3 (1.7%) and the insectivore Crocidura olivieri, 2 (1.1%). There was significant variation in the small mammal abundance among the habitat types (χ2=29.45, P= 0.009), with more individuals caught in Pterolobium habitat, which has relatively highest plant species composition and lowest human disturbance than the other two habitats. The highest small mammal species diversity was also recorded in this habitat (H’=1.76). Vegetation diversity and level of human interference are likely the major factors affecting small mammal abundance and composition in Hugumburda forest.
Key words: Small mammals, Hugumburda forest, human disturbance, diversity indices.
Ethiopia encompasses a broad range of ecosystems and habitats that contribute to high mammalian diversity and endemism. Of the 284 Ethiopian mammals, 31 are endemic (Yalden and Largen, 1992). Small mammals (mammals that weight < 5 kg) account for about 39% of Ethiopia's mammals, and 85% of its endemics (Bekele and Leirs, 1997).
The abundance and community composition of small mammals depends on the vegetation structure and com-plexity of the habitat (Muck and Zeller, 2006; Glennon and Porter, 2007; Garratt et al., 2012) with high vege-tation diversity and dense ground cover supporting greater small mammal species diversity (Mulungu et al., 2008).
In contrast, small mammal diversity tends to be lower in less diverse and open habitats (Oguge, 1995; Pearson et al., 2001). Thus, small mammal assessment is an important component of the study of forest ecosystems because they are indicators of habitat condition.
There are 58 forested areas in Ethiopia that have been given priority conservation status (Kidane et al., 2010), but small mammals have been assessed in only some of these (Senbeta and Teketay, 2003). Most of these assessments have been confined to those forests in the central and southern highland areas (Bekele et al., 1993; Bekele, 1996; Yalden et al., 1996; Wube and Bekele, 2001; Shenkut, et al., 2006; Datiko, et al., 2007), probably owing to better accessibility. Hugumburda and Dessa forests, which are the only two priority forests in the Tigray region (province) of northern Ethiopia, are less studied.
In view of these scenarios, we initiated investigation of small mammal diversity and abundance study in Hugumburda forest to assist regional conservationists and foresters in developing management practices for the protection of the forest. We hypothesize that small mammals abundance and diversity will be higher in habitats where vegetation diversity is higher and human disturbances are minimal.
Description of the study area
Hugumburda forest is located in Tigray region of northern Ethiopia (Figure 1), 160 km south of Mekelle, the provincial capital. The forest covers an area of 17,800 ha, between 12°36' and 12°40' N and 39°31' and 39°34' E and has an elevation range of 1600 and 3,000 m above sea level (a.s.l). The mean annual minimum and maximum temperatures are 9°C and 22°C, respectively. The hottest month is May with a mean maximum temperature of 24°C, and the coldest month is December with a mean temperature of 6°C. The mean annual precipitation is 998 mm. The rainy season runs from June to September (Kidane et al., 2010).

Hugumburda forest is a dry afromontane forest representing the only significant expanse of remnant dry coniferous forest in Tigray (Darbyshire et al., 2003; Aerts et al., 2006). The forest suffers from continued human interference (Aynekulu, 2011). Particularly the rate of deforestation has intensified in the last decades mainly to acquire land for agriculture, grazing, settlement and wood charcoal production. Three habitat types (Pterolobium, Juniperus and Cadia) were identified in the forest on the basis of difference in floristic composition and level of human disturbance as described (Aynekulu, 2011). Floristic composition (plant species diversity) was determined according to the greater occurrence of dominant plant species and difference in life form (Figure 2, Table 1). Level of human disturbance was assessed subjectively as less disturbed, moderately disturbed, and highly disturbed, based on grazing intensity (understory cover), cut trees,- and human trails (Aynekulu, 2011).


Pterolobium habitat was found predominantly at lower elevation, between 1600 and 2100 m a.s.l. and was characterized by a gentle slope closely associated with streams and riparian vegetation (Aynekulu, 2011). Pterolobium stellatum (Forssk) Brenan and Celtis africana (Burm. f) are the dominant plant species in this vegetation type (Table 1). This habitat is less disturbed by people compared to the other two (Aynekulu, 2011). Juniperus habitat is located next to the Pterolobium habitat, on gentle to steep slopes at middle elevations (from 2200-2700 m a.s.l). Juniperus procera (Hochst, ex Endl), Olea europea cuspidata (Wall ex G. Don.) and Maytenus senegalensis (Lam) are the dominant plant species in this habitat type (Table 1). Compared to the former habitat type, Juniperus habitat suffered a moderate human disturbance. The Cadia is the third habitat located next to Juniperus habitat at the upper elevations (>2800 m a.s.l). This habitat is categorized as degraded shrub vegetation dominated by Cadia purpurea (Picc.) Ait and Opuntia ficus-indica (L.) Mill (Table 1) (Aerts et al., 2006; Aynekulu, 2011). This habitat suffered the highest human disturbance compared to the other two habitat types (Aynekulu, 2011).
Small mammals trapping
Small mammals were trapped in the three habitats once in a month from November 2012 to January 2013. According to Gebresilassie et al. (2006) and Meheretu et al. (2014) the population abundances of rodents in Tigray peak in months which correspond to the post rainy season that is beginning of the dry season. In each trapping occasion, two transect lines were set per habitat, making 18 transects lines in total in all the three habitats. Transect lines were set such that the two lines were parallel to each other, 600m long and spaced 100 m apart. Each month, the transect lines were moved approximately 100 m away from the previous transect line within the same habitat. Each transect line had 120 trap stations located 5 m apart. Trapping was conducted with Sherman LFA live traps (7.5 x 9.0 x 23.0 cm, HB Sherman Trap Inc, Tallahassee, USA) baited with peanut butter. The overall trapping activity in the three habitats lasted for seven days every month: in the first two consecutive days, traps were set in the first habitat and captures were checked in the mornings of the second and third days. In the afternoon of the third day, traps were moved to the second habitat and set there. Captures were check here in the mornings of the fourth and fifth days, and then in the afternoon of the fifth day the traps were moved to third habitat. Captures in the third habitat were check in the mornings of the sixth and seventh days. Note that, at every trapping occasion traps were set around 16:00hr and captures were checked around 08:00hr the next morning.
Small mammal identification and data analysis
All captured small mammals were anaesthetized in a plastic bag with a small amount of ether soaked in cotton wool. The animals were removed from the bag and a preliminary identification was carried out in the field using morphological characteristics. The identification was later confirmed using appropriate identification keys (Yalden and Largen, 1992; Yalden et al., 1996; Kingdon, 1997; Happold, 2013). The following morphological measurements were taken from each of the trapped small mammals: body, tail, hind foot and ear lengths as well as weight. Furthermore, habitat type, trap location, sex and reproductive condition of the small mammals were determined according to Barnett and Dutton (1995) and Pearson et al. (2001).
Trap success (TS) was calculated using the following formula (Stanley et al., 1996):
Where, Tc = total catch (the total number of animals of species
i caught) and Tn = trap nights (a product of the number of traps used and trapping effort, where trapping effort = number of days of trapping). A trap night was defined as a single trap set for one night Small mammals species diversity was determined using Shannon-Wiener diversity index (H’) (Shannon and Wiener 1949),

where S = number of species, Pi = is the proportion of individuals of the total sample belonging to the i
th species. H’ is influenced both by number of species as well as by evenness. Evenness (J) refers to how close in numbers each species in a habitat type. Evenness was calculated as,

, where

, S is the number of species and H’ is refers to Shannon-Wiener diversity index. This measure varies between 1 (complete evenness) and 0 (complete unevenness).
The percent abundance of each species in each of the habitat types was calculated as the ratio between the number of species found in each habitat and the total number of species recorded in that habitat.
The similarity in small mammal community among the habitats was estimated by Sørensen’s coefficient of community similarity (CCS);

, where S1 and S2 are the number of species occurring in each of the habitat type compared and C refers to the number of species occurring in both habitat types (Sørensen, 1948).
Differences in overall abundance of small mammals among the habitat types were computed using SPSS-version 18 and χ2-test (Levesque, 2006). Levels of significance were determined at P = 0.05.
Small mammal species composition and abundance in relation to vegetation type
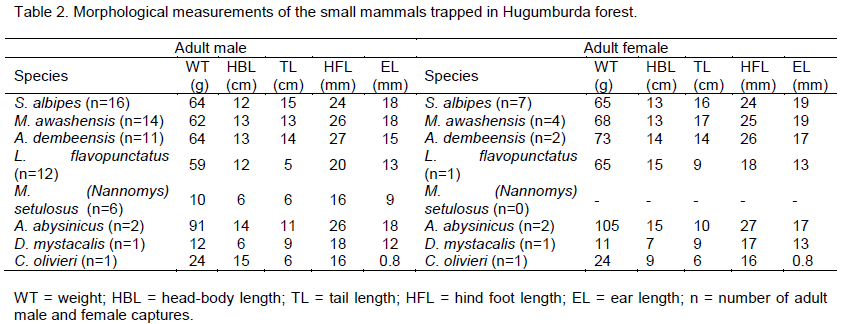
About three-quarters of the small mammals were represented by three rodent species that are endemic to Ethiopia namely the Ethiopian white footed mouse (Stenocephalemys albipes) (Rüppell, 1842), the Awash multimammate mouse (Mastomys awashensis (Lavrenchenko et al., 1998), and the grass rat (Arvicanthis dembeensis, Rüppell, 1842) (Tables 2 and 3). In Pterolobium and Juniperus habitats the Ethiopian white footed mouse was the most dominant species (about 14 and 9% respectively), in Cadia habitat the Awash multimammate mouse was the most abundant species (15%). Three rodent species Lophuromys flavopunctatus (Thomas, 1888), Arvicanthis abysinicus and Dendromus mystacalis were trapped only in Pterolobium and Juniperus habitats.

Overall, 179 small mammals (rodents and shrew) belonging to eight species were trapped from the three habitat (Table 3). Abundance of the small mammals was significantly different among the habitat types (χ2= 29.46, df= 14’, P = 0.009). About 41% of the small mammals, belonging to eight species, were trapped from the Pterolobium habitat. A comparable abundance of small mammals were trapped from Juniperus (31%) and Cadia (28%) habitats, although they belonged to seven and four species, respectively. Trapping success ranged from 3.5% in Cadia to 5.1% in Pterolobium habitat and the overall trap success was 4.1%.
Diversity indices
The Pterolobium habitat recorded the highest Shannon-Weaver Index (H’) of 1.76 while Cadia habitat recorded the lowest H’(1.15) (Table 4). Analysis of the Sørensen’s coefficient of community similarity yielded the highest index between Pterolobium and Juniperus habitats (0.93) and lowest similarity index between Pterolobium and Cadia habitats (0.67)
Small mammals abundance versus habitats
The abundance of small mammals significantly varied among the habitats. About 10-13% more small mammals were captured in the Pterolobium habitat compared to the other habitats. This was justifiable since Pterolobium habitat had the highest floristic composition and the lowest human disturbance. Not surprisingly, Cadia habitat, with less floristic composition and higher human disturbance (more spaced out), harbored the least number of small mammals. Less heterogeneous forest blocks with open habitats support small number of small mammals since they expose small mammals to potential predators and may not provide sufficient food supply (Yalden and Largen, 1992; Mulungu et al., 2008). In similar studies in Ethiopia (Girma et al., 2012; Yihune and Bekele. 2012) variation in small mammal abundances have been reported in response to variations in vegetation diversity and human disturbances since both factors influence availability of food and shelter (against potential predators) for small mammals. In the contrary, however, habitat fragmentation and disturbance such as selective logging in tropical forests do not necessarily result in a reduction in small mammals species diversity (Malcolm and Ray, 2000). Disturbed and transitional habitats in Australia supported comparatively diverse species assemblages by creating a mosaic of heterogeneous habitats compared to a large block of continuous ‘primary’ rainforest (Johnson and Mighell, 1999).
Species composition
The predominant species, the Ethiopian white footed mouse (Stenocephalemys albipes), was trapped in all the habitats. However, most individuals of this species (45%) were captured in Pterolobium habitat. Bekele (2013) reported that S. albipes prefers a dense forest that has diverse vegetation. Hence, the species may serve as an indicator to reveal the situation of forest vegetation cover and diversity.
The second most abundant species, the Awash multimammate mouse (M. awashensis), was also trapped in all of the habitats. However, unlike the former species, most individuals of this species (49%) were trapped in Cadia habitat which was characterized by less floristic composition and higher human disturbance. This was in line with Lavrenchenko and Leirs (2013) who reported the common habitat of the species as degraded vegetation and arable land.
The grass rat (A. dembeensis) was the third abundant species. Individuals of this species were also trapped in all of the habitats, but more (46%) in Pterolobium habitat. According to Wube and Bekele (2001), the species can live in a variety of vegetation types though it prefers dense vegetation cover most probably to avoid potential predators as consequence of its being diurnal.
Comparable numbers of Yellow-spotted brush-furred rat (L. flavopunctatus) were trapped in Pterolobium and Juniperus habitats. Dieterlen (2013) described the species as less tolerance of human disturbed forest habitats, which could be the reason why the species was not trapped from Cadia habitat.
Arvicanthis abysinicus, the Peters’s mouse (Mus (Nannomys) setulosus), the African climbing mice (Dendromus mystacalis) and the African giant shrew (Crocidura olivieri) were also recorded in the present study but in smaller numbers. Therefore, their number was not enough to reach any conclusion on their distribution in each of the habitats.
Diversity indices
The results of the Shannon-Wiener diversity index indicated that the Pterolobium habitat has higher small mammal species diversity than the Cadia habitat. This was in agreement with the abundance of small mammals where it was also higher in Pterolobium habitat. The result of the Sørensen’s coefficient of community similarity analysis also showed variation between the habitats. Consistent with the abundance and diversity of small mammals, habitats with relatively better plant species composition and lower human disturbances scored the highest Sørensen’s coefficient of community similarity compared to habitats with relatively lower plant species composition and higher human disturbances.
In the present study seven species of rodents and one species of insectivore were identified. Overall, species abundance, diversity, evenness and community similarity varied among the habitats in response to variation in floristic composition and level of human disturbance. There was clear indication that the higher the vegetation diversity and the least the level of human disturbance, the higher the small mammals abundance, species composition, evenness and community similarity. This in turn suggested that more conservation efforts may improve the abundance and species diversity of small mammals in Hugumburda forest. We suggest measures be taken to improve the vegetation diversity of the forest and to mitigate the level of disturbance. Creating awareness among local people around the forest may help to reduce cutting trees and keep livestock away from the forest.
The authors did not declare any conflict of interest.
We thank the College of Natural and Computational Sciences of Mekelle University for the financial and material support. We are also thankful to Ofla Sub-district Rural and Agricultural Development Office for the transport support.
REFERENCES
|
Aerts R, Van-Overtveld K, Deckers J (2006). Species composition and diversity of small Afromontane forest fragments in northern Ethiopia. J. Plant Ecol. 187:127-142.
Crossref
|
|
|
|
Aynekulu E (2011). Forest diversity in fragmented landscapes of northern Ethiopia and implications for conservation. PhD Thesis. Ecol. Dev., No. 76.
|
|
|
|
|
Barnett A, Dutton J (1995). Expedition field techniques: Small mammals (excluding bats). Royal Geographical Society, London.
|
|
|
|
|
Bekele A, Capanna E, Corti M, Marcus LF, Schlitter DA (1993). Systematics and geographic variation of Ethiopian Arvicanthis (Rodentia, Muridae). J. Zool. 230: 117-134.
Crossref
|
|
|
|
|
Bekele A (1996). Rodents of the Menagesha state forest, Ethiopia, with an emphasis on the endemic Praomys albibes, Rüppell 1842. Trop. J. Zool. 9:201-212.
Crossref
|
|
|
|
|
Bekele A, Leirs H (1997). Population ecology of rodents of maize field and grassland in central Ethiopia. J. Belg. Zool. 127:39-48.
|
|
|
|
|
Bekele A (2013). Stenocephalemys albipes, White-Footed Ethiopian Rat. In Happold DCD. (eds.). Mammals of Africa. Bloomsbury Publishing, London.
|
|
|
|
|
Darbyshire I, Lamb H, Umer M (2003). Forest clearance and regrowth in northern Ethiopia during the last 3000 years. Holocene 13: 537-546.
Crossref
|
|
|
|
|
Datiko D, Bekele A, Beley G (2007). Feeding ecology of pest rodents from Arbaminch forest and farmlands, Ethiopia. Ethiopian J. Sci., 30: 127-134.
|
|
|
|
|
Dieterlen F (2013). Lophuromys flavopunctatus, Yellow Spotted Brush Furred Rat. In Happold Dcd. (eds.). Mammals of Africa. Bloomsbury Publishing, London.
|
|
|
|
|
Garratt CG, Minderman J, Whittingham MJ (2012). Should we stay or should we go now? What happens to small mammals when grass is mown, and the implications for birds of prey? Ann. Zool. Fenn., 49: 113-122.
Crossref
|
|
|
|
|
Gebresilassie W, Bekele A, Belay G, Balakrishnan M (2006). Home range and reproduction of rodents in Maynugus irrigation field, northern Ethiopia. Ethiopian J. Sci., 29:57-62.
|
|
|
|
|
Girma Z, Bekele A, Hemson G (2012). Small mammals of Kaka and Hunkolo, Southeast Ethiopia. Trop. Ecol. 53:33-41.
|
|
|
|
|
Glennon J, Porter F (2007). Impacts of land-use management on small mammals in the Adirondack Park. Northeast Nat. 14:323-342.
Crossref
|
|
|
|
|
Happold DCD (2013). Mammals of Africa: Rodents, Hares and Rabbits. Bloomsbury Publishing, London.
|
|
|
|
|
Johnson DDP, Mighell JS (1999). Dry-season bird diversity in tropical rainforest and surrounding habitats in north-east Australia. EMU 99: 108-120.
Crossref
|
|
|
|
|
Kidane LW, Bekele T, Nemomissa S (2010). Vegetation Composition in Hugumbirda-Gratkhassu National Forest Priority Area, South Tigray. Ethiopian J. Sci., 2:27-48.
|
|
|
|
|
Kingdon J (1997). The Kingdon field guide to African mammals. Academic Press, San Diego, California.
|
|
|
|
|
Lavrenchenko LA, Likhnova OP, Baskevich MI, Bekele A (1998). Systematics and distribution of Mastomys (Muridae, Rodentia) from Ethiopia, with the description of a new species. Z Saugetierkd 63:37-51.
|
|
|
|
|
Lavrenchenko A, Leier H (2013). Mastomys awashensis, Awash Multimammate. In Happold DCD. (eds.). Mammals of Africa. Bloomsbury Publishing, London.
|
|
|
|
|
Levesque R (2006). SPSS Programming and Data Management: A Guide for SPSS and SAS users. USA.
|
|
|
|
|
Malcolm JR, Ray JC (2000). Influence of timber extraction routes on Central African small-mammal communities, forest structure, and tree diversity. Cons. Biol., 14:1623-1638.
Crossref
|
|
|
|
|
Meheretu Y, Sluydts V, Kiros W, Bauer H, Mekonen T, Gidey Y, Mulungu L, Mitiku H, Nyssen J, Deckers J, Makundi R, Leirs H (2014). Rodent abundance, stone bund density and its effects on crop damage in the Tigray highlands, Ethiopia. Crop Prot., 55: 61-67
Crossref
|
|
|
|
|
Muck C, Zeller U (2006). Small mammal communities on cattle and game grazing areas in Namibia. J. Afr. Zool., 41:215-223.
Crossref
|
|
|
|
|
Mulungu LS, Makundi RH, Massawe AW, Machang'u RS, Mbije NE (2008). Diversity and distribution of rodent and shrew species associated with variations in altitude on Mount Kilimanjaro, Tanzania. J. Mammal 72:178-185.
|
|
|
|
|
Oguge NO (1995). Diet, seasonal abundance and microhabitats of praomys, (Mastomys natalensis) (Rodentia: Muridae) and other small rodents in a Kenyan sub-humid grassland community. Afr. J. Ecol. 33: 211-223.
Crossref
|
|
|
|
|
Pearson DE, Ortega YK, Mckelvey KS, Ruggiero LF (2001). Small mammal community composition and habitat selection in native bunchgrass: implications for exotic plant invasions. Northwest Sci. 75: 107-117.
|
|
|
|
|
Senbeta F, Teketay D (2003). Diversity, community types and population structure of woody plants in Kimphee Forest, a virgin Nature Reserve in Southern Ethiopia. Ethiopian J. Biol. Sci., 2:169-187.
|
|
|
|
|
Shannon GE, Wiener W (1949). The mathematical theory of communication. University of Illinois Press, Chicago.
|
|
|
|
|
Shenkut M, Mebrate A, Balakrishnan M (2006). Distribution and abundance of rodents in farmlands: a case study in Aleletu Woreda, Ethiopia. Ethiopian J. Sci., 29:63-70.
|
|
|
|
|
Sørensen, T (1948). A method of establishing groups of equal amplitude in plant sociology based on similarity of species and its application to analyses of the vegetation on Danish commons. Kongelige Danske Videnskabernes Selskab 5(4): 1–34.
|
|
|
|
|
Stanley WT, Goodman SM, Hutterer R (1996). Notes on the insectivores and elephant shrews of Chome Forest, South Pare Mountains, Tanzania. (Mammalian: Insectivora, Macroscelididae). Zool. Abh 49: 131-147.
|
|
|
|
|
Wube T, Bekele A (2001). Habitat preference of the African grass rat, Arvicanthis dembeensis (Rodentia, Muridae), in Koka, Central Ethiopia. In Denys C, Granjon L, Poulet (eds.). Proceedings of the 8th African Small Mammals Symposium. Paris, France.
|
|
|
|
|
Yalden DW, Largen MJ (1992). The endemic mammals of Ethiopia. Mammal Rev 22:115-139.
Crossref
|
|
|
|
|
Yalden DW, Largen MJ, Kock D, Hillman JC (1996). Catalogue of the mammals of Ethiopia and Eritrea. Revised checklist, zoogeography and conservation. Trop J. Zool. 9:73-5.
Crossref
|
|
|
|
|
Yihune M, Bekele A (2012). Diversity, distribution and abundance of rodent community in the Afro-alpine habitats of Simien mountains National Park, Ethiopia. Int J. Zool. Res. 8:137-149.
Crossref
|
|


 where S = number of species, Pi = is the proportion of individuals of the total sample belonging to the ith species. H’ is influenced both by number of species as well as by evenness. Evenness (J) refers to how close in numbers each species in a habitat type. Evenness was calculated as,
  , where
  , S is the number of species and H’ is refers to Shannon-Wiener diversity index. This measure varies between 1 (complete evenness) and 0 (complete unevenness).
 , where S1 and S2 are the number of species occurring in each of the habitat type compared and C refers to the number of species occurring in both habitat types (Sørensen, 1948).


