ABSTRACT
This paper presents an analysis of the costs of protected areas (PAs) management in Ethiopia, specifically those managed by the Ethiopian Wildlife Conservation Authority. The authority is managing a network of protected area (PA) systems covering an area of about 29,950 km2. Primary and secondary data were used. A total of 3,045 rangers are required to effectively control illegal activities. The estimated number of rangers at basic level management ranges from 70 in Senkelle to 459 in Babile sanctuary with a mean (±SD) of 243.75 (± 6.52). The actual mean (±SD) patrol range covered by a single ranger is 53.2 (± 15.08), ranging from 1.22 km2 in Senkelle to 161.72 km2 per ranger in Geralle National Park. At basic level management the mean (±SD) patrol range covered by a single ranger is 8.81 (± 1.31), ranging from 0.8 km2 in Senkelle to 15.5 km2 in Halledighe. The total annual management cost was estimated between $10.5 million to $21.5 million. The mean (±S.D) annual expenditure for basic level management is $404.45/km2 (±164.32); ranging from $2333/km2 in Senkelle to $166/km2 in Halledighe. Cost Benefits Analysis showed the mean (±SD) return of investment was $129 (±41.42) for every $1 invested.
Key words: Budget, cost benefits analysis, management cost, protected area, rangers.
Protected areas (PAs) have been recognized as a successful management tool for halting the loss of biodiversity (Geldmann et al., 2018) and they have been significantly contributing in reducing the global loss of biodiversity. They are recognized across multiple international policy processes including the 2030 Agenda for Sustainable Development, the Convention on Biological Diversity (CBD) and the Ramsar Convention (UNEP-WCMC, IUCN and NGS, 2018). Establishing such a protected area system requires long-term political and financial commitments that go far beyond simply declaring new parks or expansion (Hockings et al., 2000).
However, the relationship between management inputs and biodiversity outcomes in numerous PAs remains weak (Geldmann et al., 2018). They have been deteriorated by funding shortfalls and inadequate investment (Lindsey et al., 2018; Bonham et al., 2014), which decreases management effectiveness (Leverington et al., 2010; Lindsey et al., 2018), in turn leading to poorer biodiversity outcomes (Geldmann et al., 2015; Geldmann et al., 2018).
James et al. (1999) and Balmford and Whitten (2003) described the level of financial investment required for biodiversity conservation as a “great bargain” in contrasting the required investment with the economic benefits generated from natural ecosystems. Estimating the cost of protecting biodiversity hot spot areas is essential for appropriate conservation planning and management, adequate fundraising and successful implementation of conservation strategies (Frazee et al., 2003; Craigie and Pressey, 2018). Also, understanding the costs for conservation action is central to designing effective and legitimate policies to maintain biodiversity for the global good. However, inadequate information on costs and costing techniques of natural ecosystems has resulted ineffective promotion of a basket full of “bargains” with no price tags by conservation practitioners (Frazee et al., 2003).
However, the global level of PA expenditure is not well documented, though often argued to be inadequate (McNeely et al., 1990; IUCN, UNEP, WWF, 1991). Hence, lack of robust information on financial requirement for effective PAs management has generated difficulties to undertake methodological funding estimation of PA system and setting up priorities for further foreign financial support. Similarly, there is lack of robust available information on requirement of financial inputs for effective management of PAs in Ethiopia, even if effective management greatly depends upon the adequacy of resources allocated to both federal and regional wildlife conservation areas. Largely, wildlife conservation efforts in the county have been constrained by several factors. Lack of sufficient financial resources for operational activities, infrastructure, staff training, community outreach, tourism development and research undertakings has hampered the wide range of activities for effective PAs management in Ethiopia.
According to Bruner et al. (2004), underfunding jeopardizes the ability of protected areas to safeguard biodiversity and the benefits that intact nature provides to society. Similarly, although Ethiopia is blessed with extraordinary wildlife resources and established a number of highly valuable PAs, the management effectiveness of these areas is inefficient due to low budgetary allocation where their size and the wildlife population are declining overtime. For instance, PAs management effectiveness assessment in Simien Mountains National Park (SMNP) and Bale Mountains National Park (BMNP, 2017) revealed an overall score of 51.5 and 57% respectively (AWF, 2018; BMNP, 2017).
In Ethiopia, even if there was no accurate records on PAs expenditures, data obtained since 1960’s shows that the annual expenditure on PAs in Ethiopia is extremely low. In 2009 funding requirement to bring the national PAs system to a functional “basic” level of operation and at “optimal” management was estimated between ETB69.5 million ($5.56 million) and 82.5m ($6.6 million) (EWCA SDPASE, 2009). This means annually between $168-215/km2 were needed to manage EWCA’s PAs covering an area of about 33, 500 km2 in 2009. However, the actual funding allocated during this year was about $1.2 million (personal communication). This indicates that the deficit amount was between $4.36 and $5.4 million. These estimates have excluded the cost of basic infrastructures development such as road, radio network, tourism facilities and cost of reducing human induced pressure on resources residing inhabitants in and around PAs. Moreover, Lindsey et al., 2018 have provided a generic estimate of about $1211/km2 required to effectively manage an estimated 48,500 km2 total range of lion in 17 PAs found in Ethiopia. In addition, Packer et al. (2013) reported the lowest minimum funding requirements for effective management of PAs was about $1967/km2.
More recently, the Ethiopian Wildlife Conservation Authority (EWCA) has been highly engaging in development of General Management Plan (GMP) to its PAs which incorporates business plan to each PAs with a goal of financial self-efficiency and donor dependency. Therefore, even if financial constraints are common problems in many conservation areas in Africa including in Ethiopia, information included in this study will help decision makers to reconsider the minimum finance required for more efficient and effective protected area management. Cowling and Pressey (2001) suggest that, accurate information on the conservation value of an area (that is its contribution to target achievement) and the costs of effectively managing it can help to facilitate the often difficult transition from planning to implementation by allowing scientists, managers, and politicians to evaluate trade-offs between biodiversity benefits and minimizing costs in the design of a reserve system. Therefore, this study aims to provide systematic, realistic and comprehensive analysis of cost of implementing conservation objectives in systematically selected PAs in Ethiopian with the following specific objectives:
(1) To determine the ranger’s numbers for effective resource protection undertakings in each Pas;
(2) To estimate the annual management costs required for basics and ideal level management in PAs of Ethiopia;
(3) To illustrate the extent in which PAs budget affect stated conservation objectives achievement (PAs management effectiveness);
(4) To compare the economic benefits and the current investment in Ethiopia’s PAs.
Study area
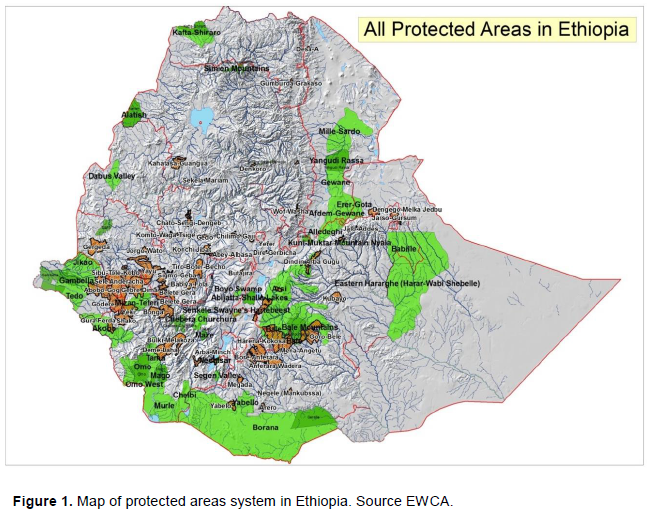
This study examines financial requirement of PAs managed by Ethiopian Wildlife Conservation Authority EWCA across the country. EWCA is in charge for the management of 13 Pas (11 National Parks and two Sanctuaries) covering a total area of about 29,950 km2 (2.7% of the total land mass of the country and 15% of the total protected area coverage in the country). The size of these protected areas range from 54 to 6882 km2 and they are directly managed by EWCA due to the fact that they harbor significant proportion of the biodiversity resources and highly characterized by endemic and endangered species occurrence (Figure 1). Other various PAs are managed by regional governments, community administrations and religious institutions is about 170,124 km2 (about14% of the total land mass of Ethiopia). The conservation authority has a total of 1231 staffs out of this 150 staffs are based in EWCA headquarter in Addis Ababa and 1081 staffs are posted to the various PAs. Out of the 1081 staffs posted in PAs 716 are rangers who are in the frontline to enforce the wildlife policy of the country.
Categories of protected areas cost
There are different components of PAs costs as different management actions require very different types of resource input. The costs can be categorized into three broad categories: These are recurrent management costs for existing areas, system wide expenses needed to support a network of protected areas, and costs of bringing new areas into the system (Bruner et al., 2004). Recurrent management costs include all operational costs (such as, staff salaries and training, fuel, maintenance, community engagement, as well as monitoring and evaluation), site-level administration, and development projects or recurrent compensation costs that are a direct responsibility of the protected area (Bruner et al., 2004).
However, in this study the cost of PAs was determined using the cost required to undertake effective regular patrolling/law enforcement and ecological monitoring on main indicator species in each PAs. Therefore, other essential expenses of recurrent costs are not computed in this study including cost of community engagement, staff salaries and training, tourism development, resettlement costs etc.
Bruner et al. (2004) noted management objective, accessibility and size are recognized as the major dynamics and factors to influence management costs of PAs. Since, different management objectives require widely different set of activities and expenditures thus management objectives can greatly influence costs. Accessibility of areas directly determines the level of pressure faced by a PA, with more threat generally requiring more investment (Wilkie et al., 2001). Size of PAs has variable effect in management costs but generally cost decreases rapidly as the size of a PA increases (Balmford and Whitten, 2003; Frazee et al., 2003), perhaps because of economies of scale in management, a greater area protected by inaccessibility, fewer impacts from edge effects and greater likelihood of larger areas being ecologically self-, sustaining (Gaston et al., 2008).
Data collection
Primary and secondary data were collected to determine financial requirement of protected area’s effective management. Primary data was collected from chief PA managers of all 13 PAs, 21 ecological monitoring wardens and chief rangers from 13 PAs using semi-structured questionnaire. In addition, Key Informant Interviews were made with senior EWCA HQ staffs to identify their own needs for effective protected area management from January to February 2020. Sample respondents were selected purposively to have more robust information and better understanding about the needs of protected area management.
Secondary data collected from various literatures and financial records were examined to determine the recent investments made by government and conservation partners on PAs including records contained relevant data on operational and physical infrastructure spending. However, due to lack of proper monitoring and evaluation undertakings in target PAs, the available data did not contain robust information on which management actions were being completed with the allocated resources. In addition, we used Van Zyl (2015) study to calculate cost benefit analysis of PAs.
Since, PAs are highly heterogeneous, with respect to physical and biological characteristics and landscape contexts, the management costs are highly influenced by wide ranges of characteristics such as size of PAs, shape, staffing level, visitation levels, endemic and endangered species presence, critical ecosystems, anthropogenic pressure and threat severity. However, for this study we computed protected area size and number of rangers to determine management costs of PAs. We have also assessed the General Management Plan of PAs to compare the proposed budget requirements for the implementation of outlined management actions. In addition, a variety of previously studied literatures on PAs management cost were assessed to determine the standard cost of PAs or species management at basic level.
Data analysis
The collected data were entered and organized into an excel spreadsheet for statistical analysis to examine the total numbers of rangers and level of patrolling range to be covered by an individual ranger in each PAs at basic level management. The cost of patrolling was estimated using records of previous patrolling cost. We used linear regression analysis to explore the relationships between total patrolling expenditure per sq. km (response variable) and PAs patrolling unit (explanatory variable).
Limitation of the study
The study is conducted only in federally managed PAs of Ethiopia which accounts only about 15% of the total protected landscape in the country. Lack of robust financial and human resource records at regional PAs have put significant restriction to this study. Therefore, the estimated funding requirement is only for PAs managed by EWCA, does not present the entire required financial and human resources for conservation undertakings in Ethiopia.
Estimating PAs rangers number
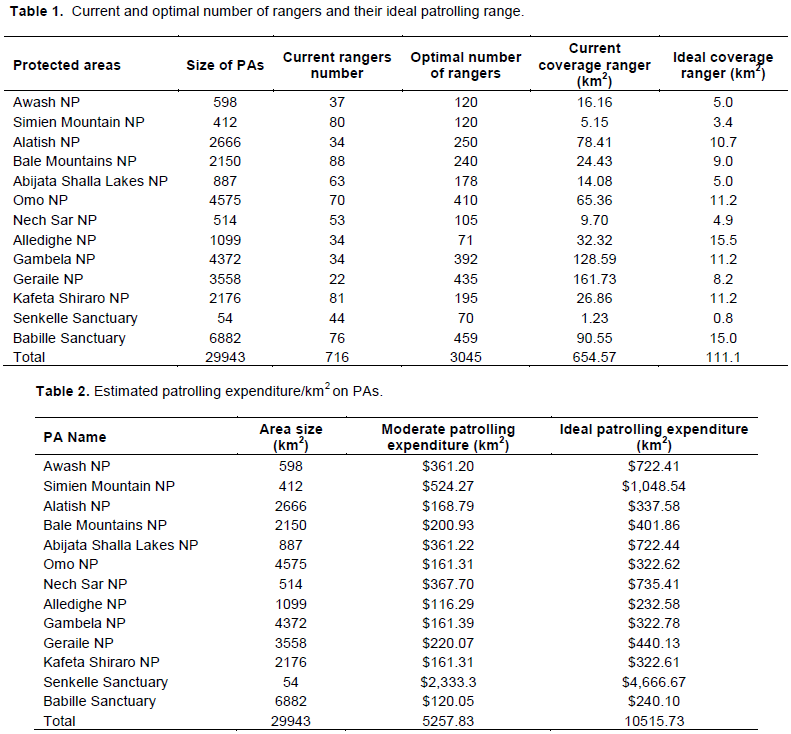
Although the number of rangers varies greatly from one area to another area, a total of 716 rangers are employed currently by EWCA to carry out patrolling endeavors in its PAs system. The number of rangers varies from 22 in Geralle National Park to 88 in Bale Mountains National Park (BMNP, 2017). The mean number of rangers is 56.58. The required numbers of rangers at basic level management is highly varied from the current number with a total of 3045 rangers are required to effectively control illegal activities in EWCA managed PAs. At basic level management, the estimated numbers of rangers ranges is from 70 in Senkelle to 459 in Babile sanctuary with a mean (±SD) number of rangers 243.75 (± 6.52). The result revealed that, a shortfall of 2,329 rangers to undertake effective resource protection of PAs. The present number only meets 23.5% of the required numbers of rangers. The mean (±SD) patrol range covered by a single ranger is 53.2 (± 15.08), ranging from 1.22 km2 in Senkelle to 161.72 km2 per ranger in Geralle National Park. While, at basic level management the mean (±SD) patrol range covered by a single ranger is 8.81 (± 1.31), ranging from 0.8 km2 in Senkelle to 15.5 km2 in Halledighe proposed National Park (Table 1).
Estimating annual management costs
Across the 13 PAs, the total expenditure on patrolling was about $424,047 (65.5% of total budget) in 2018/19. The mean annual expenditure was about $14.16/km2, where Senkelle Sanctuary had the highest annual expenditure ($433/km2), followed by Nech Sar ($78/km2) and Simien Mountains National Park ($73/km2). The lowest annual expenditure was observed in Babile sanctuary, Omo and Gambella National Parks with $5.24, $6.69 and $7.16/km2, respectively. The annual expenditure per ranger was $593/ranger in which Geralle had the highest annual expenditures $1424/ranger, followed by Halledighe and Awash National Parks, $1123/ranger and $950/ranger, respectively. The lowest expenditure was made in Kafta Shiraro ($382/ranger), Simien Mountains ($376/ranger) and Bale Mountains National Parks ($371/ranger). In addition, there were strong relationships between expenditure per km. square and PAs size. In the multiple regression that included all explanatory variables (Adjusted R2 = 0.853; F=65.02; d.f. =11, P<0.001).
The data obtained from PAs managers were analyzed to calculate the required expenditure for effective patrolling undertakings in their respective PAs. The overall annual estimated costs for basic to ideal level patrolling endeavors range between $5,481,000 and $10,962,000. The estimated mean (±S.D) annual expenditure for basic level management is $404.45/km2 (±164.32); it ranges from $2333/km2 in Senkelle to $166/km2 in Halledighe; whereas the mean (±S.D) annual expenditure for ideal level management is $809/km2 (±328.6) ranging from $4667/km2 in Senkelle to $233/km2 in Halledighe. The annual estimated cost per ranger ranges from $1800/ranger to $3600/ranger.
This survey revealed also that, the current conservation efforts have resulted in partial achievement of stated conservation objectives of PAs due to limited financial resources hampering holistic conservation endeavors. In 2018/2019, about 65.5% of total budget was spent for patrolling endeavors. Therefore, other management programs of PAs such as tourism development, infrastructure development, and ecological research and administration undertakings have accounted only 34.5%, even if such activities are as equally as or much needed activities in protected areas not that much developed. As more investment is undertaken to address other programs, the burden on resource protection is expected to reduce. Thus, the patrolling budget was assumed to reduce to 50% or less. Based on this, assumption the total annual management cost of PAs was estimated from $10,962,000 to $21,924,000 (Table 2).
Comparison of conservation costs to benefits
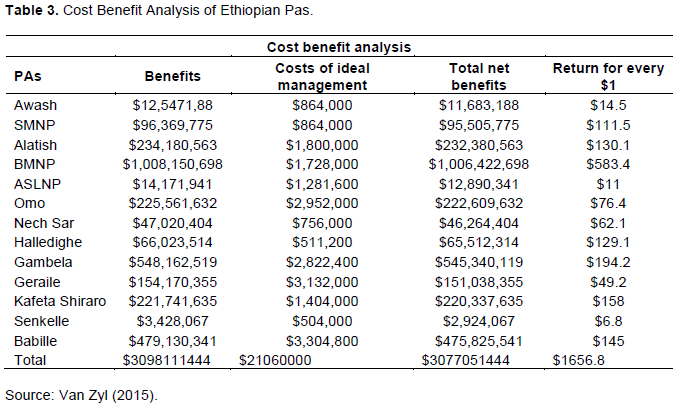
The Cost Benefit Analysis (CBA) was calculated based on the previous work by Van Zyl (2015) on economic valuation assessment and the estimated management cost of ideal level management of PAs. Accordingly, the result showed that, the mean return of investment is about $129 for every $1 invested. BMNP has the highest return on investment of $583 for every $1. Gambella and Kafta Shiraro National Parks have a return of $194 and $157 for every $1 invested whereas Senkelle, Abjiata Shalla and Awash National Parks are providing the lowest return of only $6, $11 and $14 for $1 invested, respectively (Table 3).
Several assessments have been made on PA financial shortfalls and costs required to effectively manage biodiversity hotspot areas. In 1984, Bell and Clark (1984) published a useful generic estimate of the cost of effective conservation in Africa’s PAs of US$200 per km2 annually. Leader-Williams and Albon (1988) have made a basic estimate of conservation cost of two iconic large mammals of Africa (African elephants and Rhino). The study has confirmed that inadequate funding has been allocated for PAs to manage these two species. Martin (1993) noted that five African countries had annual spending less than US$5/km2 with only two of the 14 countries surveyed spending over US$100/km2 annually. Another worse insufficient funding was reported by Dublin et al. (1995) below US$5/km2 annually was being spent on law enforcement activities in three-quarters of the African countries in 1993.
The global reviews of PAs and biodiversity conservation assessment made by World Conservation Monitoring Center (WCMC) (James et al., 1999), has provided remarkable information on financial shortfalls to manage PAs. The study revealed that annual expenditure on PAs in many developing countries is extremely low, spending less than ten dollars per square kilometers in some countries in Africa. The study revealed the lowest PA budgets of less than US$1 per km2 per year were recorded in Angola, Laos and Cambodia. Budgets in 32 countries were below US$100/km², and below US$10/km² in 13 countries including Ethiopia, spending US $5/km² while regional expenditure (South and East Africa) was US$257/km². Further the study also estimated a total budget shortfall for PAs in South of the Sahara as US$446,061,174.
The work of Wilkie et al. (2001) in the Congo Basin has showed significant in adequate funding of PAs that has resulted in unsuccessful management of PAs in the Congo Basin. The study boot out that the capital costs alone to set up or renovate the infrastructure of all PAs were likely to exceed US$200 million. However, the national and donor expenditures on the present PA network are probably less than US$10 million per year. The study made by Culverwell (1997), in all PAs of Cameroon have been widely quoted in many reviews as the study assessed the entire PAs system in the country and all aspects of PA management were addressed. Estimates were made of the “ideal” recurrent costs of the PA system by site-specific estimations of administration (including salary adjustments to recommended levels), vehicles, equipment, maintenance and monitoring costs. The study showed that the total “ideal” recurrent costs of the existing PA system totaled CFA 832 million (approximately US$1.6 million in 1996), which in 1996 gave a shortfall of approximately US$1,243,000.
Frazee (2001) and Frazee et al. (2003) extended this type of analysis by examining the cost of implementing an expansion of PAs to achieve conservation targets related to a specific hotspot, namely the Cape Floristic Region. Assuming a 20-year implementation horizon, it was estimated that an expenditure of US$45.6 million a year would be required to develop a representative PA network within the hotspot, while the annual costs of maintaining the network into perpetuity was estimated at US$24.4 million. More recently, Lindsey et al. (2018) estimated minimum funding requirement for effective management of African PAs with lions. The study revealed that PAs require circa $1,000 to 2,000/km2 for effective lion conservation.
Law enforcement unit staffing level
According to José (2009), patrolling standard, the area supposed to be covered by a ranger was 10km2 and 5km2 at basic level and optimal level of management, respectively. Considering the above patrolling standard, the current mean (±) coverage in Ethiopia’s protected areas included in this study is 55.07 (± 6.19) is far behind from the standard set. However, the estimated ideal coverage for optimal level 8.81 (± 1.31) is fulfill the standard. Intensive patrolling affects the overall management of PAs where increasing wildlife patrol improved reserve management as well as reduced other illegal human activities in some PAs in Ghana (Jachmann, 2008).
On top of that, Calfucura and Benavides (2016) reported on the association of number of rangers with PA size, tourism impact, threat severity (priority, threatened species and ecosystems), operational difficulties (distance from the PA to national capital). Since the PAs are heterogeneous objectivity influenced by the dynamics mentioned above. Therefore, patrolling standard varies based on topography and location. Funding, management and associated staffing requirements of individual PAs varies according to factors such as local geographical features, shape, climate, cultural context, species living in the area, adjacent land uses, and populations (IUCN ESARO, 2020).
It is obvious that, small PAs usually cost more to manage per unit area than larger PAs, owing to management complexity and economies of scale (Frazee et al., 2003). Similarly, comparable results were observed, as small PAs such as Senkelle (0.8 km2/ranger), SMNP (3.4 km2/ranger), Nech Sar (4.9 km2/ranger), ASLNP and Awash National Parks (5 km2/ranger) have required more numbers of rangers and low patrolling ranges. This might be due to the presence of high anthropogenic pressure as the PAs are located in proximate location to urban areas (Tewodros and Afework, 2013; Solomon Belay et al., 2014). While larger and remote areas have required less numbers of rangers and have high patrolling range Halledighe (15.5 km2/ranger), Bablie (15 km2/ranger), Omo, Gambella and Kafta Shiraro National Parks (11.2 km2/ranger) and Alitash National Park (10.7 km2/ranger). These might be because of the less topographic variation, low population density and the areas are characterized by open savannah grassland which advantaged to patrol larger areas from distance.
Although the analysis of a range of law enforcement inputs were not included, José (2009) has suggested basic law enforcement inputs such as infrastructure (outpost/entrance gate and satellite ranger station (one per high pressure zone), and ranger base (one per PA), and vehicle (one per 6 person per site) are recommend as a standard for basic level management of PAs. The study also greatly recommends basic tourism facilities such as, visitor center, camping grounds, trekking routes, picnic sites and signage for high quality tourism experience in specific prime tourism destinations. The study suggests developing a security post or entrance gate in every high pressure zone of PAs. The review of previous expenditure revealed the budget requirement for fuel/transportation and maintenance is leveling about 25% of the total cost of patrolling activity and the EWCA staff costs constitute about 30% of the total budget (IUCN ESARO, 2020 and personal observations).
In many East and Southern Africa (ESA), PA management authorities expenditures of show that, majority of funding are on operating costs such as staff, marketing, maintenance, trainings, consumables, consulting and audit fees, and insurance, with very few investments into capital expenditures or capacity building (IUCN ESARO, 2020).
Annual management costs
PAs overall management cost is highly influenced by several physical and biological attributes including size, shape, surrounding land cover, vegetation types and others (ref). In addition, due to PAs location in diverse physical, social, and economic environments, management budgets allocated to a highly heterogeneous range of actions that differ in relative importance between management units and over time. Though small PAs have greater cost per unit area, PAs size has significant influence on management cost. Shape of PAs (perimeter to area ratio) of PAs influence management requirements, the more irregular and complex shapes have greater management cost. The cost in the SMNP is expected to be greater as its irregular shapes disadvantaged management interventions. Management requirements and hence management cost are influenced by the mix of vegetation types. A habitat management undertaking (invasive and alien species management, rehabilitation of principal ecosystems) requires more costs. The vicinity land use scheme has considerable impact on management cost of PAs. The current estimate was made analyzing numbers of PAs rangers. The PAs expenditure analysis has revealed, patrolling undertakings had used about 65.5% of the annual budget of all PAs.
Although, the overall annual estimates of $10,962,000 to $21,924,000 does not include the expenditure for range of key management actions such as infrastructure development, supply of equipment, research, cost of household relocation and alternative livelihoods development plans to replace unsustainable practices in PAs, the estimates provided significant inputs for PA staff training and community engagement activities. The current funding shortage to PAs at basic ideal level management ranges from $10,313,063 to $21,275,063. This might have created an obstacle for the effective and efficient management of PAs and their wildlife population.
The EWCA has received annual budget of ETB 120 million (US$4.5 million) to manage its PAs in 2018/19 fiscal year, but PAs have received less amount due to lack of expertise and skills to function operation at site level. The budget allocation has also shown significant growth over years; but PAs are yet underfunded. On top of that, the allocated budget remains inadequate for basic management needs and presents serious constraints for PAs management. In 2009/2010 fiscal year the allocated budget was ETB16.1 million ($1.34 million) for conservation undertaking by EWCA. Conversely, the estimated funding requirement to bring the national PAs system to a functional “basic” level of operation was estimated ETB64.4 million ($5.12 million) and optimal level was ETB84.4 million ($6.55million) (EWCA SDPASE, 2009). Thus, estimated annual cost ranges from $168 to 215/km2 to manage EWCA’s PAs covering an area of about 30,500 km2 (the current size is 29,950 km2 some PAs are downsized). The deficit of funding gap was between ETB69.5 million ($5.56 million) and 82.5m ($6.6 million) during the study period (EWCA SDPASE, 2009).
Lindsey et al. (2018) have provided a generic estimate of about $1211/km2 required to effectively manage an estimated 50,500 km2 total range of lion in 17 PAs found in Ethiopia. Packer et al. (2013) have also estimated the lowest minimum funding requirements for effective management of PAs including Ethiopia’s PAs with $1967/km2 in 2013. Since the budget provided by the government is not adequate for operations and management; thus, is supplemented by donor funding (IUCN ESARO, 2020). EWCA has some significant foreign aid for conservation and management improvement of its PAs. The Global Environment Facility (GEF6) and the German Development Bank (KfW) are implementing their programs in selected PAs providing about US$ 3.5 and US$ 23.5 million respectively. According to Jachmann (2008), the success of the Luangwa Integrated Resource Development Project is due largely to a steep rise in overall law-enforcement budget, an increase in man-power, the introduction of investigation operations and the bonus system. Therefore, by bearing in mind on the value budgetary finance and man power for effective management of protected areas EWCA should reconsider the budgeary and human resource requirements of protected areas at least to the minimum or basic level.
Community engagements undertakings might need further financial inputs and the numbers of kebeles and woredas neighboring PAs determine the expenditure. As the PAs establishment proclamation suggests the formation of Park Advisory Committee (PAC) in comprises neighboring woredas and kebeles and PAC meeting/workshop suggested to be conducted regularly in quarterly basic. Therefore, four PAC meetings/ workshops will be conducted per year require vast financial resources.
Conservation costs vs. benefits
The economic value EWCA PAs system was estimated about $325 billion per annum (Van Zyl, 2015). Watershed protection service, harvesting of natural products and grazing have accounted the larger portion 42, 21 and 18% respectively. The value associated with tourism estimated about $25.2 million per year only 8% of the total estimated values (Van Zyl, 2015). However, nature tourist’s total expenditure in Ethiopia was estimated about $58.5 million in 2015/2016 (Simeneh, 2020). The assessment revealed that, the BMNP only roughly providing over $1 billion per annum which is leveling about 9.5% of the country’s budget in the 2017/2018 fiscal year.
In addition a number of environmental services of Ethiopian PAs system have been assessed in 2009 including hydrological services, electric power generation, medicinal plants, carbon sequestration and the biodiversity. The assessment provided remarkable figures of some selected services hydrological services valued $432 million, electric power generation valued $28 million, medicinal plants valued $13 million, carbon sequestration valued $938 million or $19 million per annum and the value of biodiversity estimated to be $3.75 to 112 million per annum (EWCA SDPASE, 2009).
Environmental changes as a result of degradation of natural areas have drastically affected ecosystems’ ability to provide ecosystem services. Van Zyl (2015) noted within 20 years, the total value of the EWCA PAs system would decrease from its current value of approximately ETB6.5 billion/yr to a net value of ETB3.7 billion/yr (US$185 million) due to dramatic destruction and conversion of natural ecosystems which has impact on species resulting loss of habitat and disturb the overall ecosystem function.
CONCLUSIONS AND RECOMMENDATION
The current funding gap (excluding foreign aid) was estimated between $10.3 ($344/km2) to 21.3 million ($710/km2) annually. Indicating that there is a huge deficit comparing the economic value of these PAs and actual. Apart from foreign conservation aid requisite, sustainable tourism and other related funding opportunities are very crucial to lessening the current funding gaps. Therefore it is essential to develop feasible conservation business tools to strategically tackle financial constraints for biodiversity conservation. The survey revealed the current conservation efforts that have resulted in partial achievement of stated conservation objectives as a result of limitation in financial resources for holistic conservation endeavors. Severe illegal activities are occurring in and adjacent lands of PAs in Ethiopia. Therefore, PA managers are forced to use about 65.5% of total budget for resource protection endeavors. Recent studies on illegal wildlife trade (IWT) revealed, IWT being recognized as a major threat to the survival of many endangered species across Africa. The Horn of Africa is the newly emerging hub of illegal wildlife products and also trafficking of live animals. Reports show that Ethiopia is also seen as a transit route for ivory and other illicit wildlife products from other East African countries with Bole International Airport. As a result, Ethiopia scored 40% on the “Elephant Trade Information System” for patrolling in 2012, (Nowell, 2012). Therefore, strengthen patrolling undertakings is vital to control illegal activities on wildlife resources.
Like many countries in Africa PAs and surrounding communities highly rely on tourism to generate income. However, all forms of tourism, including photographic tourism and trophy hunting are extremely vulnerable to social-economic uncertainty, environmental disaster, health crisis and political instability. Therefore, it is important to work on new and innovative revenue models that do not depend on tourism, but enhance PAs and local communities’ income from wildlife and improve the sustainable management of natural resources and humans wellbeing.
It is very essential to undertake comprehensive assessment of financial and human resource requirement in all PAs of Ethiopia. The following principal recommendations can assist to increase funding opportunities. First, it is very essential to enhance PAs operational efficiency to undertake operations in the most cost-effective method while high quality of its outcome is still ensured. Second, optimising income generation opportunities in line with the legal framework of the sustainability, existence and management of PAs are highly needed. The following income generation opportunities can be considered but not limited to these alternatives:
(i) Tourism Revenue Retention Scheme: tourism in PAs has been considered as a novel tool to generate significant income for many PAs in Africa. Likewise, some PAs of EWCA are generating significant revenue from nature tourism including SMNP, BMNP, Nech Sar, Awash, and Abjita Shalla Lakes National Parks. In essence revenues from these PAs goes to offset budgets for other PAs that are not able to generate significant revenues. Therefore, it is a wise investment to significantly invest on a ‘cash cow’ PAs operational budget to enable them to generate more revenue.
(ii) Payment for Ecosystem Services: Ethiopian PAs are providing extraordinary benefits. The total ecosystem services provision of EWCA managed PAs was estimated $325 million per annum. Thus, it is very essential to establish pragmatic PES model to support biodiversity conservation efforts in Ethiopia.
(iii) Trust fund: trust funds have proven to be a successful
means of funding in many developing countries including
Uganda, Tanzania, and Malawi. It is likely that such a fund will be vital to meet the financial needs of EWCA. The fund has the potential to provide supplementary support additional to governmental resources, particularly
under the current budget shortfalls and short-term budget cycles.
(iv) Biodiversity offsets: biodiversity offsets is vital to compensate for the net impact of development projects after the mitigation measures have been implemented. However, such offsets should be negotiated during the environmental impact assessment study of projects to avoid funding controversies after projects are completed.
The authors have not declared any conflict of interests.
REFERENCES
|
African Wildlife Foundation (AWF) (2018). Management Effectiveness Assessment in the Simien Mountains National Park, Ethiopia. Final report for adaptive management implication in protected areas systems of Ethiopia.
|
|
|
|
Bale Mountains National Park (BMNP) (2017). A ten year General Management Plan 2017 - 2027. Compiled and edited by the Ethiopian Wildlife Conservation Authority with the assistance of Frankfurt Zoological Society. Addis Ababa, Ethiopia.
|
|
|
|
|
Balmford A, Whitten T (2003). Who should pay for tropical conservation, and how could the costs be met?. Oryx 37(2):238-250.
Crossref
|
|
|
|
|
Bell RHV, Clarke J (1984). Funding and financial control. In: Bell RHV, McShane-Caluzi E (eds.), Conservation and wildlife management in Africa. Office of the Peace Corps, Washington.
|
|
|
|
|
Bonham C, Steininger MK, McGreevey M, Stone C, Wright T, Cano C (2014). Conservation trust funds, protected area management effectiveness and conservation outcomes: lessons from the Global Conservation Fund. Parks 20:89-100.
Crossref
|
|
|
|
|
Bruner AG, Gullison RE, Balmford A (2004). Financial costs and shortfalls of managing and expanding protected-area systems in developing countries. BioScience 54(12):1119-1126.
Crossref
|
|
|
|
|
Calfucura E, Benavides FE (2016). Using benefits and costs estimations to manage conservation: Chile's protected areas. Available at:
View
|
|
|
|
|
Cowling RM, Pressey RL (2001). Rapid plant diversification: planning for an evolutionary future. Proceedings of the National Academy of Sciences 98(10):5452-5457.
Crossref
|
|
|
|
|
Craigie ID, Pressey RL (2018). Towards a better understanding of protected-area management costs (No. e26576v1). Peer Journal Preprints.
Crossref
|
|
|
|
|
Culverwell J (1997). Long-term recurrent costs of PA management in Cameroon. WWF Cameroon/MINEF, Yaoundé.
|
|
|
|
|
Dublin HT, Milliken T, Barnes RFW (1995). Four years after the CITES ban: illegal killing of elephants, ivory trade and stockpiles. IUCN, Switzerland.
|
|
|
|
|
Ethiopian Wildlife Conservation Authority Sustainable Development of the PAs System of Ethiopia (2009). Assessment of the Value of the PA system of Ethiopia, "Making the Economic Case" Volume II MAIN REPORT. Addis Ababa, Ethiopia. Available at:
View
|
|
|
|
|
Frazee SR (2001). Estimating the costs of conserving a biodiversity hotspot: a case study of the Cape Floristic Region, South Africa. M.Sc. thesis, University of Cape Town, South Africa.
|
|
|
|
|
Frazee SR, Cowling RM, Pressey RL, Turpie JK, Lindenberg N (2003). Estimating the costs of conserving a biodiversity hotspot: a case study of the Cape Floristic Region, South Africa. Biological Conservation 112:275-290.
|
|
|
|
|
Gaston KJ, Jackson SF, Cantú-Salazar L, Cruz-Piñón G (2008). The Ecological Performance of Protected Areas. Annual Review of Ecology Evolution and Systematics 39:93-113.
Crossref
|
|
|
|
|
Geldmann J, Coad L, Barnes M, Craigie ID, Hockings M, Knights K, Leverington F, Cuadros IC, Zamora C, Woodley S, Burgess ND (2015). Changes in protected area management effectiveness over time: A global analysis. Biological Conservation 191:692-699.
|
|
|
|
|
Geldmann J, Coad L, Barnes MD, Craigie ID, Woodley S, Balmford A, Brooks TM, Hockings M, Knights K, Mascia MB, McRae L (2018). A global analysis of management capacity and ecological outcomes in terrestrial protected areas. Conservation Letters 11(3):e12434.
Crossref
|
|
|
|
|
Hockings M, Stolton S, Dudley N (2000). Evaluating effectiveness: a framework for assessing the management of protected areas (No. 6). IUCN.
|
|
|
|
|
IUCN ESARO (2020). Closing the gap. The financing and resourcing of protected and conserved areas in Eastern and Southern Africa. Nairobi, Kenya.
|
|
|
|
|
IUCN, UNEP, WWF (1991). Caring for the Earth. A Strategy for Sustainable Living. IUCN, Switzerland.
|
|
|
|
|
Jachmann H (2008). Monitoring law-enforcement performance in nine protected areas in Ghana. Biological Conservation 141(1):89-99.
Crossref
|
|
|
|
|
James A, Green M, Paine J (1999). A global review of protected Area budgets and staff. World Conservation Monitoring Centre, Cambridge.
|
|
|
|
|
José G (2009). Sustainable Financing Plan for Jamaica's System of PAs (2010-2020). Kingston, Jamaica. Available at:
View
|
|
|
|
|
Krug W (2001). Private supply of protected land in southern Africa: a review of markets, approaches, barriers and issues. In Workshop Paper, World Bank/OECD International Workshop on Market Creation for Biodiversity Products and Services, Paris (Vol. 25).
|
|
|
|
|
Leader-Williams N, Albon SD (1988). Allocation of resources for conservation. Nature 336:533-535.
Crossref
|
|
|
|
|
Leverington F, Costa KL, Pavese H, Lisle A, Hockings M (2010). A global analysis of protected area management effectiveness. Environmental management 46(5):685-698.
Crossref
|
|
|
|
|
Lindsey PA, Miller JR, Petracca LS, Coad L, Dickman AJ, Fitzgerald KH, Flyman MV, Funston PJ, Henschel P, Kasiki S, Knights K (2018). More than $1 billion needed annually to secure Africa's protected areas with lions. Proceedings of the National Academy of Sciences 115(45):E10788-E10796.
Crossref
|
|
|
|
|
Martin RB (1993). Should wildlife pay its way? Department of National Parks and Wildlife. Perth, Australia.
|
|
|
|
|
McNeely JA, Miller KR, Reid WV, Mittermeier RA, Werner TB (1990). Conserving the world's biological diversity. International Union for conservation of nature and natural resources.
|
|
|
|
|
Nowell K (2012). Wildlife crime scorecard: assessing compliance with and enforcement of CITES commitments for tigers, rhinos and elephants. World Wildlife Fund.
|
|
|
|
|
Packer C, Loveridge A, Canney S, Caro T, Garnett ST, Pfeifer M, Zander KK, Swanson A, MacNulty D, Balme G, Bauer H (2013). Conserving large carnivores: dollars and fence. Ecology Letters 16(5):635-641.
Crossref
|
|
|
|
|
Simeneh A (2020). Ecotourism as a tool to substantially funding conservation endeavors in Ethiopia. Tourism and Hospitality 9:432.
|
|
|
|
|
Solomon B, Aklilu A, Eyualem A (2014). Land Use and Land Cover Changes in Awash National Park, Ethiopia: Impact of Decentralization on the Use and Management of Resources. Open Journal of Ecology 2014(4):950-960.
Crossref
|
|
|
|
|
Tewodros K, Afework B (2013). Human-Wildlife Conflict in Senkele Swayne's Hartebeest Sanctuary, Ethiopia. Experimental Biology and Agricultural Sciences 2013(1):1.
|
|
|
|
|
UNEP-WCMC, IUCN, NGS (2018). Protected Planet Report 2018. UNEP-WCMC, IUCN and NGS. Cambridge UK; Gland, Switzerland; and Washington, D.C, USA.
|
|
|
|
|
Van Zyl H (2015). The Economic Value and Potential of PAs in Ethiopia. Report prepared by Dr Hugo van Zyl, Independent Economic Researchers, for The Sustainable Development of the PAs System of Ethiopia (SDPASE) project and the Ethiopian Wildlife Conservation Authority (EWCA). Addis Ababa, Ethiopia.
|
|
|
|
|
Wilkie DS, Carpenter JF, Zhang Q (2001). The under-financing of PAs in the Congo Basin: so many parks and so little willingness-to-pay. Biodiversity and Conservation 10:691-709.
Crossref
|
|