ABSTRACT
Human-wildlife conflicts (HWC) can cause substantial losses. Compensation for such losses is essential to foster positive community attitudes toward wildlife conservation. Monetary compensation for the loss of human life, injury, crop and property damage, or livestock depredation by wildlife is a common strategy for mitigating HWC. We analyzed inter-specific, spatial, inter-annual and seasonal variation in human-wildlife conflicts, conflict outcome and the associated monetary costs of compensation in Kenya during 2007-2016. A total of 18,794 compensation claims were filed with the Kenya National Compensation Scheme (KNCS) during 2007 - 2016. Snakes made the greatest contribution to the total cases (44.8%,  = 8,423), human fatalities (43.1%, = 614) and human injuries (76.9%, = 7,772). Elephant was the second leading conflict species (22.3%, = 4,181) and was responsible for 18.8% ( = 266) of human deaths and over 75% of crop and property damage. Spotted hyena, leopard and lion caused 85% of livestock predation cases. The intensity and outcome of conflicts varied across counties such that most human fatalities occurred in arid Tana River and Wajir counties, whereas most human injuries occurred in Kitui and Wajir counties. The intensity of conflicts was strongly influenced by the agro-climatic potential and percentage of a county under protection, rainfall and temperature and their interactions. In consequence, crop damage was highest in counties with high agricultural potential (Meru and Taita Taveta) but livestock predation was highest in counties with large protected areas (Samburu and Taita Taveta). Human fatality and injury were higher among males than females and adults than children. Over the 10-year period, the Kenya Government spent about 3 billion Kenya shillings on compensation of about 30% of all filed claims. Compensation schemes require sustainable funding mechanisms and effective administration to minimize negative unintended consequences.
Key words: Human-wildlife conflicts, compensation, snake bites, attack on humans, livestock predation, crop raiding, rainfall, temperature, human population growth.
Human-wildlife conflicts (HWC) cause considerable losses to many communities, the compensation for which makes wildlife conservation an expensive undertaking globally (Nyhus et al., 2005; Ravenelle and Nyhus, 2017).
The four main conflict types are, attack on human, livestock depredation, crop raiding, and property destruction (Conover, 2001; Messmer, 2000). Attack on humans can result in different outcomes ranging from death, injury, and general insecurity. Livestock depredation is attack on domesticated animals such as cattle, donkeys, sheep, goats, and poultry. Crop raiding varies; however it leads to destruction of farmed crops for human consumption, while property damage could be damage to fences, water pipes, and houses (Distefano, 2005; Messmer, 2009). Occurrence of HWC is attributed to a number of factors including but not limited to the following: exponential human population growth, land use change that results in habitat loss, degradation and fragmentation, climatic change, and livestock and wildlife population increase (Distefano, 2005; Thirgood et al., 2005). These factors reduce food, water and other resources that wildlife requires for survival, increase competition and therefore HWC occurrences.
Thus, compensation is a monetary payment (Distefano, 2005; Woodroffe et al., 2005; Tveraa et al., 2014) used by governments and conservation organizations to appease communities that live with wildlife when people are killed, injured or lose property to wild animals (Madhusudan, 2003). Access to compensation is critical to ensure that communities that bear the brunt of HWC continue to support wildlife conservation. As a result, such payments can constitute a significant expenditure portfolio for governments or conservation organizations (Nemtzov, 2003; Treves et al., 2006; Karanthet al., 2018). Unsurpisingly, most compensation schemes (88%) have been ex-post and instituted mostly in Europe and North America, with very few in Africa (Ravenelle and Nyhus, 2017). This is because compensation is costly and competes with other state priorities for limited revenues in developing countries. Even so, it is often presumed that implementing compensation programs should be easier and cheaper in rural areas of developing countries where people are generally poor (Bulte and Rondeau, 2007). Yet, experience shows that compensation for losses arising from HWC can be both difficult and expensive to implement, even among poor rural communities in developing countries. For example, a carnivore protection program operated by the Friends of Nairobi National Park (FoNNP) made consolation payments to families that lost their livestock. This was done to prevent retaliatory killings of carnivores in the Athi-Kaputiei Ecosystem, encompassing the Nairobi National Park in Kenya, from 2000 to 2012 (Lesilau et al., 2018; Ogutu et al., 2013; Mutuga, 2009), but stopped operating due to financial constraints. However, two other community-based compensation schemes, the Mbirikani Predator Compensation Fund (Hazzah et al., 2014; Maclennan et al., 2009) and the Maasai Wilderness Conservation Trust (Bauer et al., 2017) have been making similar payments to reduce retributive killings of lions (Panthera leo) in the Amboseli-Tsavo West Ecosystem of Kenya since 2003. However, both programmes focus solely on livestock depredation and cover relatively small areas and the conservation trust program focuses only on the lion. More precisely, the Maasai Wilderness Conservation Trust that started in 2010 is funded by conservation fees, covers only 1,133 km2 and supports about 17,000 people (Bauer et al., 2017). The Mbirikani programme started earlier in 2003 is funded by conservation non-governmental organizations, covers 1,229 km2 and caters for about 10,000 people (Groom, 2007; Maclennan et al., 2009).
Compensation can increase tolerance of wildlife by communities, leading to peaceful co-existence between humans and wildlife, but not necessarily always (Maclennan et al., 2009; Karanth et al., 2018). For instance, in India, compensation is faulted as failing because of focusing on charismatic animals and ignoring conflicts caused by other species (Johnson et al., 2018). Thus, reducing retaliatory killings of wildlife should be a key priority of sustainable biodiversity conservation. To this end, many compensation schemes have been established worldwide. But, many compensation schemes often focus on single wildlife species that are of conservation concern (threatened), such as the Indian tiger (Panthera tigris) (Karanth et al., 2012), or the African lion (Maclennan et al., 2009), and hardly on multiple species. This is a major shortcoming of most schemes because multiple species often contribute to human-wildlife conflicts, therefore focusing on a single species and overlooking others is not advisable. Hence, a compensation scheme that targets a specific wild animal species ignores others which can result in less attention, persecution killings and decline in species population or extinction.
Whereas compensation has long been practiced in many countries, including USA (Treves et al., 2006), India (Karanth et al., 2018), Sweden (Zabel and Holm-müller, 2008), Norway (Swenson and Andrén, 2005) and Israel (Nemtzov, 2003), relatively few studies have thus far evaluated the performance of National Compensation Schemes such as the Kenyan National Compensation Scheme (KNCS). However, such an evaluation can furnish valuable feedback and insights for improving the effectiveness of decision making in sustainable biodiversity conservation. Moreover, evaluating National Compensation Schemes (NCS) that target multiple wildlife species can provide understanding and insights into the outcomes and costs of human-wildlife conflicts beyond those obtainable only from the prevalent single species schemes.
Here, we evaluate a national compensation scheme that has been in existence in Kenya since 1976. The scheme pays out compensation for human fatality, injury or property damage (e.g., depredation of crops and livestock). Kenya’s national government allocates funds for the compensation payments in its yearly budgets through the national treasury. This is because wildlife is a national resource owned by the state in Kenya. The Kenyan state therefore bears responsibility for wildlife conservation, management and compensation for losses caused by human-wildlife conflicts. The Wildlife Act defines what qualifies for compensation and provides elaborate procedures that all compensation claims must follow before the government can make compensation payments. The national compensation scheme regulates compensation for losses caused by HWC in Kenya and has been anchored in two Acts of Parliament since 1976, namely the Wildlife (Conservation and Management) Act, Chapter 376 (hereafter Cap 376, Kenya Wildlife Service, n.d.) and The Wildlife Conservation and Management Act 2013 (Kenya Law, 2013). Cap 376 was in force from 1976 to 2013 but underwent multiple revisions during this period. Under this Act, human injury or death caused by wildlife was eligible for a meager compensation of Kenya Shillings (KES) 15,000 or 30,000, respectively, while crop damage and livestock depredation were assessed at the prevailing market values. However, compensation for all types of losses but human death or injury was suspended in 1989 through an amendment of Cap 376.
The amounts paid for compensation by the KNCS were not only too meager but the process of getting compensated was too slow and cumbersome (Sindiga, 1995). This was mainly because of elaborate procedures for launching and processing conflicts claims for losses linked to human-wildlife. Consequently, an amendment to the Act that came into effect on 1st July 2006 increased the amounts payable as compensation for human injury or death to KES 50,000 or 200,000, respectively. Cap 376 was repealed and replaced with The Wildlife Conservation and Management Act, 2013 (hereafter Act 2013) that came into force on 10th January 2014 (Kenya Law, 2013).
Act 2013 introduced two major changes relative to Cap 376, namely that it reinstated compensation for property damage caused by wildlife and substantially raised compensation payments. Specifically, Act 2013 expanded the types of losses caused by human-wildlife conflicts eligible for compensation to include human injury and its severity, human fatality and damage to private property (e.g. crops and livestock). Moreover, the compensation payments for human injury or fatality were increased almost 100-fold relative to the 2006 levels. In contrast, compensation for property damage was pegged at the prevailing market value of the damaged property, subject to the caveat that payment can only be made if, carelessness or laxity by the property owner, is not proven to have facilitated the loss. Act 2013 also provides an elaborate list of wildlife species in respect of which compensation payments may be made if they cause human injury, death or property damage. The large number of wildlife species in this list is a clear recognition that HWC are caused by multiple species (Mukeka et al., 2018), and that it is therefore not logically or legally tenable to consider just a small subset of species for compensation.
Our prime aim is to evaluate the performance of the KNCS by seeking answers to the following seven research questions by analyzing data collected by the Kenya Wildlife Service (KWS) from 2007 to 2016: 1) What is the inter-annual and seasonal pattern of HWC compensation claims? 2) What are the common human-wildlife conflict causing species, the types and number of conflicts they cause? 3) How are wildlife attacks on humans spread across the two key demographic attributes of gender and age? 4) How are HWC incidences distributed across Kenya’s administrative counties? 5) How do HWC vary with the proportion of a county under protection for conservation, human population density, rainfall, maximum temperature, and predominant agro-climatic zone in each county? 6) What is the monetary cost of HWC compensation payments per wildlife species, conflict type and county and how efficient was the KNCS during 2007-2016? 7) How did the amount of money paid for compensation claims compare with tourism revenue earnings by the Kenyan state during 2007-2016?
Study area
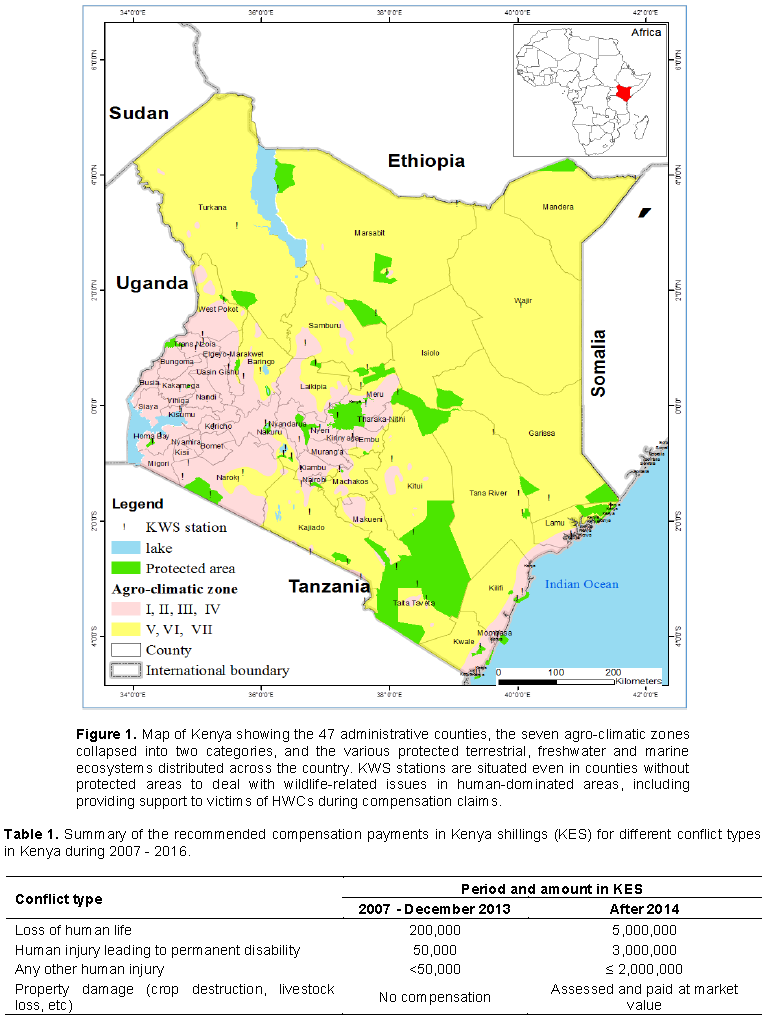
Kenya borders Somalia, Ethiopia, Sudan, Uganda, Tanzania, and the Indian Ocean in East Africa (Figure 1). It straddles the equator and lies between longitudes 33°50'E - 41°58' E and latitudes 5°2' N - 4°45' S and has a total area of 582,646 km2. Kenya's human population has grown exponentially from about 8 million people in 1962 to about 49 million people in 2017 (The World Bank, 2017) distributed across 47 administrative counties. Altitude ranges between 0 and 5199 m, the highest peak of Mount Kenya. Rainfall in Kenya is mostly bimodal with short rains occurring during November - December and the long rains during March-May (Ogutu et al., 2008). Kenya is divided into seven agro-climatic zones (I to VII), four (IV to VII) of which are hot, dry and receive little and often unreliable rains. The latter four zones have very limited agricultural potential, cover the largest percentage of Kenya (88%) and are often referred to as rangelands. The rangelands are inhabited predominantly by pastoral communities and harbour a wide variety of wildlife species that are adapted to the harsh climatic conditions (Pratt and Gwynne, 1977). Kenya has 63 protected areas, including 23 terrestrial national parks, 26 terrestrial national reserves, four marine national parks, six marine national reserves and four national sanctuaries that account for about 8% of Kenya’s total land surface area (Kanga et al., 2013). Most protected areas are not fenced and therefore wildlife move freely to human-dominated landscapes bringing them into frequent interaction with people and their livestock (Figure 1).
Processing human-wildlife conflict compensation data
The Kenya Wildlife Service (KWS) oversees all matters related to wildlife conservation and management in Kenya. Therefore, KWS maintains a national digital database of all compensation claims at its Headquarters in Nairobi since 2006. This database acts as a repository for all claims on compensation from different parts of the country (Figure 1) and provides timely information to the government. We sourced for and used the data for the 10 years covering 2007-2016. Noteworthy attributes of the compensation database include the date when the conflict incident occurred, the common English name of the wildlife species that caused the conflict, the type of conflict (human injury or death, damage to crops and other properties, livestock depredation), name of county where the conflict incident occurred, gender of the victim (male or female), age of the victim (adult - above 18 years or child - below 18 years), name of claimant (omitted from analysis for confidentiality considerations), whether a loss was compensated (yes or no), amount paid in Kenya shillings (Table 1), and the status of the claim (approved, not approved or pending). A claim may be pending or may not be approved due to a number of reasons, including lack of important documents, such as a national identity card of the claimant, missing or incomplete information; for example, the value of the damaged property for which compensation is claimed, or missing signature of the police officer or medical doctor who attended the case.

Prior to analysis, the compensation data were processed with the relevant information extracted. Several conflict species that had only general names in the database or species that caused relatively few conflicts were grouped together. Thus, we use antelopes to group together eland, lesser kudu, impala, bushbuck, wildebeest, and antelope (groups together conflict causing antelope species). We similarly used small carnivores to group together the civet, foxes, genet, honey badger, jackals, mongoose, serval cat and wildcat. Nonhuman primates group together baboons and monkeys, whereas snakes refer to a broad spectrum of mostly poisonous snakes. Moreover, fish refers to stonefish and stingray; pigs to warthog and wild pig and "others" to squirrel, bush baby, monitor lizard, ostrich, porcupine, reptiles, and rock hyrax involved in very few conflicts. Thus, the final list had 12 species, six species groups, and the 'other' species group. A list of the species and their common English and scientific names is provided in Appendix Table 1.
Kenya tourism earnings, agro-climatic zones and protected areas
We obtained data on Kenya's tourism earnings during 1995 - 2016 from the World Bank (The World Bank, 1995-2016 under Creative Commons Attribution 4.0, CC-BY 4.0) to quantify its growth over time, overall contribution of wildlife conservation to the Kenyan economy and assess it relative to the spending on compensation by KNCS. Since compensation is done in Kenya shillings, we obtained average annual US$ to KES exchange rates for comparison from the Central Bank of Kenya (Central Bank of Kenya, 2007-2016). We extracted the agro-climatic geo-layer from the UNEP/GRID database, derived from the Exploratory Soil Survey Report number E1, Kenya Soil survey, Nairobi 1982, that classifies Kenya into seven agro-climatic zones (I-VII) based on moisture and temperature. These classes are defined as follows (I) >80-Humid, (II) 65-80-Sub-humid, (III) 50-65-Semi-humid, (IV) 40-50-Semi-humid to Semi-arid, (V) 25-40-Semi-arid, (VI) 15-25-Arid, and (VII) <15-Very arid. We re-classified these zones into two broad classes. Class I included zones I- IV (high agricultural potential), and class II included zones V - VII (low agricultural potential). Further, we calculated the number of HWC by type for each of the two derived classes. We also used Kenya's 63 protected areas (PA) (Kanga et al., 2012) to calculate the percentage of each county under protection for conservation.
Human population size, rainfall and maximum temperature
Kenya's human population census data sets for 1962, 1979, 1989, 1999 and 2009 were obtained from the Kenya National Bureau of Statistics (KNBS) (KNBS, n.d). Since these censuses are decadal, we used interpolation to obtain population size estimates for years between censuses and extrapolation to obtain estimates for 2009-2016 for each 5 × 5 km grid cell. The population estimates were summed up across all grid cells in each county for each year to derive the total population size estimate. We used a semi-parametric generalized linear mixed model, assuming a negative binomial error distribution and a log link function. The model allowed for fixed intercept and year effects and random intercept and slope effects for each 5 × 5 km grid unit and a completely general (unstructured) covariance matrix parameterized in terms of variances and correlations for the random intercept and slope effects for each 5 × 5 spatial grid unit. The model was implemented in the Glimmix procedure of SAS (SAS Institute 2018). Both total monthly rainfall and average monthly maximum temperature data were obtained from the Climate Hazards Group InfraRed Precipitation with Station (CHIRPS) rainfall data for each 5 × 5 km grid cell for the period 1960 – 2017 (Climate Hazards Group, n.d.). The human population, rainfall and maximum temperature data were obtained for only 21 rangeland counties covering 88% of Kenya’s terrestrial land surface and containing most of Kenya's wildlife (Ogutu et al., 2016). For analysis, two counties, Machakos and Makueni are merged to match historical monitoring data.
Statistical analyses
Descriptive statistics, cross-tabulations, and mostly nonparametric methods were used since most of the data were counts and not normally distributed after examining histograms and testing using Kolmogorov-Smirnov test (Ghasemi and Zahediasl (2012). Specifically Chi-square goodness of fit tests were used to analyze differences in compensation claims between years, species, conflict types, and across counties. Differences in effects of demographic variables (gender and age) were tested, using Chi-square goodness-of-fit. We tested for significance of the correlation between the percentage of each county under protection and the number of compensation claims made using the Spearman rank two-tailed test (Zar, 1984). The total number of conflicts in the two derived agro-climatic classes was compared.
We regressed the total number of human deaths or human injuries for each county against the county, human population size, total annual rainfall and average annual maximum temperature and all their possible interactions using a negative binomial regression with a log link. First, automatic variable selection was used, with the forward selection method, to select the best supported covariates from the set of human population, rainfall, and maximum temperature, county and their interactions, considering up to three way interaction effects. The logarithm of the total area of each county was used as an offset to adjust for variation in area across counties. We imposed a strong hierarchy constraint during automatic variable selection, meaning that an interaction term can only be retained in the model if the main effects contributing to the interaction term are also already in the model. Automatic variable selection was carried out using the SAS HPGENSELECT procedure (SAS Institute, 2018). The corrected Akaike Information Criterion (AICc) and likelihood ratio test were used to select the subset of the best supported variables and interaction terms to retain in the model. The subset of selected variables and interactions was then used to fit the final model in the SAS Glimmix procedure, assuming a negative binomial error distribution, a log link function and the logarithm of the area of each county as an offset to calculate the number of conflicts per unit area. The total number of human deaths or injuries averaged across all years for each calendar month was similarly related to the county, average total monthly rainfall, average maximum temperature, human population size and their interactions. The variable selection stage did not include human population as an influential predictor of HWC in the 20 rangeland counties in all the models and therefore human population size was omitted from the final model. Thus, county, rainfall and maximum temperature and their interactions were used as the only predictors of both the inter-annual and seasonal variation in the total number of human deaths or human injuries. Significance was assessed at the 5% level unless otherwise stated. Statistical analyses were carried out using SPSS Version 25.0 (IBM Corp. Release 2017) and SAS Version 9.4, SAS/STAT version 14.3 (SAS Institute 2018).
Annual and monthly variation in compensation claims in Kenya during 2007 - 2016
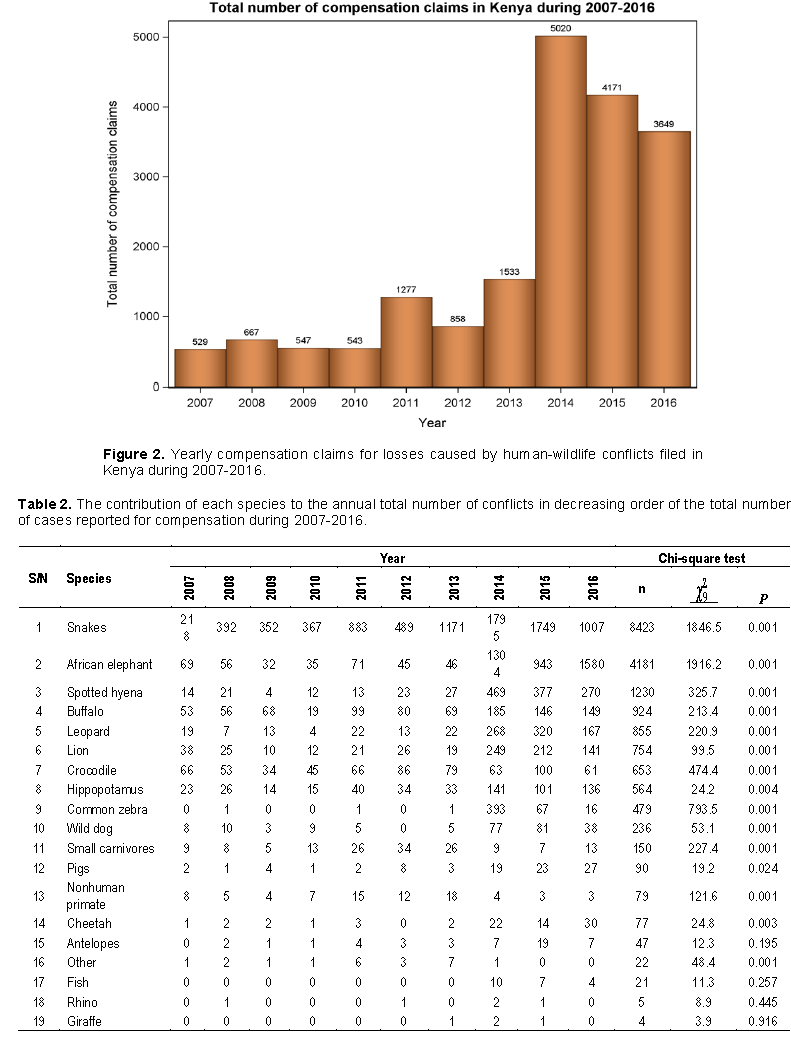
A total of 18,794 (1,879.4 ± 1720.1, range 529 - 5,020) compensation claims for losses caused by human-conflicts was filed for Kenya-wide during 2007 - 2016. Relative to 2012, the number of claims increased 1.8 fold in 2013, the year Kenya’s parliament passed the new Wildlife Conservation and Management Act 2013, and 5.8 fold to a peak in 2014, the year the new Act took effect. Thereafter, the number of claims declined from 2014 to 2016 (Figure 2). Snakes were the leading conflict species (44.8%) followed by the African elephant (Loxodonta africana, 22.3%). The next four leading conflict species were the spotted hyena (Crocuta crocuta, 6.5%), African buffalo (Syncerus caffer, 4.9%), leopard (Panthera pardus, 4.6%) and lion (Panther leo, 4.0%). Other notable species contributing to conflicts were the crocodile (Crocodylus niloticus, 3.5%), hippo (Hippopotamus amphibius, 3.0%) and common zebra (Equus quagga, 2.5%). Overall, the frequency of conflicts differed between species and across the years ( = 5104.9, = 0.001). Ten species caused at least 20 conflicts each year that resulted in compensation claims, and are the main focus of the subsequent sections, even though all the species were included in all the statistical tests (Table 2).
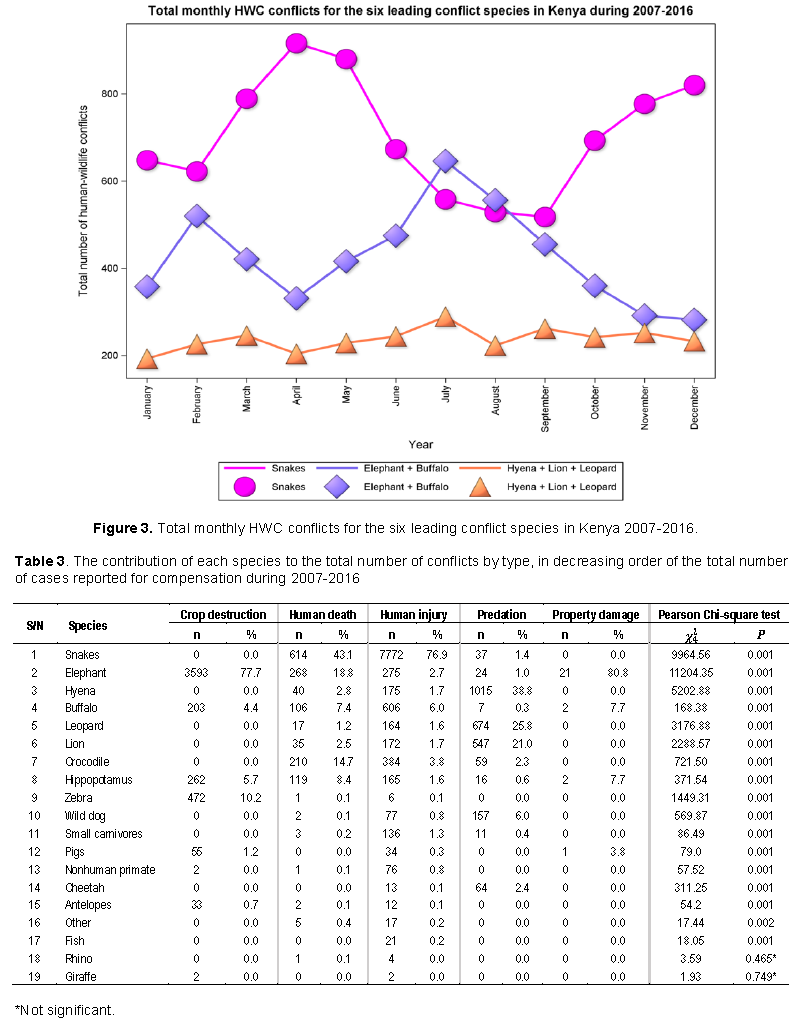
There was evident seasonality in conflicts but the nature of seasonality varied among species or species groups. In particular, conflicts caused by snakes peaked during the long (January-May) and short (November-December) wet seasons and were lowest during the long dry season between July-September. In contrast, the large herbivore conflicts peaked during the early dry season month of July. Conflicts caused by the three common carnivores followed a similar pattern to that for the herbivores (Figure 3).
Frequency of compensation claims by conflict type during 2007-2016
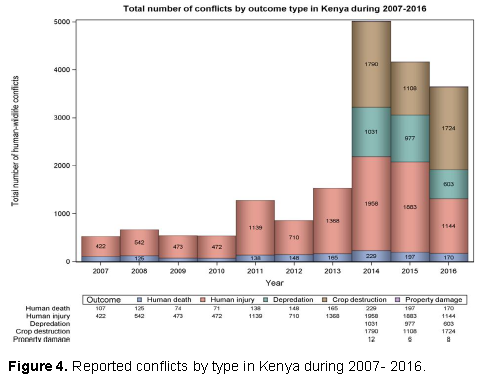
Human-wildlife conflicts resulted in five different types of reported outcomes during the 10 years (Table 3). Conflicts were seven times more likely to result in human injury (1011.1 ± 582.7) rather than death (142.4 ± 50.7). Crop destruction (1540.7 ± 376.2 SD) was nearly twice as likely to occur as livestock depredation events (870.3±233.1), and property damage (8.6 ± 3.1) was the least likely conflict type to occur in this period (Figure 4). The total number of conflict types varied significantly between years ( = 6104.4, < 0.001).
The total number of compensation claims for losses by species and conflict type
The number of compensation claims varied widely among species and conflict type, reflecting a marked disparity in the distribution of the total number of conflicts among conflict causing species and conflict type. Only five of the 19 wildlife species and species groups were responsible for over 90% of human deaths. They included snakes (43.1%, = 614), elephant (18.8%, = 268), crocodile (14.7%, = 210), hippo (8.4%, = 119) and the buffalo (7.4%, = 106). Snakes (76.9%), buffalo (6.0%) and crocodile (3.8) caused the highest number of human injuries. Elephant caused most of the damage to crops (77.7%) and other properties (80.8%). Three large carnivores comprising the hyena, leopard, and lion were responsible for 85.6% of all the livestock depredation cases, whereas the wild dog caused a mere 6.0% (Table 3). Overall, comparisons of HWC between species and conflict types showed significant differences ( = 28120.57, < 0.001).
Human injuries and deaths from HWC by gender and age
HWC in Kenya resulted in a total of 1,424 compensation claims for loss of human life and 10,111 for human injury between 2007 and 2016. The effect of conflicts was highly unbalanced in favor of females such that males were three times (77.3%, = 1424) more likely to be killed than females (22.7%). Further, twice as many males (69.4%, = 10,111) as females (30.6%) were likely to suffer injuries. As a result, significantly more males than females were either killed or injured in the conflicts ( = 37.3, < 0.001). Moreover, adults were more likely than children to be either killed (61.9%, = 1424) or injured (65.3%, = 10,111) in the conflicts. Consequently, significantly more adults than children either died or suffered injuries from the conflicts ( = 6.36, = 0.012).
Human-wildlife conflict compensation claims by conflict outcome type and county
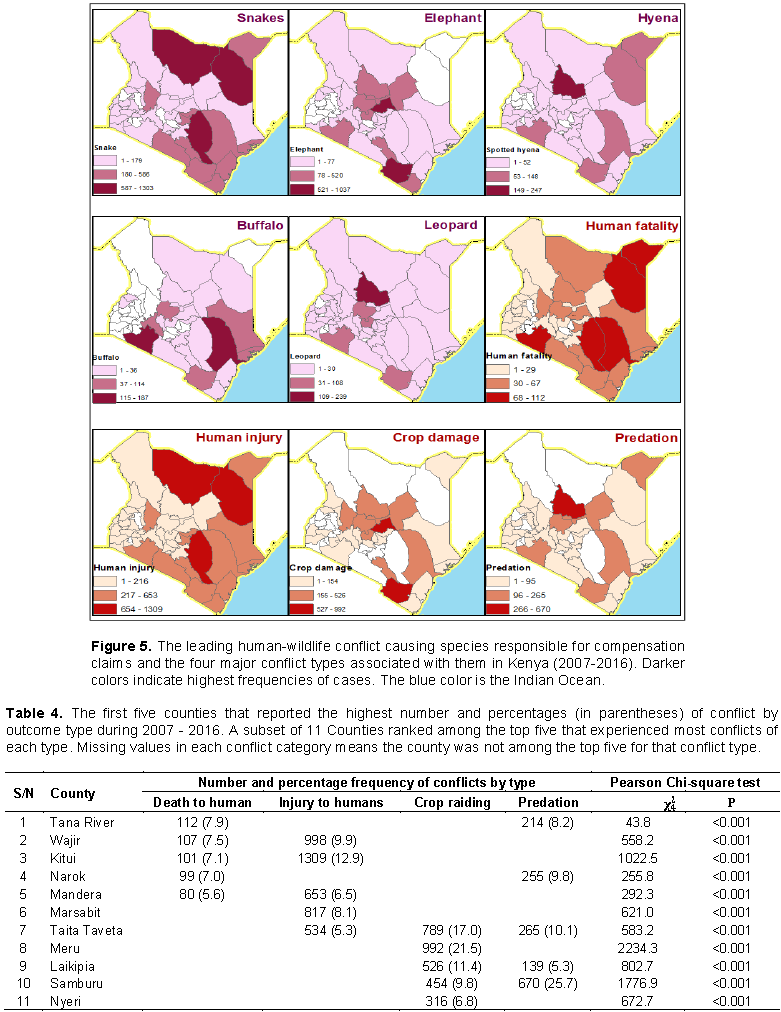
HWC occurred country-wide but varied considerably across counties in their intensity and type. Hence, all the47 counties of Kenya except Nyamira County reported human-wildlife conflict related cases for compensation (Figure 5). As a result, 57.2% of the total of 1,424 (35.6 ±32.11, = 40, range = 1 - 112) cases of human deaths reported during 2007 - 2016, were confined to only 10 of the 47 counties. Similarly, only 10 counties accounted for 64.9% of the total of 10,111 (225 ± 289, = 45, range = 1-1309) cases of human injury reported during 2007 - 2016. Crop damage was concentrated in even fewer counties with 66.6% of the total of 4,622 (165 ± 252, = 28, range = 1- 992) cases reported by only five counties. Furthermore, the 2,611 (73 ± 124, = 36, range = 1-670) livestock depredation cases reported were also highly unevenly distributed such that Samburu County was leading with 2.5 times as many cases as the second most affected County - Taita Taveta (Table 4). Although, only 26 property compensation claims were filed during this period, they also showed highly clumped distribution across counties, so that Makueni reported the highest (30.8%) number of cases followed by Samburu (19.2%). Overall, compensation claims were unevenly distributed across conflict outcome type ( = 10738.6, <0.001) over the 46 counties in which they occurred. More details can be found in Appendix Table 2.

The authors have not declared any conflict of interests.
The authors thank KWS for permission to use the human-wildlife conflict compensation data. Moses Maloba who is in charge of the HWC Database at KWS HQ played a major role in making the data available to us. JOO was supported by a grant from the German Research Foundation (DFG, Grant No. OG 83/1-1). This project has received funding from the European Union’s Horizon 2020 research and innovation programme under Grant Agreement No. 641918 through the AfricanBioServices Project. Three anonymous reviewers provided suggestions and comments that helped greatly improve this paper.
REFERENCES
|
Bauer H, Müller L, Van Der Goes D, Sillero-Zubiri C (2017). Financial compensation for damage to livestock by lions Panthera leo on community rangelands in Kenya. Oryx 51(1):106-114.
Crossref
|
|
|
|
Bulte E, Rondeau D (2007). Compensation for wildlife damages: Habitat conversion, species preservation and local welfare. Journal of Environmental Economics and Management 54(3):311-322.
Crossref
|
|
|
|
|
Butler JA (1993). Seasonal reproduction in the African olive grass snake, Psammophis phillipsi (Serpentes: Colubridae). Journal of Herpetology pp. 144-148.
Crossref
|
|
|
|
|
Carter NH, Allendorf TD (2016). Gendered perceptions of tigers in Chitwan National Park, Nepal. Biological Conservation 202:69-77.
Crossref
|
|
|
|
|
Central Bank of Kenya (2007-2016). Foreign Exchange Rates. Available at:
View
|
|
|
|
|
Chippaux JP (2011). Estimate of the burden of snakebites in sub-Saharan Africa: a meta-analytic approach. Toxicon 57(4):586-599.
Crossref
|
|
|
|
|
Chippaux JP, Massougbodji A, Diouf A, Baldé CM, Boyer LV (2015). Snake bites and antivenom shortage in Africa. The Lancet 386(10010):2252-2253.
Crossref
|
|
|
|
|
Climate Hazards Group (n.d). Climate Hazard Group InfraRed Precipitation with Station (CHIRPS) data archive.
|
|
|
|
|
Coombs MD, Dunachie SJ, Brooker S, Haynes J, Church J, Warrell DA (1997). Snake bites in Kenya: a preliminary survey of four areas. Transactions of the Royal Society of Tropical Medicine and Hygiene 91(3):319-321.
Crossref
|
|
|
|
|
Conover MR (2001). Resolving human-wildlife conflicts: the science of wildlife damage management. CRC press.
Crossref
|
|
|
|
|
Distefano E (2005). Human-Wildlife Conflict worldwide: collection of case studies, analysis of management strategies and good practices. Food and Agricultural Organization of the United Nations (FAO), Sustainable Agriculture and Rural Development Initiative (SARDI), Rome, Italy. Available from: FAO Corporate Document Repository. Available at:
View
|
|
|
|
|
Duff-Mackay A (1965). Notes on the biology of the carpet viper, Echis carinatus pyramidum (Geoffroy), in the northern frontier province of Kenya. Journal of the East Africa Natural History Society and National Museum 25(1):28-40.
|
|
|
|
|
Ghasemi A, Zahediasl S (2012). Normality tests for statistical analysis: a guide for non-statisticians. International Journal of Endocrinology and Metabolism 10(2):486.
Crossref
|
|
|
|
|
Government of Kenya (GoK) (2010). Government of Kenya, Tourism Act 2010. Nairobi: Government Printer.
|
|
|
|
|
Groom RJ (2007). How to make land subdivision work: An analysis of the ecological and socio-economic factors affecting conservation outcomes dureing land privatisation in Kenyan Maasiland (PhD Thesis). University of Bristol.
|
|
|
|
|
Hazzah L, Dolrenry S, Naughton L, Edwards CT, Mwebi O, Kearney F, Frank L (2014). Efficacy of two lion conservation programs in Maasailand, Kenya. Conservation Biology 28(3):851-860.
Crossref
|
|
|
|
|
Holmern T, Nyahongo J, Røskaft E (2007). Livestock loss caused by predators outside the Serengeti National Park, Tanzania. Biological Conservation 135(4):518-526.
Crossref
|
|
|
|
|
Johnson MF, Karanth KK, Weinthal E (2018). Compensation as a Policy for Mitigating Human-wildlife Conflict Around Four Protected Areas in Rajasthan, India. Conservation and Society 16(3):305-319.
Crossref
|
|
|
|
|
Kaltenborn BP, Bjerke T, Nyahongo J (2006). Living with problem animals-Self-reported fear of potentially dangerous species in the Serengeti Region, Tanzania. Human Dimensions of Wildlife 11(6):397-409.
Crossref
|
|
|
|
|
Kanga EM, Ogutu JO, Piepho HP, Olff H (2012). Human-hippo conflicts in Kenya during 1997-2008: vulnerability of a megaherbivore to anthropogenic land use changes. Journal of Land Use Science 7(4):395-406.
Crossref
|
|
|
|
|
Kanga EM, Ogutu JO, Piepho HP, Olff H (2013). Hippopotamus and livestock grazing: influences on riparian vegetation and facilitation of other herbivores in the Mara Region of Kenya. Landscape and Ecological Engineering 9(1):47-58.
Crossref
|
|
|
|
|
Karanth KK, Gopalaswamy AM, DeFries R, Ballal N (2012). Assessing patterns of human-wildlife conflicts and compensation around a central Indian protected area. PloS One 7(12):e50433.
Crossref
|
|
|
|
|
Karanth KK, Gopalaswamy AM, Prasad PK, Dasgupta S (2013). Patterns of human-wildlife conflicts and compensation: Insights from Western Ghats protected areas. Biological Conservation 166(C):175-185.
Crossref
|
|
|
|
|
Karanth KK, Gupta S, Vanamamalai A (2018). Compensation payments, procedures and policies towards human-wildlife conflict management: Insights from India. Biological Conservation 227:383-389.
Crossref
|
|
|
|
|
Kenya Law (2013). Wildlife conservation and management. Available at:
View.
|
|
|
|
|
Kenya Wildlife Service (2007-2016). National Laws and Policies. Available at:
View
|
|
|
|
|
Kellert SR, Berry JK (1987). Attitudes, knowledge, and behaviors toward wildlife as affected by gender. Wildlife Society Bulletin (1973-2006) 15(3):363-371.
|
|
|
|
|
Kibara ON, Odhiambo NM, Njuguna JM (2012). Tourism and economic growth in Kenya: An empirical investigation. The International
Crossref
|
|
|
|
|
Kipkore W, Wanjohi B, Rono H, Kigen G (2014). A study of the medicinal plants used by the Marakwet Community in Kenya. Journal of Ethnobiology and Ethnomedicine 10(1):24.
Crossref
|
|
|
|
|
Kenya National Bureau of Statistics (KNBS) (n.d). Data Sharing Platforms. Available at: from
View
|
|
|
|
|
Kolowski JM, Holekamp KE (2006). Spatial, temporal, and physical characteristics of livestock depredations by large carnivores along a Kenyan reserve border. Biological Conservation 128(4):529-541.
Crossref
|
|
|
|
|
Lesilau F, Fonck M, Gatta M, Musyoki C, van't Zelfde M, Persoon GA, de Iongh HH (2018). Effectiveness of a LED flashlight technique in reducing livestock depredation by lions (Panthera leo) around Nairobi National Park, Kenya. PloS One 13(1):e0190898.
Crossref
|
|
|
|
|
Lyamuya RD, Masenga EH, Fyumagwa RD, Mwita MN, Røskaft E (2016). Pastoralist herding efficiency in dealing with carnivore-livestock conflicts in the eastern Serengeti, Tanzania. International Journal of Biodiversity Science, Ecosystem Services Management 12(3):202-211.
|
|
|
|
|
Maclennan SD, Groom RJ, Macdonald DW, Frank LG (2009). Evaluation of a compensation scheme to bring about pastoralist tolerance of lions. Biological Conservation 142(11):2419-2427.
Crossref
|
|
|
|
|
Madhusudan MD (2003). Living amidst large wildlife: livestock and crop depredation by large mammals in the interior villages of Bhadra Tiger Reserve, South India. Environmental Management 31(4):0466-0475.
|
|
|
|
|
Messmer TA (2009). Human-wildlife conflicts: emerging challenges and opportunities. Human-Wildlife Conflicts 3(1):10-17.
|
|
|
|
|
Messmer TA (2000). The emergence of human-wildlife conflict management: turning challenges into opportunities. International Biodeterioration Biodegradation 45(3-4):97-102.
Crossref
|
|
|
|
|
Mukeka JM, Ogutu JO, Kanga E, Røskaft E (2018). Characteristics of Human-Wildlife Conflicts in Kenya: Examples of Tsavo and Maasai Mara Regions. Environment and Natural Resources Research 8(3).
Crossref
|
|
|
|
|
Mutuga F (2009). The effect of urbanization on protected areas. The impact of urban growth on a wildlife protected area: a case study of Nairobi National Park.
|
|
|
|
|
Nemtzov SC (2003). A short-lived wolf depredation compensation program in Israel. Carnivore Damage Prevention News 6:16-17.
|
|
|
|
|
Ngene S, Lala F, Nzisa M, Kimite, K, Mukeka J, Kiambi S, Khayale C (2017). Aerial Total Count Of Elephants, Buffalo And Giraffe In The Tsavo-Mkomazi Ecosystem (February 2017).
|
|
|
|
|
Nhachi CF, Kasilo OM (1994). Snake poisoning in rural Zimbabwe-a prospective study. Journal of Applied Toxicology 14(3):191-193.
Crossref
|
|
|
|
|
Nyhus PJ, Osofsky SA, Ferraro P, Madden F, Fischer H (2005). Bearing the costs of human-wildlife conflict: the challenges of compensation schemes. Conservation Biology Series-Cambridge 9:107.
Crossref
|
|
|
|
|
Ogra M, Badola R (2008). Compensating human-wildlife conflict in protected area communities: ground-level perspectives from Uttarakhand, India. Human Ecology 36(5):717.
Crossref
|
|
|
|
|
Ogutu JO, Owen-Smith N, Piepho H, Said MY, Kifugo S, Reid RS, Gichohi H, Kahumbu P, Andanje S (2013). Changing wildlife populations in Nairobi National Park and adjoining Athi-Kaputiei Plains: collapse of the migratory wildebeest. Open Conservation Biology Journal 7(1):11-26.
Crossref
|
|
|
|
|
Ogutu JO, Piepho HP, Dublin HT, Bhola N, Reid RS (2008). El Ni-o-Southern Oscillation, rainfall, temperature and Normalized Difference Vegetation Index fluctuations in the Mara-Serengeti ecosystem. African Journal of Ecology 46(2):132-143.
Crossref
|
|
|
|
|
Ogutu JO, Piepho HP, Said MY, Ojwang GO, Njino LW, Kifugo SC, Wargute PW (2016). Extreme wildlife declines and concurrent increase in livestock numbers in Kenya: What are the causes? PloS One 11(9):e0163249.
Crossref
|
|
|
|
|
Ogutu JO, Owen-Smith N (2006). Oscillations in large mammal populations: are they related to predation or rainfall? African Journal of Ecology 43(4):332-339.
Crossref
|
|
|
|
|
Owuor BO, Kisangau DP (2006). Kenyan medicinal plants used as antivenin: a comparison of plant usage. Journal of Ethnobiology and Ethnomedicine 2(1):7.
Crossref
|
|
|
|
|
Patterson BD, Kasiki SM, Selempo E, Kays RW (2004). Livestock predation by lions (Panthera leo) and other carnivores on ranches neighboring Tsavo National Parks, Kenya. Biological Conservation 119(4):507-516.
Crossref
|
|
|
|
|
Pratt DJ, Gwynne MD (1977). Rangeland management and ecology in East Africa. Hodder and Stoughton.
|
|
|
|
|
Ravenelle J, Nyhus PJ (2017). Global patterns and trends in human-wildlife conflict compensation. Conservation Biology 31(6):1247-1256.
Crossref
|
|
|
|
|
Sindiga I (1995). Wildlife based tourism in Kenya: Land use conflicts and government compensation policies over protected areas. Journal of Tourism Studies 6(2):45.
|
|
|
|
|
Smith RJ, Kasiki S (2000). A spatial analysis of human-elephant conflict in the Tsavo ecosystem, Kenya. IUCN/Species Survival Commission African Elephant Specialist Group, Human-Elephant Conflict Task Force, Gland, Switzerland. Available at: View
|
|
|
|
|
Swenson JE, Andrén H (2005). A tale of two countries: large carnivore depredation and compensation schemes in Sweden and Norway. Conservation Biology Series-Cambridge 9:323.
Crossref
|
|
|
|
|
Treves A, Wallace RB, Naughton-Treves L, Morales A (2006). Co-managing human-wildlife conflicts: a review. Human Dimensions of Wildlife 11(6):383-396
Crossref
|
|
|
|
|
Tveraa T, Stien A, Brøseth H, Yoccoz NG (2014). The role of predation and food limitation on claims for compensation, reindeer demography and population dynamics. Journal of Applied Ecology 51(5):1264-1272.
Crossref
|
|
|
|
|
Woodroffe R, Sillero-Zubiri C (2012). Lycaon pictus. The IUCN Red List of Threatened Species 2012:e.T12436A16711116.
|
|
|
|
|
Woodroffe R, Thirgood S, Rabinowitz A (2005). The impact of human-wildlife conflict on natural systems. Conservation Biology Series-Cambridge 9:1.
Crossref
|
|
|
|
|
The World Bank (2017). Population Total, Kenya. Available at:
View
|
|
|
|
|
Zabel A, Holmâ€Müller KA (2008). Conservation performance payments for carnivore conservation in Sweden. Conservation Biology 22(2):247-251.
Crossref
|
|
|
|
|
Zar JH (1984). Biostatistical analysis 2nd edition. Pren Ti Ce-Ha Ll, En Glewood Cliffs, USA pp. 176-179.
|
|