ABSTRACT
The African elephant (Loxodonta africana) require vast areas to meet their survival needs such as food, mates, water, resting sites, and look up positions; the area referred to as home range. We collared 9 bull and 3 female elephants using satellite-linked Geographic Positioning System (GPS) collars in February 2013. Their movements were monitored up to April 2016 in the wider Amboseli landscape. We estimated their home ranges using 100% minimum convex polygon (MCP) and 95% Fixed Kernel Density Estimator (KDE) methods. A total of 48,852 GPS points were used representing 77% of the expected GPS points. This study revealed that bulls had a larger total home range size (MCP = 32,110 km²; KDE = 3,170 km² compared to females (MCP = 10,515 km²; KDE = 3,070 km²). The 95% confidence interval of the monthly range (95% KDE) for all elephants was 6,130 to 7,025 km² with the minimum and maximum range being 5,200 and 7,790 km² respectively. Females had smaller home ranges during the dry and wet season (MCP: dry = 2,974 km²; wet = 1,828 km²; KDE: dry = 2,810 km²; wet = 3,070 km²) than bulls (MCP: dry = 3,312 km²; wet = 13,288 km²; KDE: dry = 2,960 km²; wet = 3,720 km²). The variations of the elephant home range could have been influenced by an interaction of factors including rainfall, human disturbances and land use (e.g., farms, settlements, road network, and fences), water availability, bush cover, food availability, and tracking period. The most important areas that had key habitats for elephants were scattered throughout the Kenya/Tanzania borderland. The Amboseli-Tsavo-Magadi-Natron-West Kilimanjaro elephant population roams within specific areas of the landscape. Trans-boundary efforts should be enhanced to ensure sound management of the elephant-habitat-people interface for continued well-being of the elephant population.
Key words: Amboseli ecosystem, elephant, home range, minimum convex polygon, Kenya/Tanzania borderland, kernel density estimator.
The African elephant (Loxodonta africana) are mega-herbivores that require large areas for acquisition of the necessary resources for self-sustenance. Ecologists refer to this area as the home range. The initial definition of home range was provided by Burt (1943) as, “the area traversed by individual in the normal activities of food gathering, mating and caring of the young”. Mohr (1947) estimates home range using the minimum convex polygon method that completely encloses all data points by connecting the outer locations in such a way as to create a convex polygon. The area under the polygon is used by the animal to satisfy its resource requirements over a specified time (e.g., mates, food, water, escape routes from enemies, resting sites, and look up positions; Delany, 1982; Jewell, 1966).
The concept of animal home range has been discussed in detail by different authors including Osborn (2004), Walter et al. (2011), Odrenj (2011), Douglas-Hamilton et al. (2005), Lyons et al. (2013) and Kie et al. (2016). The authors agree that the size of an animal home range is an exact area whose size depends on the method and parameters used to define and estimate it. Some methods used to estimate home range include: 100% minimum convex polygon (MCP) (Mohr, 1947; Leuthold and Sale 1973; Lindeque and Lindeque, 1991; Thouless, 1996; Whyte, 1996; Getzand Wilmers, 2004; Getz et al., 2007; Foguekem et al., 2007; Ipavec et al., 2007), squared grids (SG) (Douglas-Hamilton et al., 2005), 95% kernel density estimation (KDE; Leggett, 2006; Lyons et al., 2013), and Brownian Bridge Movement Models (BBMM) (Horne et al., 2007; Fischer et al., 2013; Walter et al., 2011). More recent home range estimation methods that combine the simplicity of polygon methods with the robustness of kernel methods have been developed (Lyons et al., 2013). These methods superimpose and then aggregate non-parametric shapes constructed around each point and include Voronoi polygons (Casaer et al., 1999), Delaunay triangles (Downs and Horner, 2009) and Local Convex Hull (LoCoH) approach (Getz and Wilmers, 2004; Getz et al., 2007). These current methods (e.g., LoCoH and BBMM) better estimate animal home range than the old methods e.g., MCP (Kie et al., 2016). However, the current methods have not been used long enough and researchers are still using the old methods to facilitate comparison of home range sizes over time (Kie et al., 2016).
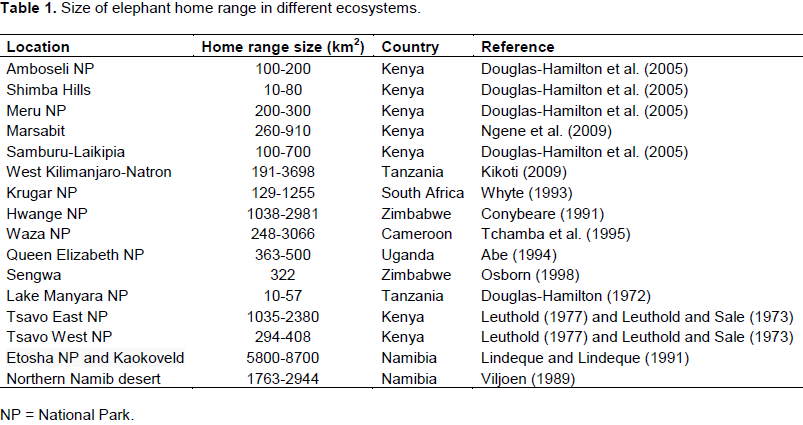
Individual elephants are known to range over vast areas, varying from 101 to 103 km2 (Leuthold and Sale, 1973; Lindeque and Lindeque, 1991; Thouless, 1995, 1996; Whyte, 1996; Douglas-Hamilton et al., 2005; Leggett, 2006; Foguekem et al., 2007; Ipavec et al., 2007; Ngene et al., 2009). Table 1 provides a summary of the sizes of African elephants in different ecosystems. Elephant home ranges were small in fenced areas (10 km2 to about 80 km2) and large in open areas (90 to about 800 km2; Douglas-Hamilton et al., 2005; Leggett,2006; Dolmia et al., 2007; Ngene et al., 2009; Kikoti, 2009). Long distance migrations of over 90 and 400 km in length have been reported from Kenya (Ngene et al., 2009), Mali (Blake et al., 2003) and Namibia (Leggett, 2006; Lindeque and Lindeque, 1991).

Despite the importance of the home range concept, there is no consensus among scientists studying animal movements on how to estimate the home range size of animals (Reinecke et al., 2014). However, in this paper, we estimate the home range of elephant in Amboseli ecosystem using the MCP and KDE methods. Despite its limitations (Powell, 2000; Osborn, 2004), the 100% MCP method was selected to facilitate comparisons of Amboseli elephant home ranges with those of West Kilimanjaro-Loliondo-Natron-Manyara areas in northern Tanzania (Kikoti, 2009). The 95% KDE method will provide a baseline for future comparisons of elephant home ranges in the study area. Although the MCP method estimates a larger home range size than KDE, it has been used for a long time and therefore, it offers an opportunity for comparing elephant home range in different areas (Osborn, 2004; Worton, 1989; Powell, 2000; Lyons et al., 2013; Kie et al., 2016). However, there is need to use another method to accurately estimate the elephant home range and offer an opportunity for future comparisons, especially with the current challenges of land use changes and their implications on elephant ranging patterns in the area. The 95% KDE method is popular (Worton, 1989; Lyons et al., 2013) because it is based on the superposition of Gaussian or compact (e.g., uniform or Epinechnikov) kernels and is more suitable for concave geometries (Lyons et al., 2013). Also, the method can estimate probability contours, and is easy to use due to its implementation in a variety of software packages (Lyons et al., 2013; Laver and Kelly, 2008). Regardless of the methodology used to estimate home range, changes of land use and land tenure systems affect utilization of range by elephants and constrict their home ranges (Doughlas-Hamilton et al., 2005; Gara et al., 2016a, b). The increase in human population and changes in lifestyles have resulted to changes in land use emanating from mushrooming of human infrastructure (e.g., roads, human settlements, fences and crop fields) within elephant ranges (Gara, 2014; Gara et al., 2016a, b). These changes impede wildlife movement and fragment prime elephants habitats (Burn Silver et al., 2008). Understanding elephant home range and space use in fragmentation landscape is critical for conservation and mitigating human-elephant conflicts (Gara et al., 2016a, b). In most savanna ecosystem across Africa landscape fragmentation due to land use and land tenure changes is understood to be a major threat to elephant and other large mammals’ distribution (Groom and Western, 2013). In Kenya, most protected area (parks, reserves and sanctuaries) aimed at in-situ conservation of different types of wildlife are bordered by human settlements (Graham et al., 2009). The Amboseli National Park is surrounded by six community ranches that are used by the Maasai agro-pastoralists for livestock grazing and subsistence and commercial crop farming (Hobbs et al., 2008; Gara, 2014).
These ranches act as dispersal areas and migratory corridors for elephants as they endeavor to connect cut off habitats (Burn Silver et al., 2008; Gara, 2014). However, these community ranches have experienced increased landscape fragmentation as a result of sedentarization of the Maasai, intensification of different landuse types and changing land tenure system (Ogutu et al., 2009; Gara et al., 2016a, b).
Landscape fragmentation as a result of sedentarization in the ranches has resulted in the increase of human-elephant conflict. The human-elephant conflicts in the area around Amboseli National Park are intensified by the fact that the elephants spend over 63% of their time outside the Amboseli National Park (Okello and D'Amour, 2008).
This paper maps the home ranges of 12 GPS-collared elephants in the Amboseli ecosystem using the 100% MCP and 95% KDE methods. We estimate the total and seasonal home range of the elephants (all combined, by sex [bull and females], and individual elephant). We also identify core areas utilized by the elephants using the 95% KDE method to discern key habitats important to the elephants as well as identify ranches important for elephant conservation.
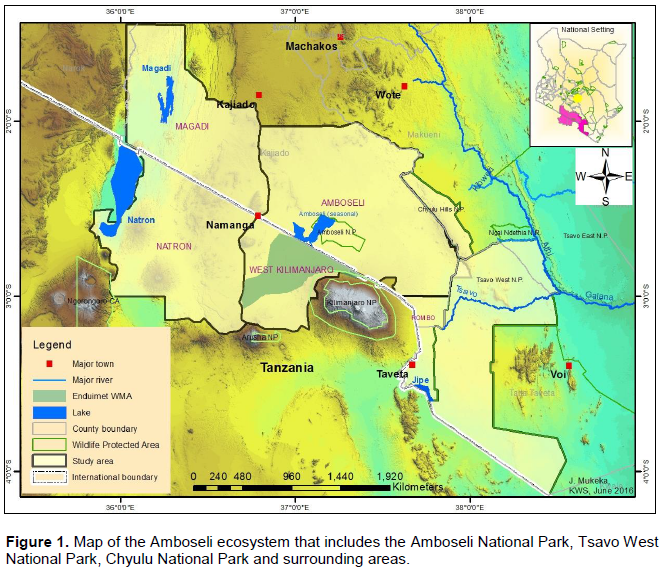
Study area
The Amboselie cosystem is located in Loitoktok Sub-County of Kajiado County. The ecosystem stretches between Mount Kilimanjaro, Chyulu Hills, Tsavo West National Park and the Kenya/Tanzania border. The current study area covers about 3,400 km2 (Figure 1). Administratively, the Amboseli ecosystem consists of Amboseli National Park and the surrounding six group ranches (KWS, 2014). The six group ranches include: Kimana/Tikondo, Olgulului/Olararashi, Selengei, Mbirikani, Kuku, and Rombo and cover an area of about 506,329 ha (KWS, 2014). In addition, it includes the former 48 individual ranches located on the slope of Kilimanjaro Mountain that are now under rain fed crop farming (KWS, 2014). These ranches were all once connected together and with Amboseli National Park but today, human settlements, farms, fences and road networks are slowly making them more isolated from each other and the park (Kioko and Okello, 2010).

The area falls in the agro-ecological zones V and VI, and is hence classified as arid to semi-arid savanna (Gara, 2014). It is more suitable for pastoralism rather than crop farming and has a high potential for conservation of wildlife and tourism based enterprises. The rainfall shows spatiotemporal variations during the year. Annual rainfall ranges from 500 to 600 mm in the north to 250 to 300 mm in Amboseli National Park (Gara, 2014). The rain falls in two seasons with short rains being experienced from November to January and long rains from March to April. The two rainy seasons are interspersed by two dry periods (February, May, June, July, August, September, October; Altmann et al., 2002; Gara, 2014). Surface water is scarce other than permanent water in swamps and artificial waterholes in the southeast part of the ecosystem (BurnSilver et al., 2008). Temperature varies from 20 to 30°C (Gara, 2014). Elevation ranges from 850 m above sea level to 1350 m above sea level (Gara, 2014). The ecosystem is dominated by the following vegetation types: The broad leaf, dry tropical forests and woodlands on the Kilimanjaro and Chyulu slopes; open grassland, riverine forest, halophytic grass and scrubland in the Amboseli Basin; and, scattered Commiphora and Acacia woodlands within the surrounding ranches (Howe et al., 2013; Western, 2007).
Data on elephant locations
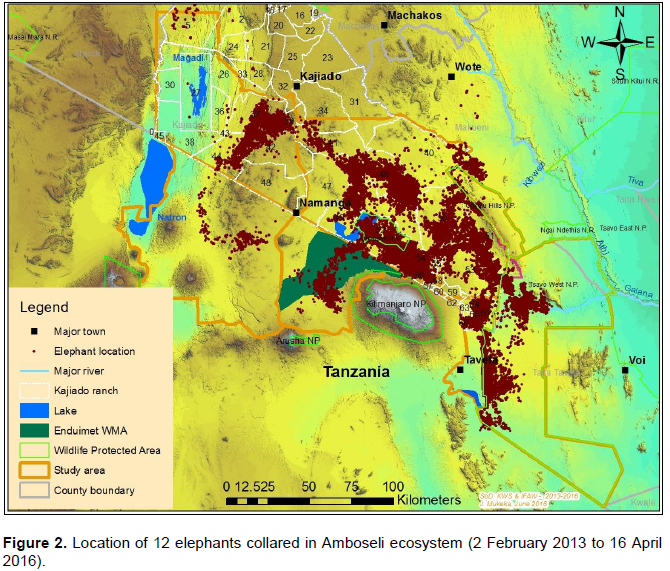
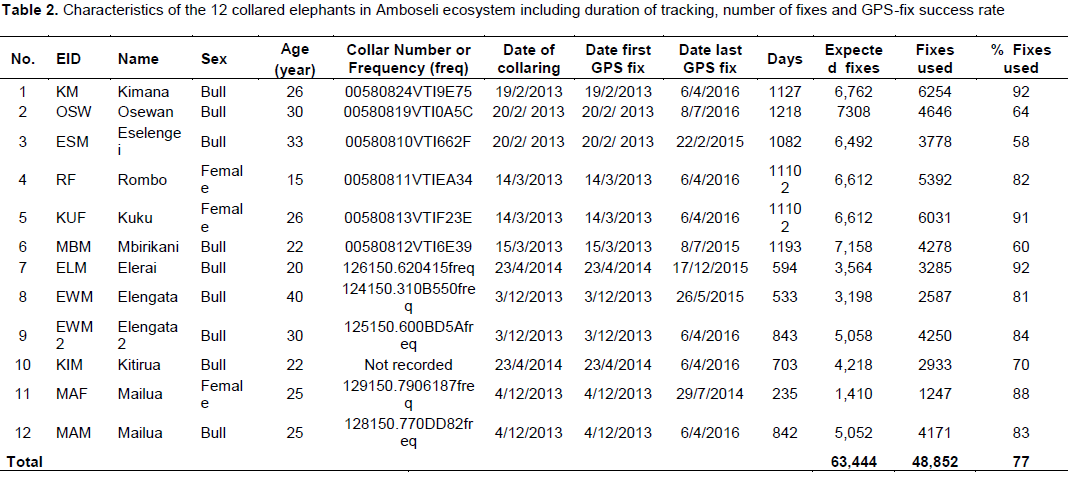
Data on the space-use of elephants were collected from 12 elephants (9 bulls and 3 females) collared with satellite-linked GPS collars in 2013 (between: 18thFebruary 2013 and 15th March 2013; and, 2nd December 2013 and 5th December 2013) and 2014 (between 23rd April 2014 and 24th April 2014) by Kenya Wildlife Service (KWS) and the International Fund for Animal Welfare (IFAW). The collars were supplied by African Wildlife Tracking, South Africa and were satellite GPS/VHF model. The collaring operation followed procedures described by Ngene et al. (2013). The collared elephants belonged to different family groups. All the elephants were collared outside Amboseli National Park, with the objective of observing and monitoring their movement patterns outside the park and understanding when the elephants utilize the park. Table 1 provides details of the collared elephants. Figure 2 shows the point data of all the 12 collared elephants.

The collared elephants were immobilized with Etorphine hydrochloride (18 mg) administered using a dart gun. The immobilized elephants were then revived using diprenorphine (54 mg). The GPS collars were configured to acquire one GPS fix after every four hours. The GPS fixes were acquired in form of geographic coordinates (latitude/longitude) format but were re-projected to Universal Transverse Mercator (UTM) WGS-84 reference system (Zone 37M) using ArcGIS 10.1 (ESRI, 2011).
Before analysis the GPS fixes were checked for any positional irregularities that included checking whether GPS fixes were within acceptable locations within and around study area. All the elephant location data were screened for accuracy following procedures described by Bjørneraas et al. (2010). Dataset that had GPS errors like missing coordinates were removed from the dataset before analysis. The causes of GPS errors are: Temporal malfunction of the GPS collars (Gala, 2014), canopy cover (Jiang et al., 2008; Sager-Fradkin et al., 2007; Heard et al., 2008), topography (terrain and slope; Hebblewhite et al., 2007; Frair et al., 2004) and collar orientation (Sager-Fradkin et al., 2007; Heard et al., 2008; Moen et al., 1996; Frair et al., 2010). The data available for analysis after screening ranged between 58 and 92% (Table 2), which is within acceptable range to characterize wildlife movement patterns and make sound inference (Frair et al., 2010). After GPS tracking data screening a total of 48,852GPS points were used for analysis (Figure 2).
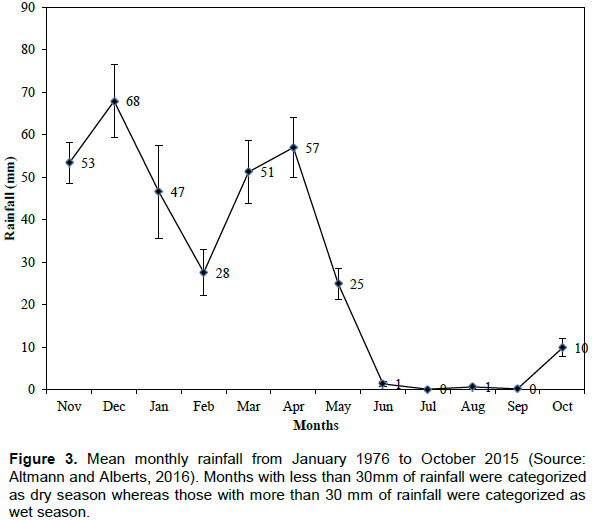
The datasets for each collared elephant were then classified into two seasons including wet(January, March, April, November and December) and dry (February, May, June, July, August, September and October) seasons respectively. The two seasons were selected as the study area falls within the tropical areas, which has only the wet and dry seasons. The seasons were selected based on monthly rainfall data from January 1976 to October 2015 (Figure 3; AltmannandAlberts,2016).Months with average rainfall of below and above 30 mm were categorized as dry and wet respectively (Altmann and Alberts, 2016; Figure 3). The elephant locations datasets were grouped into these two seasons because previous studies demonstrate that elephant behavior is season dependent (Douglas-Hamilton et al., 2005; Ngene et al., 2010). For example, the speed of elephant movement has been shown to vary from one season to another (Buij et al., 2007; de Beer and van Aarde, 2008; Ngene et al., 2010). Also, Gara (2014) reported that seasonality has a significant effect on the speed of elephant movement and habitat utilization.

Estimation of elephant home range
Home range of the elephant was estimated using the 100% Minimum Convex Polygon (MCP) method (Mohr, 1947) following procedures described by Beyer (2005) and implemented using Hawth’s tools as an ARCGIS extension. The Hawth’s tools were uploaded to ARCGIS 10 and used to calculate the MCP for each elephant. Based on the number of fixes (Table 2), the range used by all the elephants was estimated. In addition, individual elephant total and seasonal (dry and wet) home ranges were estimated. The MCP was used in different studies ((Leuthold and Sale 1973; Lindeque and Lindeque, 1991; Thouless, 1996; Whyte, 1996; Foguekem et al., 2007; Ipavec et al., 2007; Ngene et al., 2010), including in Tanzania (Kikoti, 2009) allowing comparisons with our study.
Space use by elephants
We established space use by the elephants using the 50 and 95% fixed kernel density estimator (KDE) method (Worton, 1989) implemented with the ARCMET tool (Wall, 2016) under the ARCGIS 10.3 environment (Worton, 1989; Fieberg, 2007; ESRI, 2013). The 95% KDE method quantified the probability density of elephant occurrence in the study area (Worton, 1989; Fieberg, 2007). The KDE was estimated for: all elephants for all seasons; all elephants during the wet and dry seasons; all bull and female elephants; and individual elephants in all seasons. The 50% KDE was used to isolate the core areas utilized by elephants. This is the areas that have the highest probability of being used by the elephants within their home ranges (Worton, 1989; Fieberg, 2007). The 95% and 50% KDE was estimated using a fixed bivariate normal kernel with a choice of ad hoc bandwidth (h-ad hoc) smoothing parameter as recommended by Worton (1989) and Schuler et al. (2014). We used the fixed kernel method rather than the adaptive kernel method as fixed kernel estimators are sensitive to multiple areas of concentrated use, and produce less area bias and better surface fit than adaptive kernel estimates (Seaman and Powel, 1996; Seaman at al., 1999).
Data analysis
Datasets for use in parametric tests were tested for normality and homogeneity of variances using the
Shapiro-Wilk Test(Shapiro et al., 1968; Fowler et al., 1998) with normality and homogeneity of variances being assumed when P> 0.05 (Shapiro et al., 1968). The
Shapiro-Wilk test is the preferred
test of normality because of its good power properties as compared to a wide range of alternative tests (Shapiro et al., 1968). For datasets that were not normally distributed and the variances were heterogeneous, they were Log
10 transformed to normalize them and ensure homogeneity of variances (Fowler et al., 1998). For datasets that could not attain normality non-parametric test were used. For parametric and non-parametric tests, we then used
T-test, one-way ANOVA
F-tests and chi-square goodness of fit test to analyze the data (Fowler et al., 1998) following procedures described by Statsoft (2002). Significant differences were at P ≤0.05 (Fowler et al., 1998).
Annual home range size
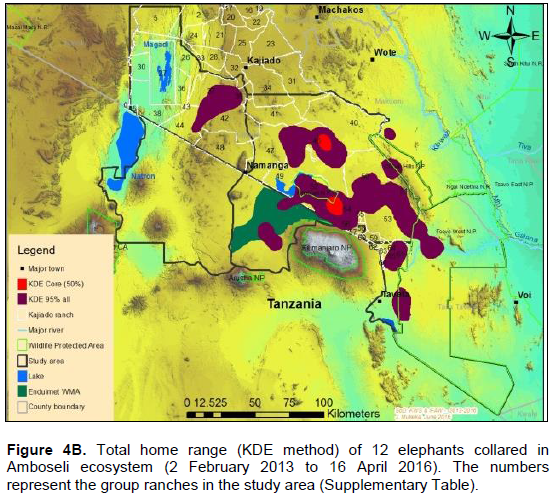
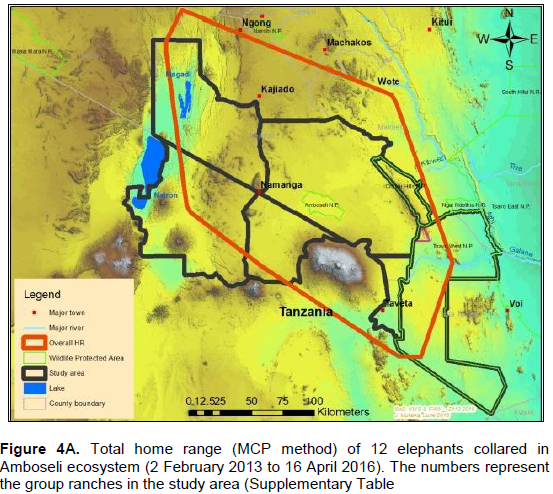
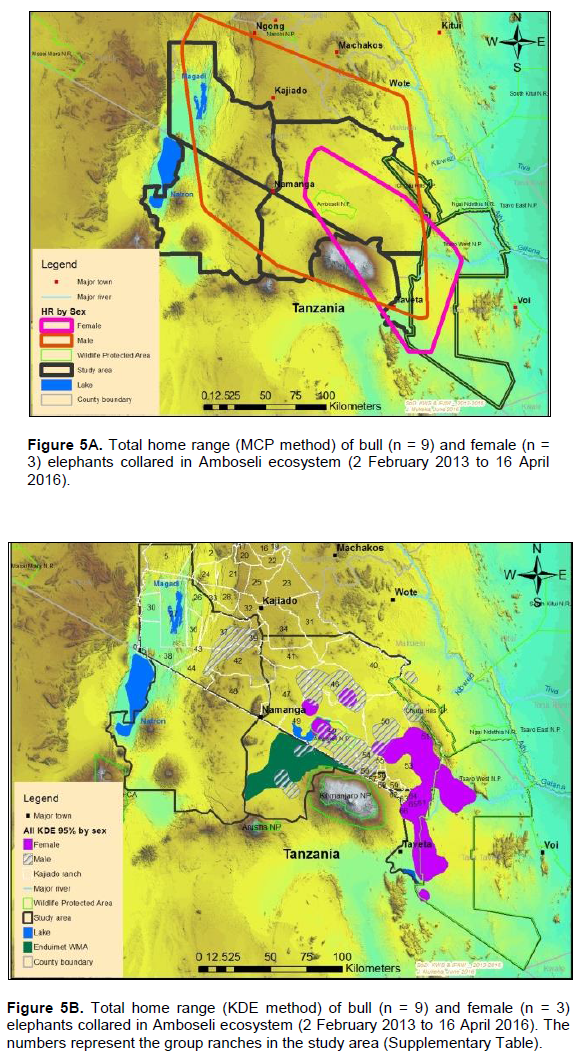
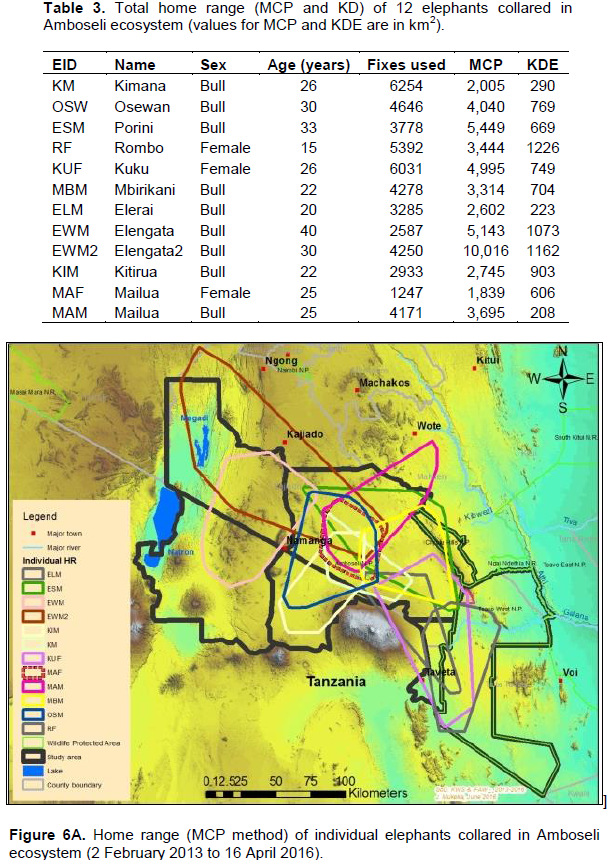
The annual range of the 12 elephants as estimated using the 100% MCP and 95% KDE methods was about 37,167 km2 (Figure 4A) and 5,360 km2 (Figure 4B) respectively. Bull elephants (n = 9) ranged in an area of about 32,110 km2 (100% MCP; Figure 5A) and 3,170 km2 (95% KDE; Figure 5B). The total home range of female elephant (n = 3) was about 10,515 km2 (100% MCP; Figure 5A), 3,070 km2 (95% KDE; Figure 5A) respectively. The home range of individual elephants is summarized in Table 3, Figure 6A (MCP method) and Figure 6B (95% KDE method). Female elephants did not range into Tanzania but three bulls (Kitirua, Osewani and Elengata) extended their range from Southern Kenya into the northern parts of Tanzania. The bull named Kimana ranged within the border area of Kenya and Tanzania, with some time being spent in Tanzania (Figure 6B). All the elephants utilized Amboseli National Park but the frequency of use varied among them (Supplementary Table). Rombo, a female elephant, was frequently located in Tsavo West National Park whereas the bull Erelai spent sometime in the same park (Supplementary Table).

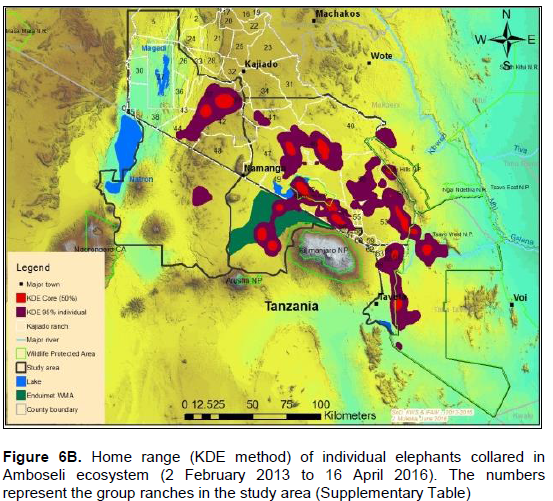
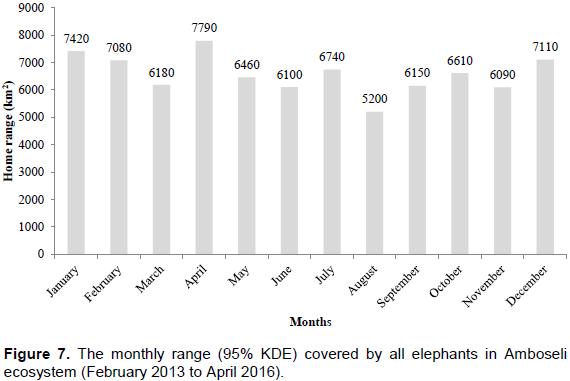
The core areas used by all elephants were located in Lengesim and Kimana/Tikodo ranches (Figure 4B). However, individual elephant core areas were located in the following ranches and parks: Mbuko, Lorngosua, Mailua, Lengesim, Amboseli National Park, Kimana/Tokondo, Endonet, Rombo Block II, Kuku, Tsavo West National Park, Chyulu West Game Conservation Area (Figure 6B; Supplementary Table). The 95% confidence interval of the monthly range (95% KDE) for all elephants was 6,130 to 7,025 km2 with the minimum and maximum range being 5,200 and 7,790 km2. The monthly range for all elephants varied significantly (t = 279; df = 11; p < 0.05; Figure 7). There was a significant variation of monthly home range with amount of rainfall with smaller home ranges being recorded in dry months than in wet months (t = 12; df = 1; p < 0.05; Figure 7). The smallest (5,200 km2) and largest (7,710 km2) range were observed in August and April, respectively (Figure 7).
Seasonal home range
The elephants covered a range (100% MCP) of 31,404 and 33,471 km2 during the dry and wet seasons respectively (Figure 8A). The dry and wet season home range (100% MCP) varied from 932 to 9,034 km2 and 671 km2 and 4,954 km2 respectively (Table 4). There was a significant seasonal variation of elephant home range sizes with smaller home ranges being recorded during the wet season than dry season (dry: X2 = 16,751; df = 11; p < 0.05; wet: X2 = 14730.94 df = 11 p < 0.05; Table 3).Some of the elephants showed larger and small home range (100% MCP) during the dry season than the wet season respectively (Table 4). Females had a significantly smaller mean home range (100% MCP: dry = 2,974 km2; wet = 1,828 km2) than bulls (100% MCP: dry = 3,312 km2; wet = 3,288 km2) during the dry and wet seasons respectively (dry season: t = 645; df = 22; p <0.05; wet season: t = 610; df = 22; p < 0.05).
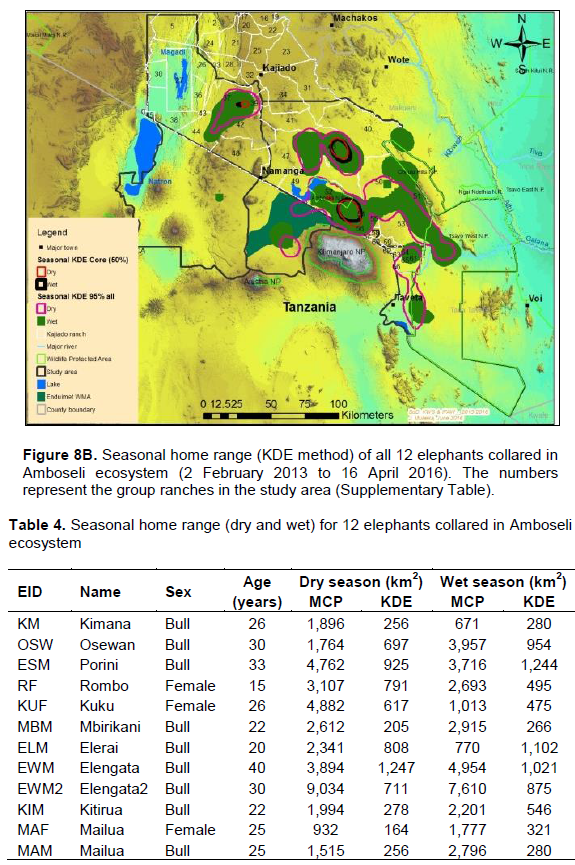
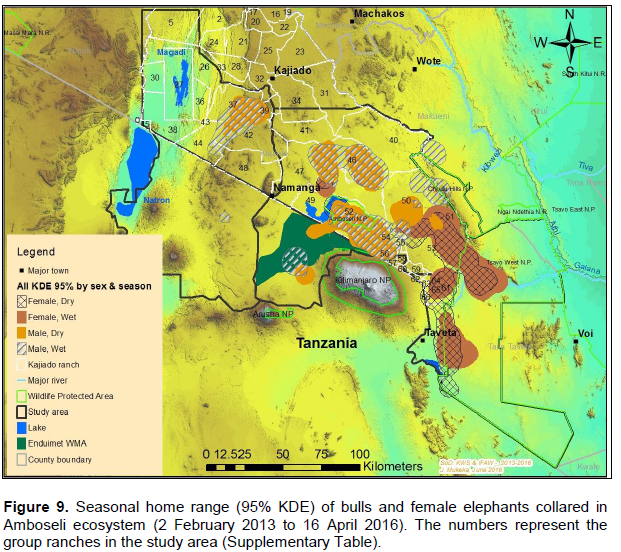
The elephants ranged (95% KDE) in an area of about 5,448 and 6,129 km2 during the dry and wet seasons respectively (Figure 8B). Results for 95% KDE showed the home range of females during the dry and wet season as 2,810 and 3,070 km2 respectively, while that of bulls was 2,960 km2 (dry season) and 3,720 km2 (wet season; Figure 9). Table 4 also summarizes home range of individual elephants using the 95% KDE method. The 95% KDE home range sizes vary as those reported for the MCP method. However, the 95% KDE method recorded smaller home ranges than those calculated using the MCP method (Table 4).
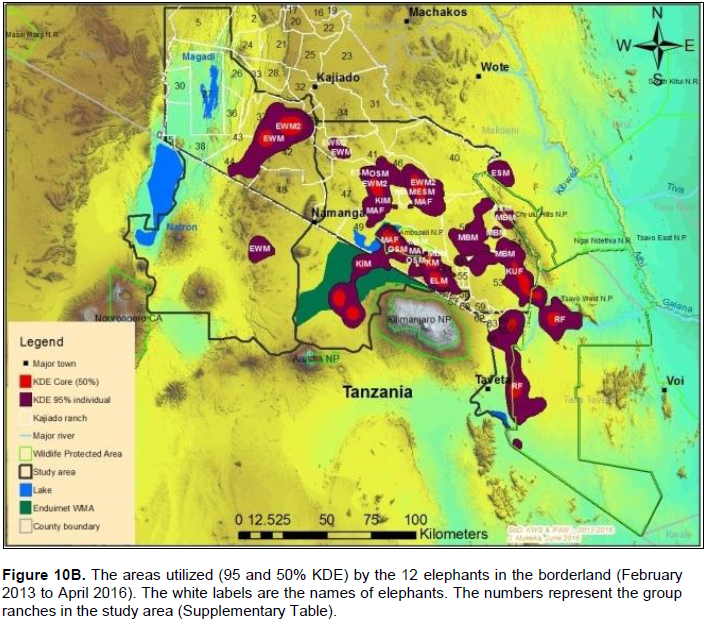
Our results reveal that individual elephants ranged from 1,839 to 10,016 km2 (100% MCP) and 290 to 1,226 km2 (95% KDE; Figure 10). Similar results of large variation of home range area (100% MCP) have been reported in other studies in East Africa (Ngene et al., 2009; Kikoti, 2009). For example, Kikoti (2009) reported that annual range of 21 elephants collared with satellite-linked GPS collars in northern Tanzania varied from 191 to 3,698 km2 (100% MCP).

In northern Kenya, Thouless (1996) reported that range area (100% MCP) for 20 female elephants varied from 102 to 5,527 km2. Also, Douglas-Hamilton et al. (2005) reported the home ranges size (100% MCP) for 11 elephants varied from 11 to 5, 520km2 in southern and central Kenya. The average home range of bulls (100% MCP), was much larger than the range of two bulls (M86: 210 km2; M169: 140 km2) collared in Amboseli National Park (Douglas-Hamilton et al., 2005). However, the two bulls were monitored for very short periods (134 and 168 days respectively) compared to this study that monitored the elephants from February 2013 to April 2016. The general implication of these space use patterns is that the elephants require space outside the protected areas within the larger Amboseli ecosystem. It is important to secure the space for elephants outside the protected areas for their continued use and future existence in the ecosystem. This can be achieved by direct purchase of land used by elephants outside the protected areas as well as establishment of successful community and private conservancies on space utilized by elephants outside the protected areas.
Only three females compared to nine bulls were collared during the study. However, our results showed that bulls had a larger total range (100% MCP) than females (bulls range: 2,005 to 10,016 km2; female range: 1,839 to 4,995 km2). However, when the 95% KDE was used, females had a larger total range than bulls (bulls: 208 to 1,162 km2;female:606to1,226km2).Similar results (100% MCP) were observed by Kikoti (2009) in Northern Tanzania where bulls had a larger home range than females (bulls: 700 to 3,698 km2; females (100% MCP): 191 to 2,590 km2). During the dry and wet seasons, bulls had larger mean home range than females (bulls dry: 3,312 km2; female dry = 2,974 km2; bull wet = 3,288 km2; female wet = 1,828 km2). Similar observations were made when the 95% KDE was used (bulls dry: 598 km2; Female dry = 143 km2; bull wet = 730 km2; Female wet = 430 km2). Our results match with similar previous studies on elephant home range (Stokke and du Toit, 2002; Jackson and Erasmus, 2005; Chase, 2007; Kikoti, 2009), which reported the home range sizes (95% fixed kernel) of bulls were larger than that of females. The female herds mostly consist of young elephants that cannot cope with extensive movements, therefore making female elephants to range in smaller areas than bulls (Ngene et al., 2009; Leggett, 2006). However, males consist of bulls of almost the same age and they are able to roam around in larger areas as their movements are not interfered with by young individuals who cannot cope with rigorous movements like females (Douglas-Hamilton et al., 2005; Ngene et al., 2009). It is evident that bulls will therefore require more space than females, a factor critical for them to continue accessing females on estrous at different localities within the larger Amboseli landscape. Efforts to secure space outside the protected areas should be enhanced to ensure it is available to the bull elephants.
Overall, the variations of elephant home range are influenced by an interaction of factors including rainfall, human disturbances (e.g., farms, settlements, fencing, urban development and road network), pressure from poaching, water availability, bush cover, food availability, habitat fragmentation, tracking period, and fencing of parcels of land (Esikuri, 1998; Douglas-Hamilton et al., 2005; Leggett, 2006; Foguekem et al., 2007; Mutima et al., 2009; Kikoti, 2009; Ngene et al., 2009; Gara, 2014). For Amboseli ecosystem, the elephant range has increasingly come under threat due to four factors including: Conversion of rangeland to farmland, increase of settlements, increase of human population, and shift of the Maasai community from nomadic pastoralism and transhumance to sedentary intensive agro-pastoralism (Esikuri, 2009; Okello and Kioko, 2010; Kioko and Okello, 2010). These factors have resulted to fragmentation of elephant range in Amboseli ecosystem as described and discussed in details by Gara (2014) and Gara et al. (2016a,
b). The fragmentation has resulted to reduction of elephant home range as the elephants only utilize secure habitats (Gara, 2014; Gara et al., 2016a, b). Gara et al. (2016a, b) reported that habitat utilization by elephants in human-dominated landscapes of Amboseli landscape was mostly explained by a combination of landscape fragmentation and vegetation productivity during the dry and transition seasons, than each of the factors alone.
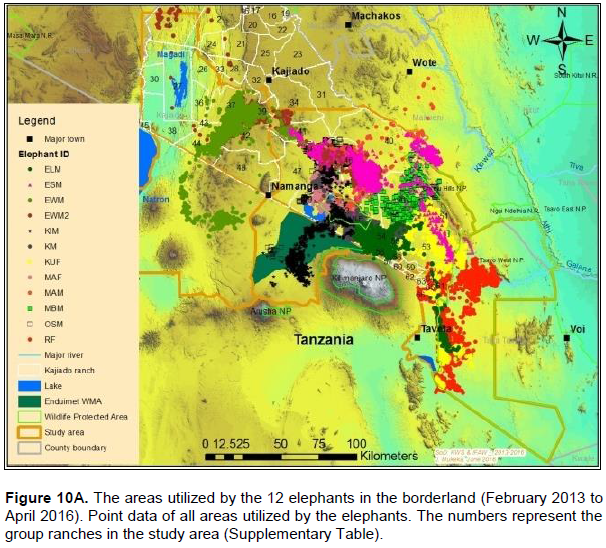
The proof of continued habitat fragmentation in the Amboseli ecosystem has been by many authors including Eskuru (1993), Kioko and Okello (2010) and Nyamasio and Kihima (2014). For example Esikuri (1993) reported over 70% of conversion of rangeland to crop land in Amboseli ecosystem with the trend being on the increase over the years. For example, Eskuru (1993) reported an increase of area under crop farming in Amboseli basin by 273, 461 and 733% for the time periods 1975-1988, 1988-1993, and 1975-1993 respectively. Kioko and Okello (2010) reported an increase of land under irrigated and rain-fed crop farming by 2,217 and 96% between 1976 and 2007. A more recent study by Nyamasio and Kihima (2014) at Kimana Wetland Ecosystem (KWE; 3,349 km2) reported increase of area under crop farming from about 70 km2 in 1980 to about 438 km2 in 2013, which represents a 526% increase in 33 years. During the same period land area under woodlands, wetlands and grassland decreased by 5.35, 69 and 8% respectively. These conversions are a pointer to constriction of elephant home range due to habitat fragmentation (Gara et al., 2016a, b). It is evidenced by avoidance of farmed or heavily settled areas of Kimana, Nguruman, Njukini, and Rombo in larger Amboseli ecosystem (Figure 10A and B; Gara et al., 2016a, b). Settlements and mushrooming of urban centers have ncreased over the past years (Gara et al., 2016a, b). For example, in KWE, which comprises of Entonet division, Central division, Imbirikani Location, and Amboseli National Park, land under settlements and urban areas increased by 682% between 1980 and 2013 (Nyamasio and Kihima, 2014). Human population has also increased in the ecosystem as more people and other communities (especially Changa, Kamba and Kikuyus) move to the area to undertake irrigation and rain fed crop farming (Okello, 2005; Kioko et al., 2006; Okello and Kioko, 2010; Kioko and Okello, 2010). For instance, over the past three decades, KWE has experienced an estimated annual human population growth rate of 4.67 as per the 2009 census, which translates to 84,297 persons and a population density of about 25 persons/km2 in 2009 (Nyamasio and Kihima, 2014). The human population in KWE is projected to be about 210,789 individuals and a population density of 63 persons/km2by 2030 (Nyamasio and Kihima, 2014). This will further constrict the elephantrange within the ecosystem. From the results, the KWE was avoided by the collared elephants during the study period (Figure 10A and B). This is because of settlements and farms therein. The shift of the Maasai community from nomadic pastoralism and transhumance to sedentary intensive agro-pastoralism has increased land fragmen-tation in Amboseli ecosystem (Kioko and Okello, 2010; Western, 1990). The land fragmentation has been aggravated by the development of infrastructure, demand for more land as the population increases, migration of people from crop farming communities, and sub-division of group ranches as individual members realize the need to own land and use it for other activities like farming and for selling (Kioko et al., 2006; Kioko and Okello, 2010; Gara, 2014; Gara et al., 2016a; Gara et al., 2016b).The above observations reveal massive conversion of Amboseli elephant range to farmlands and settlement areas (Esikuri, 1998; Kioko et al., 2006; Nyamasio and Kihima, 2014; Gara, 2014). The resultant effect is reduced elephant range, increased human-elephant conflicts, increased mortality of elephants and reduced income from farming (Okello, 2005; Okello and Kioko; 2010; Kioko et al., 2006; Kioko and Okello, 2010; Nyamasio and Kihima, 2014; Gara, 2014; Gara et al., 2016a, b). The above explains why elephants avoided the Kimana, Nyukini, Ngurumani, and Rombo area of Amboseli ecosystem as shown in Figure 10a and B.
In this study, we describe the home range of elephants in Amboseli ecosystem using the 100% MCP and 95% KDE. Bulls had larger home ranges than females. The elephant home range was larger during the dry season than wet season. The most important ranches that offer key habitats for elephants include: Lolarashi/Olgulului, Rombo, Mbirikani, Kimana/Tikondo, Endonet, Lengesim, Kaputei south, Kuku, Lorngosua, Mbuko, and ElangataWuas, Torosei, Kimana/Tikondo Small Holdings and Dalalakutuk. The Isilalei ranch was used as a corridor to and from Elengata Wuas, Lorngosua and Torosei ranches. These are priority ranches where efforts to establish community conservancies should be enhanced. Other important areas used by the elephants include Chyulu West Game Management Area (CWGMA) in Kenya and Endimet Wildlife Management Area (EWMA) in Tanzania. Amboseli, Tsavo West and Chyulu National Parks in Kenya as well as parts of the Natron area in Tanzania were also utilized by elephants. The elephant population utilizes the range in both Southern Kenya and Northern Tanzania. Therefore, trans-boundary efforts should be enhanced to ensure sound management of the elephant-habitat-people interface for continued wellbeing of the elephant population and communities living with the elephants in Southern Kenya and Northern Tanzania.
The authors have not declared any conflict of interests.
REFERENCES
|
Altmann J, Alberts S, Altmann S, Roy S (2002). Dramatic change in local climate patterns in the Amboseli basin, Kenya. Afr. J. Ecol. 40(3):248-251.
Crossref
|
|
|
|
BurnSilver S, Worden J, Boone R (2008). Processes of Fragmentation in the Amboseli Ecosystem, Southern Kajiado District, Kenya. In Galvin K, Reid R, Hobbs RBNT (Eds.), Fragmentation in Semi-Arid and Arid Landscapes: Springer Netherlands. pp. 225-253.
|
|
|
|
|
Burt WH (1943). Territoriality and home range concepts as applied to mammals. J. Mammol. 24:346-352.
Crossref
|
|
|
|
|
Casaer JIM, Hermy M, Coppin POL, Verhagen RON (1999). Analyzing space use patterns by Thiessen polygon and triangulated irregular network interpolation: A non-parametric method for processing telemetric animal fixes. Int. J. Geogr. Inform. Sci. 13:499-511.
Crossref
|
|
|
|
|
Douglas-Hamilton I, Krink T, Vollrath F (2005). Movement and corridors of African elephants in relation to protected areas. Naturwissenschaften 92:158-163.
Crossref
|
|
|
|
|
Downs J, Horner M (2009). A Characteristic-Hull Based Method for Home Range Estimation. Transactions in GIS 13:527-537.
Crossref
|
|
|
|
|
Esikuri EE (1998). Spatio-Temporal Effects of Land Use Changes in A Savanna Wildlife Area of Kenya. PhD Thesis, Virginia Polytechnic Institute and State University, Virginia, USA.
|
|
|
|
|
ESRI [Environmental Systems Research Institute] (2010). ArcGIS: Arc Map Version 10.3. ESRI, California, USA.
|
|
|
|
|
Fieberg J (2007). Kernel density estimators of home range: smoothing and the autocorrelation red herring. Ecology 88(4):1059-1066.
Crossref
|
|
|
|
|
Frair JL, Nielsen SE, Merrill EH, Lele SR, Boyce MS, Munro RHM, Stenhouse GB, Beyer HL (2004). Removing GPS collar bias in habitat selection studies. J. Appl. Ecol. 41:201-212.
Crossref
|
|
|
|
|
Frair JL, Fieberg J, Hebblewhite M, Cagnacci F, DeCesare NJ, Pedrotti L (2010). Resolving issues of imprecise and habitat-biased locations in ecological analyses using GPS telemetry data. Philos. Trans. R. Soc. B: Biol. Sci. 365(1550):2187-2200.
Crossref
|
|
|
|
|
Fowler J, Cohen L, Larvis P (1998). Practical statistics for field biology. John Wiley and Sons. West Sussex, England.
|
|
|
|
|
Gara TW, Wang TJ, Skidmore AK, Zengeya FM, Ngene SM, Murwira A, Ndaimani H (2016a). Understanding the effect of landscape fragmentation and vegetation productivity on elephant habitat utilization in Amboseli ecosystem, Kenya: Open access. Afr. J. Ecol.
Crossref
|
|
|
|
|
Gara TW, Wang TJ, Skidmore AK, Ngene SM, Dube T, Sibanda M (2016b). Elephants move faster in small fragments of low productivity in Amboseli ecosystems Kenya. Geocarto International,
|
|
|
|
|
Getz W, Fortmann-Roe S, Cross P, LyonsA, Ryan S, Wilmers C (2009). LoCoH:Non-parameteric Kernel Methods for Constructing Home Ranges and Utilization Distributions. PLoS ONE 2:e207.
Crossref
|
|
|
|
|
Getz WM, Wilmers CC (2004). A local nearest-neighbor convex-hull construction of home ranges and utilization distributions. Ecography 27:489-505.
Crossref
|
|
|
|
|
Graham MD, Douglas-Hamilton I, Adams WM, Lee PC (2009). The movement of African elephants in a human-dominated land-use mosaic. Anim. Conserv. 12(5):445-455.
Crossref
|
|
|
|
|
Groom, RJD, Western D (2013). Impact of Land Subdivision and Sedentarization on Wildlife in Kenya's Southern Rangelands. Rangeland Ecol. Manage. 66(1):1-9.
Crossref
|
|
|
|
|
Heard DC, Ciarniello LM, Seip DR (2008). Grizzlybear behavior and global positioning system collar fix rates. J. Wildlife Manage.72:596-602.
Crossref
|
|
|
|
|
Hebblewhite M, Percy M, Merrill EH (2007). Are all global positioning system collars created equal? Correcting habitat-induced bias using three brands in the Central Canadian Rockies. J. Wildlife Manage.
Crossref
|
|
|
|
|
Hobbs NT, Reid R, Galvin K, Ellis J (2008). Fragmentation of Arid and Semi-Arid Ecosystems: Implications for People and Animals. In Galvin K, R Reid RB Hobbs N T (Eds.) Fragmentation in Semi-Arid and Arid Landscapes: Springer Netherlands. pp. 25-44.
|
|
|
|
|
Horne JS, Garton EO, Krone SM, Lewis JS (2007). Analyzing Animal Movements Using Brownian Bridges. Ecol. 88:2354-2363.
Crossref
|
|
|
|
|
Howe M, Okello MM, Davis JM (2013). Inter-specific Variation in the Distribution of Ungulates Relative to Human Infrastructure Surrounding Amboseli National Park. Afr. Zool. 48(1):159-166.
Crossref
|
|
|
|
|
Jiang Z, Sugita M, Kitahara M, Takatsuki S, Goto T, Yoshida Y (2008). Effects of habitat feature, antenna position, movement, and fix interval on GPS radio collar performance in Mount Fuji, central Japan. Ecol. Res. 23:581-588.
Crossref
|
|
|
|
|
Kie JG, Matthiopoulos J, Fieberg J, Powel RA, Cagnaccia F, Mitchell MS, Gaillard J, Moorcroft PR (2016).The home range concept: A traditional estimator still relevant with modern telemetry? Phil. Trans. R. Soc. 365:2221-2231.
Crossref
|
|
|
|
|
Kikoti AP (2009). Seasonal home range sizes, trans-boundary movements and conservation of elephants in Northern Tanzania. PhD Thesis, University of Massachusetts, Massachusetts, USA.
|
|
|
|
|
Kioko J, Kiringe J, Omondi P (2006).Human–elephant conflict outlook in the Tsavo–Amboseli ecosystem, Kenya. Pachyderm 41:53-60.
|
|
|
|
|
Kioko J, Okello MM (2010).Land use cover and environmental changes in a semi-arid rangeland, Southern Kenya. J. Geogr. Regional Plann. 3(11):322-326.
|
|
|
|
|
Laver PN, Kellyn MJ (2008). A Critical Review of Home Range Studies. J. Wildl. Manage. 72:290-298.
Crossref
|
|
|
|
|
Legget KEA (2006). Home range and seasonal movement of elephants in the Kunene Region, northwestern Namibia. Afr. Zool. 41:17-36.
Crossref
|
|
|
|
|
Lyons JA, Turner WC, Getz WM (2013). Home range plus: a space-time characterization of movement over real landscapes. Mov. Ecol. 1(2):1-14.
Crossref
|
|
|
|
|
Moen R, Pastor J, Cohen Y, Schwartz CC (1996). Effects of moose movement and habitat use on GPScollar performance. J. Wildl. Manage. 60:659-668.
Crossref
|
|
|
|
|
Mohr CO 1(947). Table of equivalent populations of North American small mammals. Am. Midl. Nat. 37:223-449.
Crossref
|
|
|
|
|
Ngene SM, Njumbi S, Ngoru B, Nzisa M, Bitok E, Poghon J, Gombe A, Koech E, Sangawe O, Wambua D, Omondi C, Korir W (2013). Satellite-Linked GPS Collars Deployed on Elephants in Tsavo Ecosystem, Kenya. In: Recent Advances in Satellite Research and Development (Eds. S. Gardiner and K.P. Olsen). Nova Publishers, New York, USA.
|
|
|
|
|
Ogutu JO, Piepho HP, Dublin HT, Bhola N, Reid RS (2009). Dynamics of Mara-Serengeti ungulates in relation to land use changes. J. Zool. 278(1):1-14.
Crossref
|
|
|
|
|
Okello MM, D'Amour DE (2008). Agricultural expansion within Kimana electric fences and implications for natural resource conservation around Amboseli National Park, Kenya. J. Arid Environ. 72(12):2179-2192.
Crossref
|
|
|
|
|
Okello MM (2005). Land use changes and human-wildlife conflicts in theAmboseli area, Kenya. Hum. Dimens. Wildl. 10(1):19-28.
Crossref
|
|
|
|
|
Okello MM, Kioko J (2010). Contraction of wildlife dispersal area in Olgulului-Ololorashi Group Ranch around Amboseli National Park,Kenya. Open Conserv. Biol. J. 4:28-39.
Crossref
|
|
|
|
|
Osborn FV (2004). The concept of home range in relation to elephants in Africa. Pachyderm 37:37-44.
|
|
|
|
|
Powell RA (2000). Animal home ranges and territories and home rangeestimators. Research Techniques in Animal Ecology: Controversies and Consequences (Eds L. Boitani& T.K. Fuller). Columbia University, NewYork. pp. 65-110.
|
|
|
|
|
Reinecke H, Leinen L, Thißen I, Meißner M, Herzog S, Schütz S, Kiffner C (2014). Home range size estimates of red deer in Germany: environmental, individual and methodological correlates. Eur. J. Wildl. Res. 60:237-247.
Crossref
|
|
|
|
|
Sager-Fradkin KA, Jenkins KJ, Hoffman RA, Happe PJ, Beecham JJ, Wright RG (2007). Fix success and accuracy of global positioning system collars in oldgrowthtemperate coniferous forests. J. Wildl. Manage. 71:1298-1308.
Crossref
|
|
|
|
|
Seaman DE, Powell RA (1996). An evaluation of the accuracy of kernel density estimators for home range analysis. Ecol. 77:2075-2085.
Crossref
|
|
|
|
|
Schuler KL, Schroeder GM, Jenks JA, Kie JG (2014). Ad hoc smoothing parameter performance in kernel estimates of GPS-derived home ranges. Wildl. Biol. 20:259-266.
Crossref
|
|
|
|
|
Stokke S, Du Toit JT (2002). Sexual segregation in habitat use by elephants in ChobeNational Park, Botswana. African J. Ecol. 40:360-371.
Crossref
|
|
|
|
|
Wall J (2016). Movement Ecology for ArcGIS (ArcMet) [Online].
View [Accessed 10th June 2013].
|
|
|
|
|
Walter WD, Fischer JW, Baruch-MorDo S, Vercauteren KC (2011). What is the proper method to delineate home range of an animal using today's advanced GPS telemetry systems: the initial step, pp.249-268. In O. Krejcar (ed.), Modern telemetry. InTech, Rijeka, Croatia.
|
|
|
|
|
Worton BJ (1989). Kernel Methods for Estimating the Utilization Distribution in Home-Range Studies. Ecol. 70:164-168.
Crossref
|
|