Full Length Research Paper

ABSTRACT
Bacteriophytochromes (BphPs) are light-regulated biliprotein photoreceptors widely occurring in bacteria. BphPs exists in two spectral distinct states: the red-light absorbing state (Pr) and the far-red light-absorbing state (Pfr). BphPs are composed of an N-terminal photosensory core module and a light-controlled C-terminal histidine kinase module. The detailed mechanism on how photoconversion, initiated by a light-triggered isomerization of the biliverdin chromophore, is conducted from the N-terminal to the C-terminal domain and how the histidine kinase is modulated is still not clear. In this work Agp1 from Agrobacterium tumefaciens is used as a model phytochrome. The method of labeling full-length Agp1 mutants with single accessible Cys residue using fluorescence probes is described. Different absorption spectra showed that neither mutagenesis nor fluorescence labeling exerts significant effects on the photoconversion behavior of various Agp1 mutants. The histidine kinase activity assay revealed that the labeled holoproteins exhibit wild-types like autophosphorylation activity that depends on the Pr and the Pfr state. Fluorescence spectroscopic data suggested that fluorescence resonance energy transfer occurs from the donor Atto495 to the acceptor Atto565 in double-labeled Agp1-A362C, K514C, H554C, R603C, I653C, and V674C mutants. Red light irradiation gave rise to small changes on fluorescence emission intensity in some mutants but in some no remarkable inter-subunit distance changes occurred during the photo-conversion from Pr to Pfr in full-length Agp1. In contrast to double-labeled samples, significant changes in fluorescence intensity were observed in single-labeled samples.
Key words: Bacteriophytochromes (BphPs), C-terminal domain, photosensory, phytochrome.
INTRODUCTION
Phytochromes (Phys) are homodimeric, red/far-red light sensing photoreceptors with a bilin chromophore found in plants, fungi and bacteria. These photoreceptors are composed of the N-terminal photosensory core module and C-terminal output transducing domain. Phys have a characteristic photoconversion between the red-light absorbing state (Pr) and far-red absorbing state (Pfr). The chromophore, which is covalently bound via its ring A to a conserved Cys residue of the apoprotein is responsible for this photoconversion behavior. As of plant phytochrome and cyanobacteria phytochrome that uses phytochromobilin (PfB) and phycocyanobilin (PCB) chromophore, respectively, bacterial phytochromes (Bacteriophytochrome (BphP)) use biliverdin as their chromophore, which is covalently attached to the apoprotein via a thioether linkage to a conserved Cys residue found at the N-terminus of the PAS domain (Bhoo et al., 2001; Giraud and Verméglio, 2008; Davis et al., 1999). BphPs are involved in the regulation of the synthesis of photosynthetic apoprotein, pigmentation, photo-movement and quorum-sensing network (Giraud et al., 2002; Giraud and Verméglio, 2012; Fixen et al., 2014; Barkovits et al., 2011). Structural analysis has revealed that some BphPs are composed of a relatively conserved N-terminal photosensory core module (PCM) and a C-terminal divergent histidine kinase module (HKM). The PCM module is relatively more conserved and is divided into three domains: the PAS (domain denominated after Per/Arnt/Sim), domain followed by the GAF domain (domain denominated after cyclic di-GMP phosphodiesterase/adenyl cyclase/Fhla) and the PHY domain (ddomain-specific for phytochromes). As for the latter this is less conserved than the HKM domain exhibit light-modulated aautophosphorylation activity or reversible phosphotransferase activity in vitro (Yeh et al., 1997; Karniol and Vierstra, 2003; Njimona and Lamparter, 2011).
The first step of photoconversion is a Z to E isomerization of the ring C-D of chromophore (Heyne et al., 2002; van Thor et al., 2007; Andel et al., 1996; Matysik et al., 1995; Wagner et al., 2005; Yang et al., 2007; Essen et al., 2008; Yang et al., 2008). There is also one report that light-induced rotation of the A pyrrole ring but not that of the D ring is the primary motion of the chromophore during photoconversion (Takala et al., 2014).
Although the light-induced structural changes around the chromophore of bacteriophytochromes have been described in molecular detail, the structural basis for signal transmission from the N-terminal to the C-terminal His kinase is still unclear, because until now there were only few reports concerning the structure of full-length Phys In 2014 Vierstra lab reported on the photosensory module of plant phytochrome (Burgie et al., 2014). Six years later (2020) in the same Versrtra group, the structure of both Pr and Pfr was described. This work gave a better insight into photoconversion (Burgie et al., 2020) and Kraskov et al. (2020) pointed out that intramolecular proton transfer triggers phytochromes’ structural changes. In one paper (Li et al., 2010), the 13Å full-length structure of Pr state for DrBphP was obtained using single-particle cryoelectron microscopy and negative staining EM, where the N-terminal domain was found to contribute to the dimerization (Li et al., 2010). In another paper, Bellini and Papiz (2012) solved the Pr structure of a bathy type bacterial phytochrome, RpBphP1, from Rhodopseudomonas palustris.
Unlike canonical bacterial phytochromes, RpBphP1 does not transmit phosphorelay signals but forms a complex with the transcriptional repressor RpPpsR2 on photoconversion with far-red light (Bellini and Papiz, 2012). The lack of the full-length structure of Pfr state has prevented the understanding of the precise mechanism of how light signal is transmitted from the photosensory module to the histidine kinase module. Apart from this, the authors are also interested in knowing how the histidine kinase activity is activated in BphPs. Marina et al. (2005) first reported on the crystallographic structure of an entire cytoplasmic region of a sensor HK from a thermophilic Thermotoga maritima, where the arrangement of the subunits was shown to the be in parallel orientations (Marina et al., 2005). Later, Dago et al. (2012) explored the inactive and signal-activated conformational states of the two catalytic domains of Bacillus subtilis sensor histidine kinase KinA, and they proposed that HK was activated by causing localized strain and unwinding at the end of the C-terminal helix of the HisKA domain (Dago et al., 2012). Here it is not sure if similar structural changes occurred in the C-terminal HK domain of Phys with the presence of PCM.
Additionally, the situation became more complicated because one of these phytochromes, Cph1 was crystallized in antiparallel (Essen et al., 2008) while the other was in parallel orientation. More interesting, it has been found that the modulation of histidine kinase in BphPs varied from species to species. For instance, in CpBphP and Agp1, Pr exhibited higher autophosphorylation activity than the Pfr state (Esteban et al., 2005; Karniol and Vierstra, 2003). However, stronger Pfr activity had been reported for Agp2 and P. syringae phytochrome (Lamparter et al., 2002; Hubschmann et al., 2001). In contrast, no remarkable difference between Pr and Pfr activity was observed for PaBphP (Tasler et al., 2005). Obviously, it is worth investigating the signal transmission details in different BphPs.
In this work the full-length Agp1 from the soil bacteria Agrobacterium tumefaciens is used as a model bacterial phytochrome. Agp1 showed strong His kinase activities in Pr and weak in the Pfr (Karniol and Vierstra, 2003; Lamparter et al., 2002). It was postulated that the structures of the dark-adapted Pr form and red light irradiated Pfr state differed from each other (Noack et al., 2007). In contrast, the authors PELDOR studies on Agp1 gave no major structural difference between Pr and Pfr (Kacprzak et al., 2017).
Therefore, it is necessary to check if there exist some structural differences using other methods. In the present work, mutants were constructed by introducing single accessible Cys at selected positions in the wildtype that is, A362C, K514C, H554C, R603C, I653C, and V674C mutants.
Subsequently, they expressed, purified, and labeled the Cys residue using Atto495 and Atto565 in each mutant, and then detected the fluorescence changes during the photoconversion. It was found that: (1) FRET occurs between Atto495 and Atto565 labels in the subunit of the homodimer labeled protein. This excludes the possibility of antiparallel arrangement of two subunits in Agp1; (2) there are changes in the protein environment as seen by the Pr® Pfr changes of the monolabeled samples; and (3) different from the major changes predicted from the models, there are only minor changes seen in labeled Agp1.
MATERIALS AND METHODS
Construction of mutants, protein expression, and purification
A series of mutants were constructed using the site-directed mutagenesis method. Six full-length Agp1 mutants A362C, K514C, H554C, R603C, I653C, and V674C are described in this paper. These mutated proteins were expressed in Escherichia coli XL1-Blue host cell at 18oC. 50 μM IPTG was added to the cell culture to induce protein expression. The protein both wildtype and the various mutants were purified using Ni2+-NTA affinity column as described previously (Noack et al., 2007).
Protein labeling with fluorescence dye
Unlike the other case, where the protein can be directly labeled using fluorescence dyes, in this work the apoprotein was first assembled with biliverdin (BV) to form the holoprotein prior to the fluorescence labeling. The procedure was described in detail (Njimona, 2012).
The purified apoprotein was dissolved in 50 mM Tris-HCl buffer (pH 7.4, containing 300 mM NaCl and 5 mM EDTA), and the final concentration was ~10 μM (Kacprzak et al., 2017) used ~10:1 of protein to TCEP ratio to reduce the disulphide bond for 30 min at 25°C. The reduced apoprotein was assembled with ~3 times molar excess BV to form the holoprotein. Without removing BV, the holoprotein mixture was incubated in darkness with a 2-fold molar excess of dyes containing 1:1 equal mole of donor Atto495 and acceptor Atto565 for 2 h at 25°C. This reaction was stopped by adding 150-fold molar excess β-mercaptoethanol to react for 30 min. ThTlabeledoteins were separated from free dyes by combining precipitation of 50% ammonium sulfate with NAP-10 desalting column purification process. The purification procedure was repeated two times. As a control, the authors synthesized the single-labeled Agp1 mutants. All the labeled protein was loaded to 15% SDS-PAGE gel. Fluorescence imaging was detected using Safe Imager (Invitrogen Company) prior to protein staining.
Detection of histidine kinase activity
Phosphorylation experiments were carried out under blue-green safelight according to the procedure described in reference (Esteban et al., 2005). The concentration of the wild-type Agp1 or fluorescence-labeled holoprotein was ~0.4 mg/mL based on the absorbance at 703 nm. After 5 µL of each sample was irradiated with 655 nm red light (forming Pfr state) or kept in darkness (forming Pr state), 15 µL phosphorylation buffer containing 25 mM Tris-HCl, 5mM MgCl2, 4 mM mercaptoethanol, 50 mM KCl, 5% ethylene glycerol and 45 µM (50 MBq/mL) [g-32P] ATP was immediately added to each sample. The mixtures were then incubated at RT for 30 min. The phosphorylation reaction was quenched by addition of 10 µL SDS loading buffer (30% glycerol, 6% SDS, 300 mM DTT, 0.01% bromophenol blue, 240 mM Tris-HCl, pH 6.7).
Subsequently, 10 µL of the sample was loaded to 10% SDS-PAGE gel. Following electrophoresis, the labeled protein was transferred to PVDF membrane using a Trans-Blot semi-dry blot apparatus (Bio-Rad). After the membrane was then exposed to a phosphor-imager plate for about 1h, fluorescent imager analyzer FLA 2000 (Fuji) was used for quantification analysis. In order to see the Coomassie-staining protein bands, the membrane was firstly washed using 100% methanol, and then transferred and kept in water for a short time. Subsequently, the membrane was incubated in Simply Blue safe stain (Invitrogen) followed by shaking in 50% methanol until the protein band appeared. Phosphorylation experiments were also conducted for the holoproteins of six Agp1 mutants under the same condition.
Absorption and fluorescence spectra
Absorption spectra were recorded using on Jasco V-550 spectrometer. For the photoconversion experiment, the sample was irradiated for 2 min using a ~655 nm-emitting LED as described before (Kacprzak et al., 2017). Fluorescence spectra were recorded on Jasco FP-8300 spectrofluorometer. The excitation wavelength was fixed at 470 nm, and the excitation and emission slit widths were 2.5 nm for all the spectra. Because the fluorescence emission spectra of the dyes had a heavy spectral overlapping with the Q band absorption spectrum of biliverdin, when we measured the fluorescence emission spectra, the authors diluted the concentration of the labeled mutants to A703 of ~ 0.1 to avoid the inner-filter effect.
RESULTS
Generation of surface cysteine variants
In wild type Agp1 there exist three Cys residues, that is, Cys20, Cys279, and Cys295, in which Cys20 residue is essential for biliverdin binding and photoconversion. In the authors’ previous work, they had constructed one full-length Agp1-M8, which contained only Cys20, while the other two Cys279 and Cys295 were mutated to Ala and Ser, respectively. In this work, they created six cysteine single variants of Agp1 based on this mutant M8. Their mutagenesis sites were located close to the beginning of PHY domain (A362C), at the positions between PHY domain and HisKA (K514C, H554C), between HisKA and HATPase (R603C), and in the HATPase domain (I653C, V674C). SDS-PAGE analysis revealed that these mutated proteins were expressed mainly in the soluble form in E. coli XL1-Blue host cell, and the resultant supernatant could be purified using Ni2+-NTA column.
Absorption spectra of labeled products
Figure 1A-D showed the UV-vis and NIR absorption spectra of the single-labeled and double-labeled proteins. As a comparison, the absorption spectra of all the holoproteins were also measured. As seen from Figure 1A-1D, under the darkness both the labeled samples and the holoproteins exhibited the same strong absorption peak at ~ 704 nm in Pfr state. These results indicated that BV molecules had bcooperated with the apoproteins. As for the Atto dyes it was found that the bound Atto565 in the labeled sample had the maximum absorption peak (lmax) at 570 nm, while the free Atto565 exhibited lmax at 565 nm. Similar spectral red-shift phenomenon was observed for the Atto495 molecule, where the absorption peak shifted from 495 nm (free form) to 505 nm (bounded form). These data suggested that Atto565 molecule and Atto495 molecules had been bound to a more hydrophobic environment. Next, to check if the covalent bond had been formed between Atto dyes and the holoprotein, the authors denatured the labeled holoprotein using 1% SDS, and then used NAP-10 column to remove the free dyes. As seen from Figure 1E, in the collected eluting components the authors still observed the characteristic absorption peaks coming from these two dyes. This phenomenon suggested that there indeed occurred covalent binding between the dyes and the
holoprotein.

As demonstrated in Table 2, although maximum fluorescence emission peak lmax experienced no remarkable changes when changing from one mutant to another mutant, full width at half maxima (FWHM) varied from 27 nm (in K517C and in H554C) to 35 nm (A362C) and 41 nm (R603C). The widen spectrum probably reflected the heterogeneous distribution of the donor molecules especially in Agp1-R603C mutant. When the authors further investigated the relative fluorescence quantum yield, we found that the larger the FWHM, the lower the ff (Table 2).
Although they got some useful information, here they had to consider three possibilities for FRET: 1) FRET occurred between these dyes combined to the mutated Cys residue; 2) FRET occurred between the dyes combined to Cys20; 3) FRET occurred between the dyes combined to the mutated Cys and the dye combined to Cys20 residue in one subunit.
For the first case, the authors can use the mutants which did not contain Cys20, but the mutated Cys was still present to check the result. For the second case, they can use M8 that only contain Cys20 to compare the results. Both of these two FRET happened between the two subunits. It is known that hydrophobic interaction played a key role to stable the homodimer, so if the authors added enough SDS, the energy transfer will be dramatically diminished. This was what we observed for K517C mutant (Figure 6C). For the third case, the spectral changes can be checked after the protein has been fully denatured using 8M urea or 6M GnHCl. In other words, if the distance is available, they can still observe FRET under high concentration of SDS. It seems that in A362C mutant this intra-subunit energy transfer happened (Figure 10A, B and C).
In addition, the covalent binding was also confirmed by the fluorescence imaging results in Figure 2, where no matter the single-labeled or the double-labeled proteins could emit strong fluorescence after these proteins were separated by SDS-PAGE (seen in lanes 6-8 of Figure 2). Subsequently, the authors roughly calculated the labeling efficiency. Next, the authors calculated the fluorescence labeling efficiency based on the equation:

From the data listed in Table 1, it was realized that the double labeling efficiency of both R603C and V674C reached beyond 85%. K517C mutant had double-labeling efficiency of ~65%. In contrast, the double-labeling efficiency was less than ~50% in the case of A362C, K554C, and I653C. Meanwhile, we observed that although for all mono-labeled mutants, the acceptor Atto565 exhibited higher reactivity than the donor Atto495 did, double-labeled samples contained more dodonors

Fluorescence-labeled protein activity assay
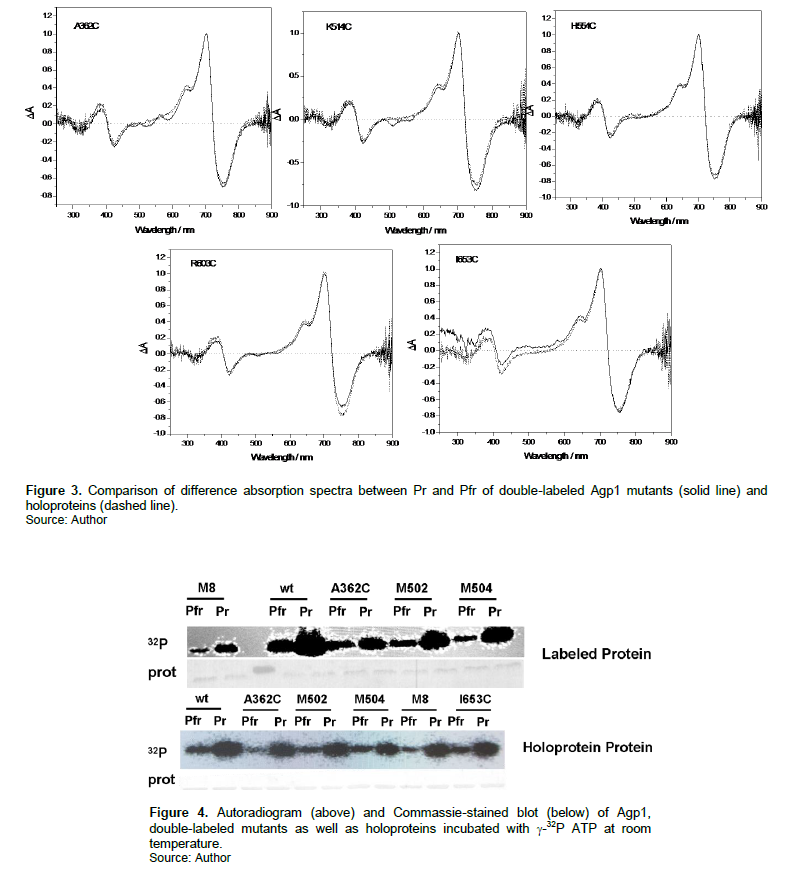
To test whether the fluorescence labeling exert some holoprotein and labeled protein. As shown in Figure 3, no significant changes were observed for the maximum absorbance peak of Pr or Pfr. Meanwhile, the absorbance ratio between Pr and Pfr band of the difference spectra experienced only slight changes when Agp1 holoproteins were combined with the dyes. It indicated that the photochemical activity of various Agp1 mutants is not influenced by the fluorescence dyes. The autophosphorylation activity assay in Figure 4, shows a similar pattern for both the wt Agp1 and the mutants. This demonstrated that the double-labeled Agp1 mutants can act as a light-regulated histidine kinase.
Fluorescence spectra of labeled proteins
Evidence for FRET in the double-labeled homodimer
As shown in Figure 5A, in Atto495-labeled K517C mutant the authors detected one wide and asymmetrical fluorescence emission peak extending from 500 nm to 700 nm following the 470 nm-excitation. Obviously, this peak originated from the donor molecule Atto495. As far as the acceptor molecule was concerned, in principle, it was expected that the acceptor would not be excited simultaneously when they excited the donor. However, in this work, the authors found that the excitation at 470 nm gave rise to one weak fluorescence emission peak at 591 nm (dashed line in Figure 5A), which was assigned to the Atto565 molecule. When the Atto495-labeled was mixed and the Atto565-labeled K517C mutant, the resultant fluorescence emission spectrum is almost identical to their linear combination, where one weak shoulder peak was observed from the Atto565 molecule. In contrast, in the double-labeled K517C mutant, the acceptor exhibits higher fluorescence intensity than the donor. Similar phenomena were observed for the other double-labeled mutants Fluorescence excitation spectra provided another evidence for FRET, where apart from the peak at 370 nm and the 570 nm, the absorbance at 500 nm made some contribution to the emission of the acceptor at 600 nm (the arrow shown in Figure 5B), indicating that the excited donor molecule could transfer the excitation energy to the acceptor (dotted line in Figure 5B). It was not the case for the Atto565-labeled and the intermolecular system. In addition, another piece of evidence to support FRET is the effect of SDS on the fluorescence emission spectra. As demonstrated in Figure 5C, the treatment of SDS gave rise to the decrease in fluorescence intensity of the acceptor, meanwhile, the fluorescence intensity of the donor recovered gradually with increasing the concentration of SDS. It suggested that the FRET phenomenon disappeared in a double-labeled K517C mutant with the presence of SDS. The fact that FRET happened in the double-labeled full-length Agp1 mutant helped to exclude the possibility that two subunits in Agp1 were arranged in the antiparallel form.

Fluorescence emission spectral changes during the photoconversion
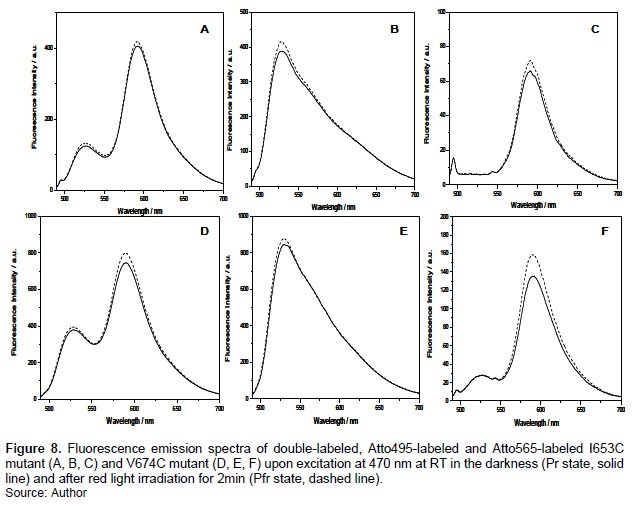
Figure 6A presented the fluorescence emission spectra of double-labeled A362C in the darkness (solid line) and after 2min-red light irradiation (dashed line) upon excitation at 470 nm. Obviously, the photoconversion from Pr to Pfr leads to an increase in the fluorescence intensity of both the donor and the acceptor. As a control, the authors also measured the spectral changes of the single-labeled sample under the same condition. As seen in Fig. 5B and 5C, no matter for the donor or the acceptor, their fluorescence emission intensity was enhanced upon illumination. Similar changes were observed for the K517C mutant (Figure 6D-F). Different from A362C and K517C mutant, however, no significant spectral changes were detected for the double-labeled H554C (Figure 7A) and double-labeled R603C (Figure 7D) upon red light illumination. When the single-labeled sample was detected, the authors observed similar results (Figure 7B-C and 7D-E). The same phenomenon was detected from I653C and V674C mutants, as described in Figure 8.

DISCUSSION
No full-length BphP structural information has been available for both Pr and Pfr mainly because it was rather difficult to get the high-quality 3D crystals of both Pr and Pfr state simultaneously. Therefore, some indirect spectroscopic methods are currently method of choice to understand these structures. In the previous work, the authors had to use MTSSL nitro oxide spin probe to label single Cys residue in various Agp1 mutants, and then measured dipole-dipole coupling using double electron electron resonance (DEER) technology. This method helped to determine the distance within 5-80 Å between two paramagnetic centers. The results showed that no major structural changes happened during the photoconversion of Agp1 mutant (Noack et al., 2007). Different from that case, in this paper we haveused another spectroscopic method, that is, FRET to get some structural information induced by light irradiation. FRET method has been used to investigate dimerization and inter-chromophore distance of Cph1 phytochrome from Synechocystis, where the BV analogue PEB and the natural chromophore PCB were used as FRET donor and acceptor, respectively. Both of them were combined to the chromophore-binding site (Otto et al., 2003). Different from their case, in this paper we aimed at employing FRET method to explore the structural changes happening in different domains of full-length Agp1 during the photoconversion, including PAS, GAF, PHY and histidine kinase domain.
Suitable FRET pairs were selected for these measurements. Firstly, taking into consideration that the maleimide function group had high reactivity with thiol groups, site-directed mutagenesis method was used to produce A362C, K514C, H554C, R603C, I653C and V674C mutants as described above. Secondly, because BV itself exhibited one strong absorption peak in 600-750 nm and one weak peak in 350 - 450 nm, in order to avoid the inner filter effect or the competition absorption from BV, Atto495 maleimide and Atto565 maleimide dyes was used as FRET pairs, whose absorption peaks were located in the 400-600 nm range and did not heavily overlap with the absorption peaks of BV.
Thirdly, it was known that the FRET energy transfer efficiency is strongly dependent on the distance between dye pair as well as the FÖrster radius Ro, therefore we roughly calculated the FÖrster radius Ro = ~57.9 Å between Atto495 donor and Atto565 acceptor. According to the reference (Kim et al., 2008), FRET method could provide reliable distance results only when the intermolecular distance between FRET pairs varied from 0.5 R0 - 1.5 R0 with the energy transfer efficiency of 8 - 98%. Therefore, it means that in our case, we could investigate the inter-subunits distance changes happening within 29Å - 87Å. Take A362C as an example. X-ray crystallographic data revealed that the inter-subunit distance is nearly ~ 39.5 Å and 45.9 Å for Pr state for Pfr, respectively. Within this range FRET is available to provide the distance information.
This phenomenon suggested that BV molecules had been incorporated with the apoprotein (solid line). Subsequently, the absorbance at ~703 nm decreased immediately following the addition of two times molar excess of Atto495 (Figure 9B), Atto565 (Figure 9C), or their 1:1 mixture (Figure 9D) to initiate the labeling experiments, respectively. A similar phenomenon was observed when we only added the same amount of DMSO solvent that had been used to dissolve the dyes (Figure 9B). It indicated that the decrease of A703 might be due to the fast micro-environmental changes of the BV-binding pocket induced by solvent. During the subsequent 2h labeling reactions, A703 nm experienced no remarkable changes were seen in Figure 9A to D. It inferred that the presence of 2-fold of the dyes would not lead to the displacement of BV molecules by FRET pairs away from the binding site. It seemed reasonable because Cys20 was located in the hydrophobic chromophore-binding pocket, and therefore it could not be easily attacked by the FRET pairs.


The fluorescence labeling efficiency was also analyzed as shown in Table1, and found that FRET pairs exhibited different reactivity against Cys residues located in different domains. The protein sample contains a mixture of unlabeled holoprotein (00) and labeled holoprotein (AA or DD). In contrast, there coexisted AA, DD, AD, DA as well as non-labeled samples in the double-labeled mutants. In the latter work, although we paid more attention to the double-labeled samples, as a control, we also performed the same experiment on the single-labeled samples.
Next, it was necessary to test if the fluorescence labeling would affect the photoconversion behavior or biological activity of Agp1 mutants. As shown in Figure 3, the light-induced difference absorption spectral data revealed that the photochemical activity of various Agp1 holoproteins was not influenced by the external FRET pairs. As for the biological activity, the authors detected the histidine kinase activity by using g-32P ATP. It was found from Figure 4 that in the labeled sample, Pr displayed stronger autophosphorylation activity than Pfr form. This result was almost identical to the wt Agp1.
Following the biological activity assay, the static fluorescence spectroscopic method was used to check the fluorescence emission of double-labeled mutants. By comparing the intermolecular and intramolecular fluorescence emission spectra, as well as the fluorescence excitation spectra, we concluded that as we had expected, the fluorescence resonance energy transfer happened from the Atto495 to Atto565 in all mutants this confirms parallel orientation of dimeric Agp1 subunits.
The authors tried to get some information from the spectra of monolabeled samples. As demonstrated in Table 1, Atto495-labeled R603C exhibited the maximum FWHM of ~44 nm among all samples; meanwhile Atto495-labeled A362C much displayed larger FWHM than other mutants. It suggested that there might co-exist heterogeneous distribution of Atto495 molecules in Atto495-labeled R603C and A362C most probably resulting from the larger flexibility in such domains. However, it was surprising that no similar results were observed for Atto565-labeled samples As shown in Figure 6B and 6E, the conversion from Pfr to Pr led to a remarkable increase in fluorescence intensity at 572 nm in both Atto495 labelled A326C mutant and Atto495 labelled H517C mutant. In contrast, no significant changes were observed for Atto495 labelled H554C, Atto495 LABELED R603C as well as Atto495 labelled I653C and V674Cc. There are changes in the protein environment as seen by the Pr® Pfr changes of the monolabeled samples. Different from the major changes predicted from the models, there are no or minor changes.
In a summary the authors found that: (1) FRET efficiency changed from one position to another position. When they compared A362C, K517C, and H554C, they observed that in K517C energy transfer efficiency was the highest. According to the crystallographic data, the distance at site 517 between two subunits was nearly 40 nm, and (2) in comparison with Pr, Pfr form displayed higher energy transfer efficiency. It is inferred that the distance would become shorter in the Pfr state. As for the R603C mutant, this method could not be used because its donor exhibited some unusual spectral behavior.
CONCLUSION
Although the labeling strategy is simpler for DEER technology because only one kind of interacting labels is needed while FRET pairs are required, the authors can obtain some orientation information by measuring the fluorescence polarization or anisotropy in FRET measurement. As described in the introduction, PHY domain experienced some variations during the photoconversion, so they constructed one mutant targeting PHY domain. Additionally, they suspected that like the other histidine kinase, some changes happened in His KA and ATPmase domain. We mainly focused on PHY, helix, ATPmase domain and could identify some of these changes.
ACKNOWLEDGEMENT
Special thanks to the laboratories of Prof. Tilman Lamparter and Ann Ulrich in Karlsruhe Institute of Science and Technology in which some of the experiments were performed. We also thank center for international migration (CIM) in GIZ for partial financial support.
CONFLICT OF INTERESTS
The authors have not declared any conflicts of interests.
REFERENCES
|
Andel F, Lagarias JC, Mathies RA (1996). Resonance raman analysis of chromophore structure in the lumi-R photoproduct of phytochrome. Biochemistry 35(50):15997-16008. |
|
|
Barkovits K, Schubert B, Heine S, Scheer M, Frankenberg-Dinkel N (2011). Function of the bacteriophytochrome BphP in the RpoS/Las quorum-sensing network of Pseudomonas aeruginosa. Microbilogoy 157(6):1651-1664. |
|
|
Bellini D, Papiz MZ (2012). Structure of a bacteriophytochrome and light-stimulated protomer swapping with a gene repressor. Structure 20(8):1436-1446. |
|
|
Bhoo SH, Davis SJ, Walker J, Karniol B, Vierstra RD (2001). Bacteriophytochromes are photochromic histidine kinases using a biliverdin chromophore. Nature 414(6865):776-779. |
|
|
Burgie ES, Bussell AN, Walker JM, Dubiel K, Vierstra RD (2014). Crystal structure of the photosensing module from a red/far-red light-absorbing plant phytochrome. Proceedings of the National Academy of Sciences 111(28):10179-10184 |
|
|
Burgie ES, Clinger JA, Miller MD, Brewster AS, Aller P, Butryn A, Fuller FD, Gul S, Young ID, Pham CC, Kim IS (2020). Photoreversible interconversion of a phytochrome photosensory module in the crystalline state. Proceedings of the National Academy of Sciences 117(1):300-307. |
|
|
Dago AE, Schug A, Procaccini A, Hoch JA, Weigt M, Szurmant H (2012). Structural basis of histidine kinase autophosphorylation deduced by integrating genomics, molecular dynamics, and mutagenesis. Proceedings of the National Academy of Sciences 109(26):E1733-1742. |
|
|
Davis SJ, Veneer AV, Vierstra RD (1999). Bacteriophytochromes: Phytochrome-like photoreceptors from nonphotosynthetic eubacteria. Science 286:2517-2520. |
|
|
Essen LO, Mailliet J, Hughes J (2008). The structure of a complete phytochrome sensory module in the Pr ground state. Proceedings of the National Academy of Sciences 105(38):14709-14714. |
|
|
Esteban B, Carrascal M, Abian J, Lamparter T (2005). Light-induced conformational changes of cyanobacterial phytochrome Cph1 probed by limited proteolysis and autophosphorylation. Biochemistry 44(2):450-461. |
|
|
Fixen KR, Baker AW, Stojkovic EA, Beatty JT, Harwood CS (2014). Apo-bacteriophytochromes modulate bacterial photosynthesis in response to low light. Proceedings of the National Academy of Sciences 111(2):237-244 |
|
|
Giraud E, Fardoux J, Fourrier N, Hannibal L, Genty B, Bouyer P, Dreyfus B, Verméglio A (2002). Bacteriophytochrome controls photosystem synthesis in anoxygenic bacteria. Nature 417(6885):202-205. |
|
|
Giraud E, Verméglio A (2008). Bacteriophytochromes in anoxygenic photosynthetic bacteria. Photosynthesis Research 97(2):141-153. |
|
|
Giraud E, Verméglio A (2012). Isolation and Light-Stimulated Expression of Canthaxanthin and Spirilloxanthin Biosynthesis Genes from the Photosynthetic Bacterium Bradyrhizobium sp. Strain ORS278. In Microbial Carotenoids from Bacteria and Microalgae. Humana Press, Totowa, NJ. Pp. 173-183. |
|
|
Heyne K, Herbst J, Stehlik D, Esteban B, Lamparter T, Hughes J, Diller R (2002). Ultrafast dynamics of phytochrome from the cyanobacterium synechocystis, reconstituted with phycocyanobilin and phycoerythrobilin. Biophysical Journal 82(2):1004-1016. |
|
|
Hubschmann T, Jorissen HJ, Bo¨rner T, Gartner W, Tandeau de Marsac N (2001). Phosphorylation of proteins in the light-dependent signalling pathway of a filamentous cyanobacterium. European Journal of Biochemistry 268:3383-3389. |
|
|
Kacprzak S, Njimona I, Renz A, Feng J, Reijerse E, Lubitz W, Krauss N, Scheerer P, Nagano S, Lamparter T, Weber S. Intersubunit distances in full-length, dimeric, bacterial phytochrome Agp1, as measured by pulsed electron-electron double resonance (PELDOR) between different spin label positions, remain unchanged upon photoconversion. Journal of Biological Chemistry 292(18):7598-7606. |
|
|
Karniol B, Vierstra RD (2003). The pair of bacteriophytochrome from Agrobacterium tumefaciens are histidine kinases with opposing photobiological properties. Proceedings of the National Academy of Sciences 100:2807-2812. |
|
|
Kim Y, Ho SO, Gassman NR, Korlann Y, Landorf EV, Collart FR, Weiss S. Efficient site-specific labeling of proteins via cysteines. Bioconjugate Chemistry 19(3):786-791. |
|
|
Kraskov A, Nguyen AD, Goerling J, Buhrke D, Velazquez Escobar F, Fernandez Lopez M, Michael N, Sauthof L, Schmidt A, Piwowarski P, Yang Y, Stensitzki T, Adam S, Bartl F, Schapiro I, Heyne K, Siebert F, Scheerer P, Mroginski MA, Hildebrandt P (2020). Intramolecular proton transfer controls protein structural changes in phytochrome. Biochemistry 59(9):1023-1037. |
|
|
Lamparter T, Michael N, Mittmann F, Esteban B (2002). Phytochrome from Agrobacterium tumefaciens has unusual spectral properties and reveals an N-terminal chromophore attachment site. Proceedings of the National Academy of Sciences 99(18):11628-11633. |
|
|
Li H, Zhang J, Vierstra RD, Li H (2010). Quaternary organization of a phytochrome dimer as revealed by cryoelectron microscopy. Proceedings of the National Academy of Sciences 107(24):10872-10877. |
|
|
Marina A, Waldburger CD, Hendrickson WA (2005). Structure of the entire cytoplasmic portion of a sensor histidine-kinase protein. EMBO Journal 24(24):4247-4259. |
|
|
Matysik J, Hildebrandt P, Schlamann W, Braslavsky SE, Schaffner K (1995). Fourier-transform resonance Raman spectroscopy of intermediates of the phytochrome photocycle. Biochemistry 34(33):10497-10507. |
|
|
Njimona I (2012). Molecular Studies on Light-induced Protein Conformational Changes on Agrobacterium Tumefaciens Phytochrome, Agp1. Mensch und Buch. |
|
|
Njimona I, Lamparter T (2011). Temperature effects on Agrobacterium phytochrome Agp1. Plos ONE 6(10):e25977. |
|
|
Noack S, Michael N, Rosen R, Lamparter T (2007). Protein conformational changes of Agrobacterium phytochrome Agp1 during chromophore assembly and photoconversion. Biochemistry 46(13):4146-4176. |
|
|
Otto H, Lamparter T, Borucki B, Hughes J, Heyn MP (2003). Dimerization and inter-chromophore distance of Cph1 phytochrome from Synechocystis, as monitored by fluorescence homo and hetero energy transfer. Biochemistry 42(19):5885-5895. |
|
|
Takala H, Björling A, Berntsson O, Lehtivuori H, Niebling S, Hoernke M, Kosheleva I, Henning R, Menzel A, Ihalainen JA, Westenhoff S (2014). Signal amplification and transduction in phytochrome photosensors. Nature 509(7499):245-248. |
|
|
Tasler R, Moises T, Frankenberg-Dinkel N (2005). Biochemical and spectroscopic characterization of the bacterial phytochrome of Pseudomonas aeruginosa. FEBS Journal 272(8):1927-1936. |
|
|
van Thor JJ, Ronayne KL, Towrie M (2007). Formation of the early photoproduct lumi-R of cyanobacterial phytochrome cph1 observed by ultrafast mid-infrared spectroscopy. Journal of the American Chemical Society 129(1):126-132. |
|
|
Wagner JR, Brunzelle JS, Forest KT, Vierstra RD (2005). A light-sensing knot revealed by the structure of the chromophore-binding domain of phytochrome. Nature 438(7066):325-331. |
|
|
Yang X, Kuk J, Moffat K (2008). Crystal structure of Pseudomonas aeruginosa bacteriophytochrome: photoconversion and signal transduction. Proceedings of the National Academy of Sciences 105(38):14715-14720. |
|
|
Yang X, Stojkovi? EA, Kuk J, Moffat K (2007). Crystal structure of the chromophore binding domain of an unusual bacteriophytochrome, RpBphP3, reveals residues that modulate photoconversion. Proceedings of the National Academy of Sciences 104(30):12571-12576. |
|
|
Yeh KC, Wu SH, Murphy JT, Lagarias JC (1997). A cyanobacterial phytochrome two-component light sensory system. Science 277(5331):1505-1508. |
|
Copyright © 2024 Author(s) retain the copyright of this article.
This article is published under the terms of the Creative Commons Attribution License 4.0


