ABSTRACT
Development of improved varieties of sweet potato to meet specific end users in the sub-Saharan African region has the potential of transforming the crop’s market, consumption and health benefits. Molecular biology techniques such as fingerprinting are key to crop improvement, and critical for numerous genetic studies. This study, carried out in Ghana, seeks to determine genetic relatedness among two populations of sweet potato (released and elite), as well as to identify polymorphic and informative markers for diversity studies. Twenty expressed sequence tags-simple sequence repeat (EST-SSR) markers were used for analysis of DNA assembled. A total of 169 alleles were obtained, with an average of 8.5 alleles per locus. Pairwise genetic distance among genotypes ranged from 12 – 89. GenAlex v6.4 analysis showed that a higher genetic diversity existed within elite genotypes than the released lines. Results analyzed using Popgene version 1.31 software indicated that on the basis of both populations studied, EST-SSR markers utilized were very polymorphic (95%) and showed genetic diversity (I =0.888, He= 0.548) suggesting high heterozygosity in the collected varieties. The overall Fit (0.372%) and Fis (0.088%) suggest high genetic diversity within populations, and gene flow (1.95) indicate an exchange of genes between released sweet potatoes and elite ones. Ewens-Watterson test was conducted to test the neutrality. From the results obtained, markers CB329940, CB330477 and CB330936 showed high allelic polymorphism among varieties used and were recommended to be included in diversity studies.
Key words: Genetic diversity, genetic relatedness, expressed sequence tags-simple sequence repeat (EST-SSR), populations, released sweet potato, elite sweet potato.
Sweet potato (Ipomoea batatas (L.) Lam), belongs to the family Convolvulaceae. The crop has enormous potentials to be used as a staple and/or cash crop for food security, poverty reduction, industry, livestock feed and export in Ghana as well as the sub-region. The expanded use of the orange-fleshed varieties, which contain high amounts of beta-carotene (a precursor for vitamin A) in food-based nutritional programmes can significantly serve as an inexpensive affordable source for combating vitamin-A deficiency (Kurabachew, 2015). Sweet potato (Ipomoea batatas (L.) Lam.) (Batatas an Arawak name) was domesticated some 5000 years ago in tropical America (Austin, 1988). Austin (1988) postulated that sweet potato and its wild Ipomoea species originate from regions between the Yucatan Peninsula of Mexico and the Orinoco River in Venezuela. This postulation was based on the morphological characters, however, based on molecular markers, the highest diversity of species, was found in Central America (Huang and Sun, 2000). Economically, sweet potato production worldwide is ranked seventh. Cultivation of the crop covers approximately 9 million hectares, with yield of 140 million tons, averaging about 14 ton/ha (FAOSTAT, 2001). Developing countries, account for over 95% of the world’s production of sweetpotato, with Asia leading, followed by Africa and then the rest of the world (80, 15 and 5% respectively) (Bottema, 1992; FAO, 2001). Sweet potato clones found in Pacific Islands and other tropical countries mostly produce flowers, in inflorescences, clusters of up to 22 buds grow out of the leaf axils. The flowers are composed of stigma on top of the pistil (the female part) and 5 anthers on top of the 5 stamens (the male parts), and usually, they open once, soon after daybreak, and fades by noon. Different clones have different stamen length, where the stamens are shorter than the pistil, pollination occurs easily otherwise it is difficult. Most clones have some extent of incompatibility hence self-fertilization. It is therefore difficult to obtain seeds from crosses between certain parents, due to cross-incompatibility (Wilson et al., 1989). The crop is mostly cultivated by means of the vegetative vine.
The development of specific varieties to meet specific end uses in Ghana and the sub-region has the potential of transforming the crop’s production, uses, market potential, consumption and health benefits through a significant diversification in product forms and better integration into smallholder farming systems. Hence, there is need to develop varieties for specific end-users that are accepted by farmers, consumers and agro-industrialists. These varieties to be developed must be high yielding, pests and disease tolerant, store better, posses high dry matter, and high nutritive value (such as high beta-carotene, protein), good for food and industrial products. Crop variety development requires comprehensive breeding programs and this may take several years to come up with a variety of interest as morphological and biochemical technique are the applications used to characterize accessions. However, with the advent of molecular marker application, the period for developing a variety can be drastically reduced and the PCR based technology facilitates tagging and introgression of traits of interest. Hence, the development of molecular markers that facilitate the analysis of genetic traits is important for crop improvement (Gupta et al., 1999). Characteristics such as unlimited number of markers, absence of environmental influence, great number of polymorphic loci, access to contribution of both parents and possibility of comparing genotypes based on the DNA, make molecular markers very powerful for genetic diversity estimates (Park et al., 2009). One of the highly utilized molecular marker systems is microsatellite, which is also called simple sequence repeats (SSRs). These are small tandemly repeats sequence (1-6 bp) that are widely dispersed in eukaryotic genomes (Powell et al., 1996). Microsatellites also show Mendelian inheritance and co-dominance. It has high level of polymorphism (Powell et al., 1996) and has been used in forensic studies, cultivar identification, evolutionary studies and genetic diversity analysis (Roder et al., 1998; Buteler et al., 1999). In recent times, some studies in fingerprinting used microsatellites derived from expressed sequence tags (EST) database.
Expressed sequence tags are small pieces of DNA sequence, usually 200 to 500 nucleotides long generated by sequencing either one or both ends of an expressed gene from a cDNA library. This strategy is an extremely efficient way to find new genes (Kim et al., 2016). It is efficient for comparing gene diversity in different organisms, gene evolution studies, searching databases for putative orthologues, development of probes for gene expression studies and detection of SNPs and are associated with particular traits (Hanna et al., 2005; Zhou et al., 2015; Khimoun et al., 2017). Thus, molecular markers provide critical and indispensable information required for plant breeding programmes. This information highly complements morphological data and hastens the varietal selection process. Studies by Roullier et al. (2013) analyzing the origin of sweet potato in New Guinea utilized both chloroplast and nuclear microsatellites. Su et al. (2017) carried out general assessment of population structure and genetic diversity using specific length amplified fragment (SLAF) sequences, which reported the most saturated single nucleotide polymorphism (SNP) markers, revealing large variations within accessions. Hu et al. (2004) developed and characterized sweet potato microsatellite markers. The study developed 151 primer pairs, which obtained 120 scorable microsatellites. Seventy five EST SSR loci showed length polymorphism and 71% were associated with some genes. Expressed sequence tags (EST) markers belong to transcribed regions within the genome and are expected to be highly conserved and may be associated with genes which may have known functions. The present study used EST SSR markers to establish the genetic diversity and differentiation among populations of released sweet potato varieties in Ghana and other elite varieties assembled locally and from abroad by the breeding program for crop improvement. It also aimed to assess the level of polymorphism of EST-SSRs on some varieties of sweet potato and recommend the efficient ones for future studies.
Source of sweet potato accessions
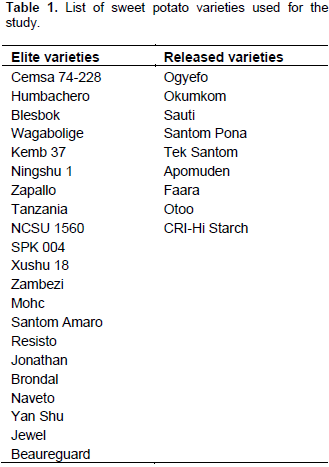
Plant materials for the study (Table 1) were obtained from the CSIR-CRI sweet potato breeding program. Released varieties comprised of sweet potato varieties which the breeding team had evaluated comprehensively on the field and officially approved as known varieties by the National Varietal release committee in Ghana. The elite varieties are accessions with promising attributes which are under evaluation by the breeding research team.

DNA extraction and PCR
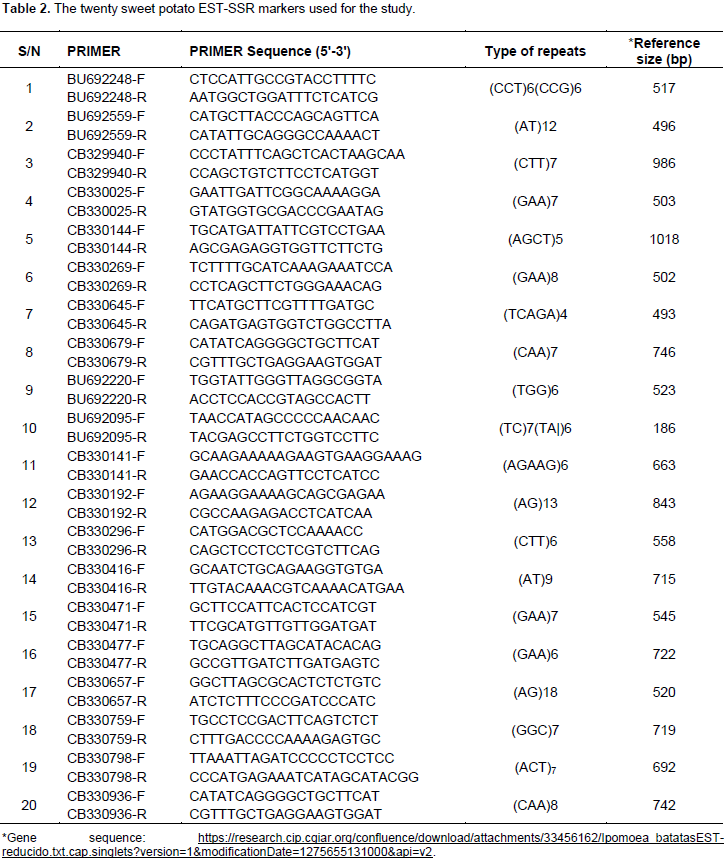
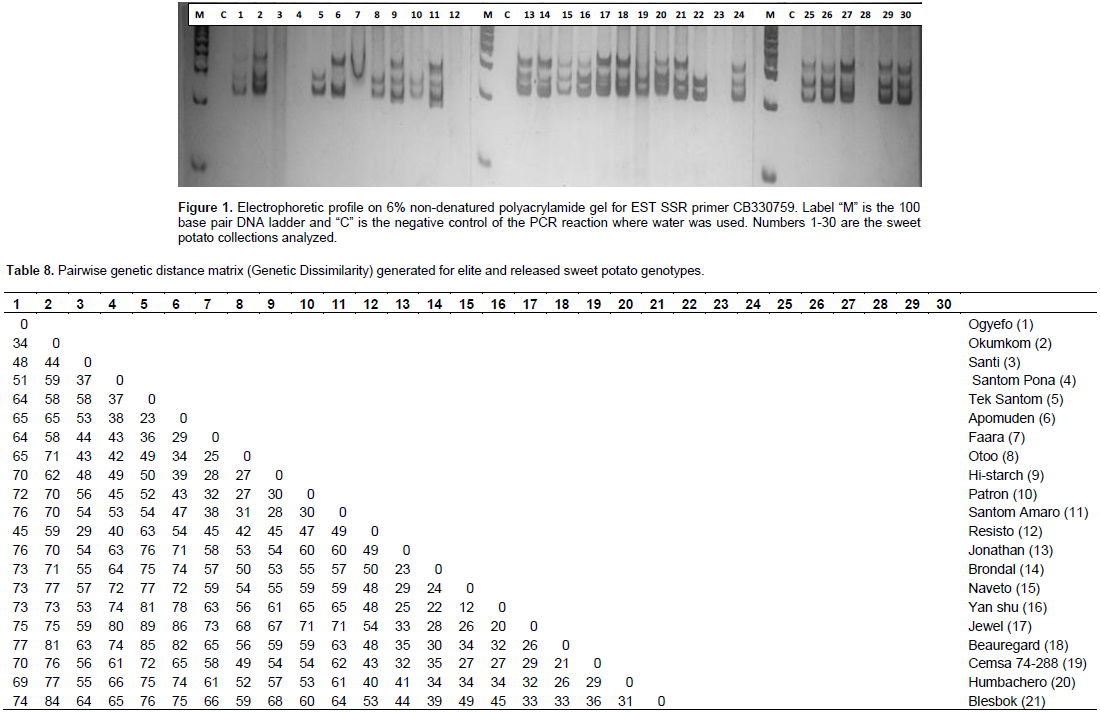
Vine cuttings (3-4 nodes) of 21 elite and nine released sweet potato varieties (Table 1) were grown in pots and two-week old leaves collected for DNA extraction using modified protocol of Egnin et al. (1998). Genomic DNA was run on 0.8% agarose gel to determine the quality. Twenty sweet potato EST SSR markers (Table 2) were used for the diversity studies (He et al., 1995; Hu et al., 2004). PCR amplification reaction volume of 10 μL was set up separately for each accession containing 50 ng template DNA, 1× PCR buffer, 1.5 mM MgCl2, 0.2 mM dNTP, 250 nM each of forward and reverse primers and 0.25 U Taq polymerase nuclease-free water was added to make a final volume of 10 μL per reaction. Gen Amp PCR System 9700 PCR was used and cycling conditions comprised of initial denaturation at 95°C for two min, 30 cycles of denaturation at 95°C for 1 min, annealing at 55°C for 1 min, extension at 72°C for one minute, and a final extension for 10 min at 72°C and holding at 4°C was included. The products of PCR were run on 6% non-denatured polyacrylamide gel.
Bands scoring
Following PCR with 20 EST SSR primers and resolution in polyacrylamide gel visualized by silver staining, the amplified EST-SSR DNA bands representing different alleles were scored guided by 50 base pair ladder to indicate the corresponding band sizes as alleles. To conduct POPGENE analysis, the scored ampicons were recorded as heterozygous genotypes (AB, AC, BC.. .) data. Based on amplification, an allele was recorded as present (1) or absent (0) for GenAlEx v6.4 analysis.
Data analysis
Genetic diversity parameters calculated were average observed allele number (Na), percentage of polymorphic loci (P), observed heterozygosity (Ho), expected heterozygosity (He), Nei heterozygosity (Nei He), Shannon’s diversity index (I) and gene flow (Nm) to estimate the level of genetic diversity (Cao et al., 2006). The F-statistics, Fis, Fit and Fst, (Cao et al., 2006) were also computed for polymorphic loci to test for the deviation from Hardy-Weinberg equilibrium and to estimate genetic differentiation among the sweet potato populations under study. The out-crossing rate [t = (1-Fit)/(1 + Fit)] was calculated based on the Fit values to estimate indirectly the mating pattern of the populations (Wright, 1978). All the genetic diversity and genetic differentiation parameters calculations were performed using POPGENE version 1.31 software (Yeh et al., 1999). Popgene is a Microsoft Window-based computer package for the analysis of genetic variation within and among natural populations (Yeh et al., 1999), where data was scored as co-dominate diploid. Furthermore, the genotype banding patterns were converted to ‘1’ (present) and ‘0’ (absence) matrix and subjected to analysis using GenAlEx v6.4 (Peakall and Smouse, 2012) to estimate the genetic diversity among the genotypes. First, pairwise genetic distance matrix was generated between the genotypes. Then, analysis of molecular variance (AMOVA) was done to test significant intra-population and inter-population molecular variance, as well the significance of the Pairwise Population distances (PhiPT) among the populations based on 9,999 permutations. Finally, principal coordinate analysis (PCoA) was used to visualize the genetic diversity generated by the EST markers for each individual genotype.
Genetic diversity and polymorphism among sweet potato varieties
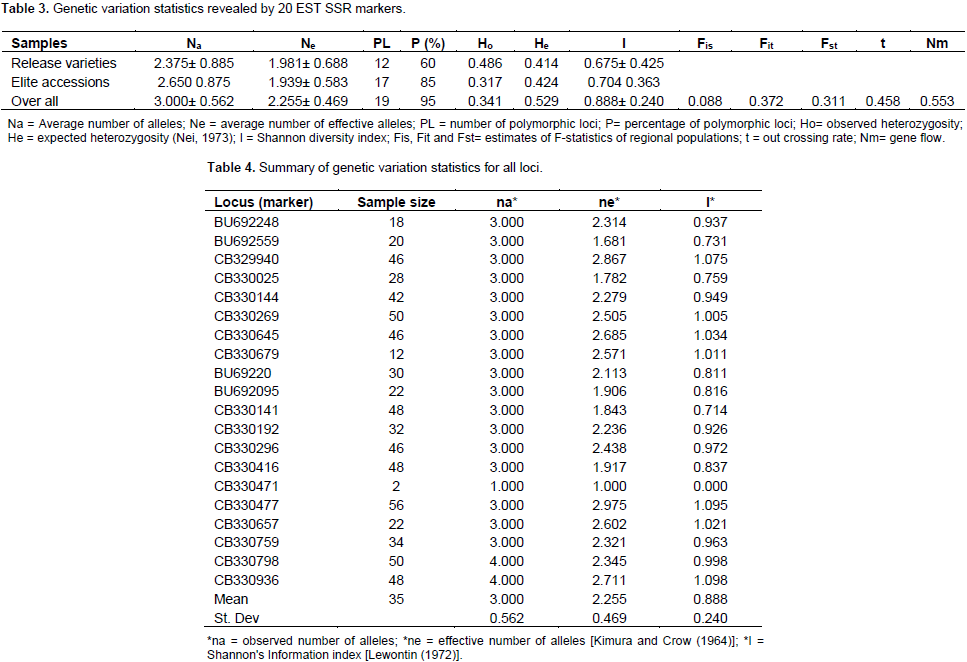
Establishing genetic relatedness among accessions is critical in any breeding program and this can be obtained by using molecular markers. This current study reports the analysis based on released and elite varieties as two sets of populations. According to the results generated using 20 EST SSR (Table 3) analysis with Popgene version 1.31, on basis of the released varieties population only, 12 out of the twenty loci representing 60% were found to be polymorphic. The observed number and effective number of alleles were 2.357 ± 0.885 of alleles (na), and 1.981 ± 0.688 (ne), respectively and mean genetic diversity index was (I) 0.675 ± 0.425. On the basis of the elite population, 2.65 ± 0.875 observed number of alleles (na), 1.939 ± 0.583 effective number of alleles (ne) and a mean genetic diversity index of (I) 0.705 ± 0.3630 were obtained. Seventeen out of the twenty loci (85%) were found to be polymorphic (Table 3). The EST SSR were thus less polymorphic in the released varieties than among the elite varieties, and this could be due to selecting preferences breeders use to select varieties for release. Overall, only one locus was not polymorphic, presenting 95% of the loci as polymorphic (Table 4). The markers (loci) used were most polymorphic when all samples were analyzed together and least polymorphic when the released varieties population was analysed.

Observed number of alleles (na) is the actual number of alleles in a population and effective number of alleles is the number of equally frequent alleles required to obtain the same expected heterozygosity (Nei, 1973) in population being studied (Yeh et al., 1999; Sharma et al., 2016). These values were low in the population of released varieties. Kim et al. (2016) examining the polymorphism of EST-SSR markers in cultivated sweet potato reported that 68.9% were polymorphic among the 20 cultivars. Genetic differentiation among the elite and released varieties of sweet potato populations studied revealed observed heterozygosity (Ho), expected heterozygosity (He) and Nei’s expected heterozygosity (Nei’s He) of 0.0.341, 0.548 and 0.529, respectively (Table 3). Higher observed heterozygosity values of 0.71 (Rodriguez-Bonilla et al., 2014) and 0.75 (Roullier et al., 2013) have been reported for sweet potato populations studied in Pueto Rico and Kenya, respectively. Some estimated genetic variability parameters for the two sub-populations interestingly showed some level of uniform distribution in PL, P (%), He, Ho and Nei He. Nevertheless, genetic diversity scores recorded by twelve loci among the released varieties (Table 1) were higher than values recorded for these sub-populations than the overall population (Table 2). The discrepancies in scores may be due to a high genetic overlap as a result of probable common ancestry or exchange of plant materials among breeders and growers at different geographical areas (Muller et al., 2001). In the overall population analysis (Table 4), the mean allele sample size was 35, with 3 ± 0.562 observed number of alleles (na), 2.255 ± 0.469 effective number of alleles (ne) and a mean genetic diversity index of (I) 0.888 ± 0.240. Comparatively, Ochieng et al. (2015) reported 1.552 mean number of effective alleles when 12 microsatellite markers were used to screen 68 sweet potato accessions.
Three loci namely CB329940, CB330477 and CB330936, recorded the highest genetic diversity index values in this study. Locus CB330471 on the other hand, recorded the least number of alleles (2) and I value. The high allelic polymorphism revealed by the EST-SSR markers and the absence of monomorphic locus indicates that the markers used were very informative, and vital for sweet potato genetic diversity studies especially loci CB330477 which has allele sample size of 56, with effective allele number of 2.975 and high diversity (I = 1.095), suggesting that in selecting EST-SSR markers for biodiversity studies of sweet potato, these loci should be given priority. High genetic diversity observed in this study when both populations were pulled together is consistent with finding obtained by Veasey et al. (2008) who also recorded high level of polymorphism (95.8%) with an average of six polymorphic bands per SSR primer for 78 sweet potato accessions in Brazil. Yang et al. (2014) also obtained 122 alleles with an average of 4.07 per primer pair through the use of 30 sweet potato SSR primers for evaluation of 380 accessions. This reveals richness of alleles and diversity in sweet potato collections. As discussed by Hu et al. (2004), some of these EST SSR primers used in this study have significant homology to known genes of other plants as revealed by BLASTx. The primer CB329940 (has high ne value of 2.867) has significant homology with cab 16 mRNA for major chlorophyll a/b binding protein in Nicotiana tobacum, and primer CB330471 (ne value of 1) has homology with putative wound – induced protein in Medicago sativa (Hu et al., 2004).
Genetic differentiation among populations
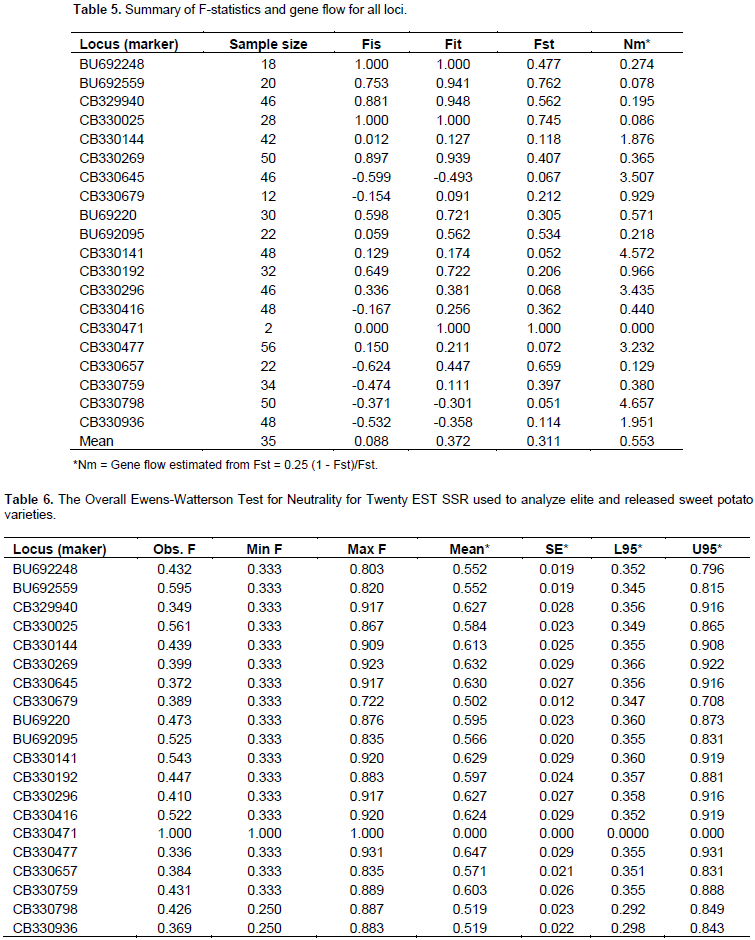
The mean estimates of F-statistics (Wright’s fixation indices) were determined to measure the deviations of genotypic frequencies using four parameters, within population inbreeding estimate (Fis), measurement of population differentiation (Fst), Total inbreeding estimate (Fit), and gene flow (Nem) among the accessions at the various loci as shown in Table 5. The overall genetic study showed low values of Fis (0.088) and Fit (0.372) among the population. The Fst value reveals that 31.14% of the total genetic diversity exists among the population. The study also revealed high overall outcrossing and gene flow rates of 0.458 and 0.553, respectively. Low values of Fit and Fis coupled with high outcrossing rate and gene flow values from the study clearly indicates a high degree of heterozygosity among the assembled accessions as evident by the recorded observed and expected heterozygosity (Table 4). Low scores of Fit and Fis, also suggest that the populations are void of inbreeding but contain far more heterozygotes than expected based on Hardy-Weinberg equilibrium. This is true to the fact that accessions used in this study are collections and have not been subjected to crosses by the breeding program. This may also be due to the fact that sweet potato is routinely propagated by the used of vegetative parts and the populations studied in this research had not been interbred. Thus, there was excessive outbreeding resulting in heterozygote advantage, probably due to having assembled the accessions from different sources. This level of heterozygosity may also be due to sharing of common parental genes among accessions. Fst score indicates that, there are far more similarities among sweet potato populations studied than differences and hence similar allelic frequencies within each population (Holsinger and Weir, 2009). Ewen’s Watterson test was performed to test the neutrality for the EST SSR markers. The statistics F (sum of squares of allele frequency) and limit (upper and lower) at 95% confidence region for the test were calculated using the algorithm by Manly method utilizing 1000 simulations as implemented in Popgene software (Table6). The overall test for neutrality across the two populations revealed that except at loci CB330471 and CB330477, all the observed F-values are within the lower and upper limits of the 95% confidence interval, and these are the two loci with the least and high genetic diversity index respectively, earlier reported on this study. Similar observations were made by Deepika (2012) (Table 6).
Pairwise genetic distance
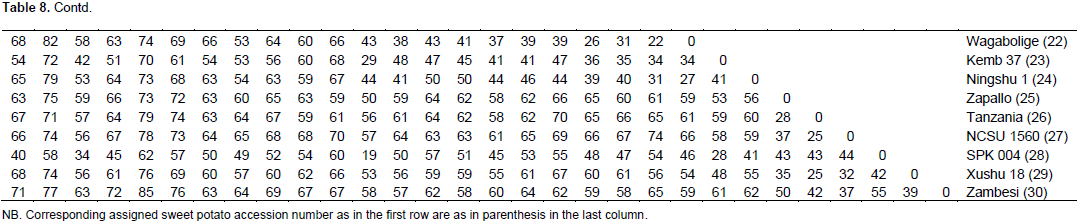
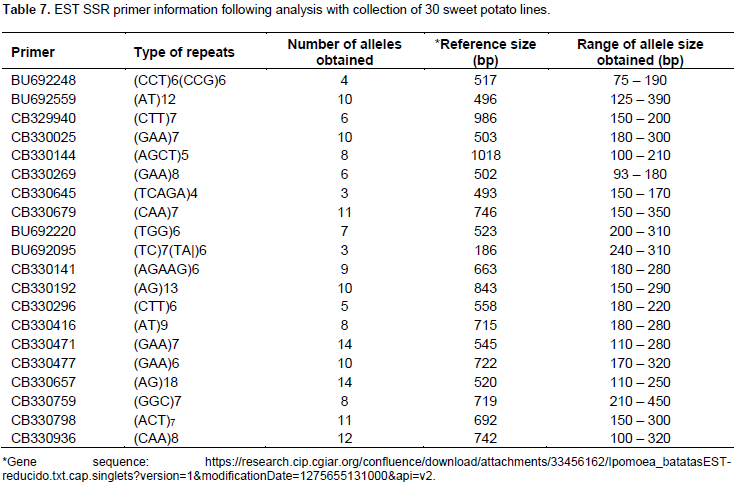
A total of 169 alleles were obtained using a set of 20 Expressed Sequence Tag (EST) markers (Table 7). An average of 8.5 alleles per locus were observed, a higher value (11.08) was reported where 23 SSR markers were used to study 137 sweet potato accessions (Rodriguez-Bonilla et al., 2014). The loci reporting the highest number of alleles (14) were CB330471 and CB330657. Incidentally the POPGENE analysis revealed that the locus CB330471 has the least number of effective alleles (Table 5) and that the overall test for neutrality across the two populations (Table 6) revealed that this loci does not have its observed F-values within the lower and upper limits of the 95% confidence interval. The allele sizes ranged from 75 (BU692248) to 450 bp (CB330759). On a scale of 0 – 100, the pairwise genetic distance among the genotypes ranged from 12 – 89 (Figure 1). The lowest genetic distance of 12 was observed between Naveto and Yan shu of the elite population, while the highest genetic distance of 89 was observed between Tek Santom and Jewel which belong to released and elite populations, respectively. This relatedness is higher than dissimilarity range of 0 – 69 reported by Somé et al., (2014), where SSR markers were used and 74 – 87 reported by Nair et al., (2016) where Start Condon Targeted (SCoT) primers were used for the studies. The result of the pairwise genetic distance shows that all the varieties are genetically distinct, with no duplicates among them, unlike report by Somé et al., (2014) where nine duplicates were identified among the collections. This report reveals the extent of relatedness and provides a guide for breeding program when selecting lines for crosses. These results (Table 8) indicate that to generate well diverse progeny in a breeding program, a cross between Tek Santom and Jewel or Beauregard (related to Tek Santom at distance unit of 85) should be considered.

Analysis of molecular variance (AMOVA)
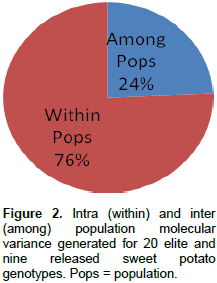
Analysis of molecular variance (AMOVA) generated an intra-population molecular variance of 76% and an inter population molecular variance of 24% for the elite and released populations (Figure 2). Analysis of molecular variance with SCoT primers, however, revealed 95.29% diversity within and 4.71% among populations used (Nair et al., 2016). The mean sum of squares within population (SSWP) was 20.37 for the released genotypes, and 21.87 for the elite genotypes indicating that there is a higher genetic diversity within the elite genotypes than the released lines. A pairwise PhiPT population value of 0.24 (P<0.001) observed between the released and elite genotypes, indicates that the two populations are significantly genetically distinct.
Principal coordinate analysis (PCoA)
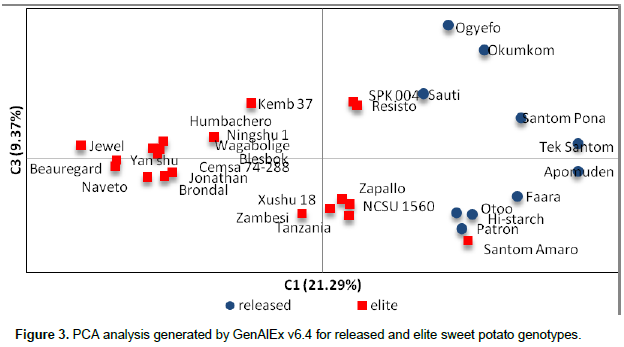
The principal component analysis (PCA) generated is presented in Figure 3. A clear separation was observed between the released and the elite genotypes. Samples were dispersed in all the four quadrats. The elite lines, Jewel, Beauregard, Brondal, Naveto, Jonathan, Yan shu, Ningshu, Humbachero, Wagabolige, Blesbok and Cemsa 74-288, clustered relatively closer. NCSU 1560, Zapallo, Xushu, Zambesi and Tanzania were in another cluster. Resisto and SPK 004 occupied a very close Eigen space. The fact that Santom Amaro clustered with the released genotypes Patron, Otoo and Hi-Starch indicates the possibility of being a close relative to these released lines. In an analysis of 68 sweet potato accessions with SSR markers, only one accession fell in the fourth quadrat (Ochieng et al, 2015), whereas PCoA confirmed weak differentiation among samples from New Guinea (Roullier et al., 2013). This clearly confirms the analysis using POPGENE that the two populations (elite and released collections) are distinct. It is evident that the elite lines are promising line which when introgressed into the released lines will generate diverged progeny.

CONCLUSION AND RECOMMENDATIONS
In conclusion, this study provides relevant information required for marker assisted breeding. There is genetic diversity among individuals of the two populations studied but with high level of heterozygosity. Three EST SSR markers with high value of effective alleles have been identified and are recommended for future studies. The study used two different software to establish the genetic relatedness of the two populations (released and elite) and confirmed that they are very diverse and are promising collections for the introgression of elite genes that could produce lines with resistance to biotic and abiotic stresses. Further studies should be done to determine contrasting traits or genes that exist among these genotypes since a lot of information can be obtained from BLASTx.
The authors have not declared any conflict of interests.
The authors appreciate the World Bank/Government of Ghana West Africa Agricultural Productivity Programme (WAAPP-GH) for the financial support. Sincere thanks also go to Prof. Marceline Egnin and He Gauhao for EST primers. They also thank Dr. Conrad Bonsi of the Tuskegee University and his team for their support in the research.
REFERENCES
|
Austin DF (1988). The taxonomy, evolution and genetic diversity of sweet potatoes and relate wild species. In. P. Gregory (ed.), Exploration, Maintenance and Utilization of Sweet Potato Genetic Resources. CIP, Lima, Peru, pp. 27-60.
|
|
|
|
Bottema T (1992). Rapid Market Appraisal, Issues and Expereince with Sweetpotato in Vietnam. In. Scott, G., S. Wiersema, and P. I. Ferguson (eds.) Product Development for Root and Tuber Crops, Vol. 1- Asia. International Potato Center, Lima, Peru.
|
|
|
|
|
Buteler MI, Jarret RL, LaBonte DR (1999). Sequence characterization of microsatellites in diploid and polyploid Ipomoea. Theoretical and Applied Genetics 99:123-132.
Crossref
|
|
|
|
|
Cao Q, Lu B-R, Xia H, Rong J, Sala F, Spada A, Grass F (2006). Genetic Diversity and Origin of Weedy Rice (Oryza sativa f. spontanea) Populations Found in North-eastern China Revealed by Simple Sequence Repeat (SSR) Markers. Annals of Botany 98:1241-1252.
Crossref
|
|
|
|
|
Deepika SRK (2012). Genetic diversity and bottleneck analysis of Indigenous Grey cattle Breeds of India based on Microsatellite data. International Journal of Biomedical and Life Sciences 3(1):174-183.
|
|
|
|
|
Egnin M, Mora A, Prakash CS (1998). Factors Enhancing Agrobacterium tumefaciens- Mediated Gene Transfer in Peanut (Arachis Hypogaea L.). In Vitro Cellular and Developmental Biology-Plants 34:310-318.
|
|
|
|
|
FAOSTAT (2001). 20\02
View
|
|
|
|
|
Gupta PK, Varshney RK, Sharma PC, Ramesh B (1999). Molecular markers and their applications in wheat breeding. Plant Breeding, 118:369-390.
Crossref
|
|
|
|
|
Hanna B, Rakoczy-Trojanowska M, Hromada A, Pietrzykowski R (2005). Efficiency of different PCR-based marker systems in assessing genetic diversity among winter rye (Secale cereale L.) inbred lines. Euphytica, 146:109-116.
Crossref
|
|
|
|
|
He G, Prakash CS, Jaret RL (1995). Analysis of genetic diversity in sweetpotato (Ipomoea batatas) germplasm collection using DNA amplification fingerprinting. Genome 38:938-945
Crossref
|
|
|
|
|
Holsinger KE, Weir BS (2009). Genetics in geographically structured populations: defining, estimating and interpreting F(ST). Nature Reviews. Genetics,10(9):639-650
Crossref
|
|
|
|
|
Hu J, Nakatani M, Mizuno K, Fujimura T (2004). Development and Characterization of Microsatellite Markers in Sweetpotato. Breeding Science, 54:177-188.

Crossref
|
|
|
|
|
Huang JC, Sun M (2000). Genetic diversity and relationships of sweetpotato and its wild relatives in Ipomoea series batatas (Convolvulaceae) as revealed by inter-simple sequence repeat (ISSR) and restriction analysis of chloroplast DNA. Theoretical And Applied Genetics, 100:1050-1060.
Crossref
|
|
|
|
|
Khimoun A, Ollivier A, Faivre B, Garnier S (2017). Level of genetic differentiation affects relative performances of expressed sequence tag and genomic SSRs. Molecular Ecology Resources, 17(5):893-903.
Crossref
|
|
|
|
|
Kim JH, Kim J-H. Jo WS, Ham JG, Chung IK, Kim KM (2016). Characterization and development of EST-SSR markers in sweet potato (Ipomea batatas (L.) Lam). 3 Biotech. 6:243.

|
|
|
|
|
Kimura M, Crow JF (1964). The number of alleles that can be maintained in a finite population Genetics 49(4):725-738.
|
|
|
|
|
Kurabachew H (2015). The Role of Orange Fleshed Sweet Potato (Ipomea batatas) for Combating Vitamin A Deficiency in Ethiopia: A Review. International Journal of Food Science and Nutrition Engineering, 5(3):141-146.
|
|
|
|
|
Lewontin RC (1972). Testing the theory of natural selection. Nature 236: 181-182.
Crossref
|
|
|
|
|
Muller M, Prosperi M, Santoni S, Ronfort J (2001). How mitochondrial DNA diversity can help to understand the dynamics of wild cultivated complexes; the case study of Medicago sativa in Spain. Molecular Ecology, 10(12):2753-2763.
Crossref
|
|
|
|
|
Nair AGH, Vidya P, Mohan C (2016). Analysis of genetic variability in sweet potato accessions using Start Codon Targeted (SCoT) polymorphism. International Journal of Biotechnology and Biochemistry 12(2):111-121.
|
|
|
|
|
Nei M (1973.) Analysis of gene diversity in subdivided populations. Proceedings of the National Academy of Sciences of the United States of America, 70:3321-3323.
Crossref
|
|
|
|
|
Ochieng LA, Githiri SM, Nyende BA, Murungi LK, Kimani NC, Macharia GK, Karanja L (2015). Analysis of the genetic diversity of selected East African sweet potato (Ipomea batatas [L.] Lam.) accessions using microsatellite markers. African Journal of Biotechnology, 14(34):2583-2591.
Crossref
|
|
|
|
|
Park YJ, Lee JK, Kim NS (2009). Simple Sequence Repeat Polymorphisms (SSRPs) for Evaluation of Molecular Diversity and Germplasm Classification of Minor Crops. Molecules 14:4546-4569.
Crossref
|
|
|
|
|
Peakall R, Smouse PE (2012). GenAlEx 6.5: genetic analysis in Excel. Population genetic software for teaching and research - an update. Bioinformatics, 28:2537-2539.
Crossref
|
|
|
|
|
Powell, W, Machray, GC, Provan, J (1996). Polymorphism Revealed by Simple Sequence Repeats. Trends in Plant Science 1(7): 215-222.
Crossref
|
|
|
|
|
Roder MS, Körzun V, Wendehake K, Plaschke J, Tixier M-H, Leroy P, Ganal MW (1998). A microsatellite map of wheat. Genetics, 149:2007-2023.
|
|
|
|
|
Rodriguez-Bonilla L, Cuevas HE, Montero-Rojas M, Bird-Pico F, Luciano-Rosario D, Sirtunga D (2014). Assessment of Genetic Diversity of Sweet Potato in Puerto Rico. PLoS ONE 9(12):e116184.
Crossref
|
|
|
|
|
Roullier C, Kambouo R, Paofa J, Mckey DB, Lebot V (2013). On the origin of sweet potato (Ipomoea batatas (L.) Lam) genetic diversity in New Guinea, a secondary center of diversity. Heredity, 110(6):94- 604.
Crossref
|
|
|
|
|
Sharma R, Kumar B, Arora R, Ahlawat S, Mishra AK, Tantia MS (2016). Genetic diversity estimates point to immediate efforts for conserving the endangered Tibetan sheep of India. Meta Gene, 8:14-20.
Crossref
|
|
|
|
|
Somé K, Gracen V, Asante I, Danquah EY, Ouedraogo JT, Baptiste TJ, Jerome B, Vianney TM (2014). Diversity analysis of sweet potato (Ipomoea batatas [L.] Lam) germplasm from Burkina Faso using morphological and simple sequence repeats markers. African Journal of Biotechnology, 13(6):729-742.
Crossref
|
|
|
|
|
Su W, Wang L, Lei J, Chai S, Liu Y, Yang Y, Yang X, Jiao C (2017). Genome-wide assessment of population structure and genetic diversity and development of a core germplasm set for sweet potato based on specific length amplified fragment (SLAF) sequencing. PLoS ONE 12(2):1-14 e0172066.
|
|
|
|
|
Veasey EA, Borges A, Rosa MS, Queiroz-Silva JR, Bressan E de A, Peroni N (2008). Genetic diversity in Brazilian sweet potato (Ipomoea batatas (L.) Lam., Solanales, Convolvulaceae) landraces assessed with microsatellite markers. Genetics and Molecular Biology, 31(3):725-733.
Crossref
|
|
|
|
|
Wilson JE, Pole FS, Smit NEJM, Taufatofua P, Rochers KD, Evensen CI, Evans DO (1989). Sweetpotato (Ipomoea batatas) breeding. Agro-Facts Crops IRETA Publications No__/89.
|
|
|
|
|
Wright S (1978). Variability within and among natural populations. Chicago: University of Chicago Press.
|
|
|
|
|
Yang XS, Su WJ, Wang LJ, Lei J, Chai SS, Liu QC (2014). Molecular Diversity and Genetic Structure of 380 Sweet potato accessions as revealed by SSR markers. Journal of Integrative Agriculture 14(4):633-641.
Crossref
|
|
|
|
|
Yeh FC, Yang RC, Boyle T (1999). Microsoft Window-based freeware for population genetic analysis (POPGENE), version 1.31.
|
|
|
|
|
Zhou R, Wu Z, Jiang FL, Liang M (2015). Comparison of gSSR and EST-SSR markers for analyzing genetic variability among tomato cultivars (Solanum lycopersicum L.). Genetics and Molecular Research, 14(4):13184-13194.
Crossref
|
|