ABSTRACT
Plantains are important staples in sub-Saharan Africa, however, production has been saddled by several constraints including pests and diseases and lack of improved technologies. In regard to genetic study, morphological characterization has identified about 100 local accessions to exist in Ghana. However, limited molecular characterization has been done on plantains. Characterization based on morphologic characteristics alone may be limited since expression of quantitative traits is subjective to strong environmental influence. Alternatively, molecular characterization techniques are capable of identifying polymorphism represented by differences in DNA sequences. The objective of this research was therefore to characterize local accessions of plantain using morphological and molecular techniques. This study sampled 38 local accessions from two regions in Ghana for characterization, taking into account all known morphological characteristics. Genomic DNA was isolated for molecular characterization using 18 SSR markers and 10 random primers. The SSR markers revealed 52 alleles, random primers revealed 67 alleles and the 29 morphological traits (loci) had 79 attributes (alleles). Similarity matrices of SSR markers revealed that 26.5% of the plantain accessions were duplicates; however, random amplified polymorphic DNA (RAPDs) system and morphological marker systems did not reveal any duplication among genotypes. Dendrogram generated on bases of both SSR and RAPDs indicated that a French plantain accession (Apem 01) and a False Horn accession (Apantu 26) were the most distantly related collections. None of the molecular marker methods used clearly clustered various phenotypically known collections into their respective distinct groups, although to some extent, this was demonstrated by morphological data set.
Key words: Dendrogram, genome, morphological, molecular, random amplified polymorphic DNA (RAPDs), simple sequence repeats (SSR).
Plantains are important starchy staples in sub-Saharan Africa and Ghana in particular. They are of great socio-economic importance in the country and very important food security crops in the marginal coastal zones of the country, both as energy-yielding staple, a source of micronutrients, pro-vitamin A and other minerals (Mapongmetsem et al., 2012; Dzomeku et al., 2011; Davey et al., 2009). However, plantain production has been saddled by several constraints which include pests, diseases and lack of improved cultivars (Hemeng and Banful, 1994). Plantain research has been going on in Ghana for the past two decades. Most of the research activities have been on agronomy, physiology and post-harvest. Several production technologies have been developed and disseminated to farmers (Olumba, 2014; Dzomeku et al., 2014). In attempts to overcome some of the problems associated with its production, the Ghanaian breeding program has introduced hybrids and two of them have been released to farmers (Hemeng and Banful, 1994). Evidence shows that intermediate French plantain without seed locally known as “Oniaba”, which is an elite Musa variety has a peculiar taste and high premium on the market, it is also early maturing, and a preferred variety in the confectionary industry for the production of plantain chip as snacks (Dzomeku et al., 2007). These characteristics may be genetic and could be incorporated into the breeding of appealing taste and early maturing cultivars.
The centre of origin of Musa species lies in South East Asia. The varieties that are used for commercial or subsistence production are predominantly triploid (2n =3x =33) cultivars that are evolutionary derived from crosses within and between diverse accessions of two diploid ancestor species, Musa acuminata Colla (A genome) and Musa balbisiana Colla (B genome). It is assumed that M. acuminata may comprise three genetic subspecies. Most banana cultivars and all plantain landraces have 33 chromosomes (2n = 3x). These triploid genotypes are virtually or completely sterile and develop their fruit by vegetative parthenocarpy (Simmonds, 1962). Diploid landraces and tetraploid cultivars (mostly artificial hybrids) are also cultivated. Germplasm characterization and classification provide useful information for the genetic improvement of crops. Descriptors for Musa have been published by IPGRI- INIBAP/CIRAD (1996). Morphological traits in the genus Musa are influenced by genotype × environment interactions making them unstable and variable over time and location, which limits their use in taxonomy. Moreover, plantains exhibit high level of somaclonal variation. Morphological characteristics are usually determined by a small number of genes that may not represent the total genetic diversity within the genome. Considerable attempts have been made to distinguish and classify Musa accessions on the basis of molecular markers such as randomly amplified polymorphic DNA (RAPD), amplified fragment length polymorphism (AFLP), and microsatellites (Onguso et al., 2004; Wong et al., 2002; Creste et al., 2004). Another complementary dominant marker system is Inter-Retrotransposon Amplified Polymorphism (IRAP) which is used to detect retrotransposon insertional polymorphism (Teo et al., 2005).
Recent molecular characterization efforts have developed a platform for efficient genotyping of Musa using microsatellite markers (Christelova et al., 2011). In recent research, many studies have been carried out on microsatellites on Musa spp. (Biswas et al., 2015; Christelova et al., 2016; Silva et al., 2015) providing information for further research. Development and application of technologies based on molecular markers provide the only tools that are able to reveal polymorphism at the DNA sequence level, which are adequate to detect genetic variability between individuals and within populations (Kresovich et al., 1995). Hence, the need to study diversity between the local and introduced varieties at the molecular level. Largely, there has not been any molecular characterization of Musa spp. in Ghana. This study therefore seeks to conduct molecular characterization of Ghanaian local accessions of plantain, identify SSR and RAPDs markers for Musa accessions in Ghana, develop a database for Ghanaian plantain germplasm, and remove duplications due to morphological differences.
Morphological analysis
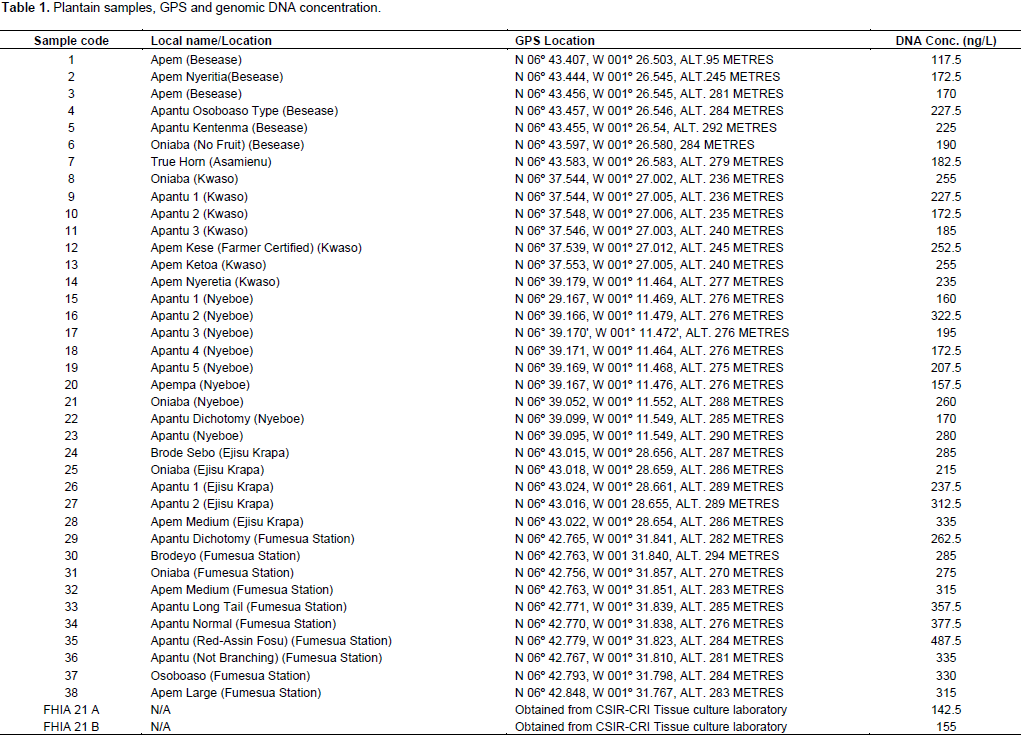
Sampling of plantain for molecular and morphological analysis was done in the Eastern and Ashanti regions of Ghana, and the selection targeted the locally known plantain varieties. Morphological data was taken on the field using morphological characterization of Musa descriptors (IPGRI-INIBAP/CIRAD, 1996). Data taken included local name, the GPS information to indicate location (Table 1), as well as all morphological features that could be assembled during the period of sampling.
Genomic DNA isolation
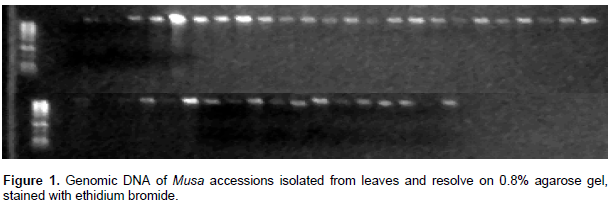
During collection in the field, cigar leaf of 38 plantain samples with approximate 0.2 g weight was sampled and stored in liquid nitrogen for isolation of genomic DNA. In the laboratory, DNA isolation was carried out within seven days after sampling. The phenol-chloroform-isoamyl alcohol base DNA extraction protocol (Egnin et al., 1998) was used to extract genomic DNA from the samples. The spectrophotometer (Biochrom Libra S12) was used to estimate the quantity and quality of DNA at 260 nm (OD260) and 280 nm (OD280). The DNA was resolved on 0.8% agarose gel in TAE buffer stained with ethidium bromide. The DNA in the gel was visualized with an ultra violet trans-illuminator in an alpha imager. The agarose gel electrophoresis was also used for the determination of DNA quality and quantity.
Microsatellite analysis
The Simple Sequence Repeats (SSR) microsatellite based analysis was conducted using the standardized approach for the unknown samples characterized at the molecular level. Twenty microsatellite markers were used to screen the 38 plantain genotypes. The SSR patterns of each individual of the study were analyzed following the protocol of Roy et al. (1996), as applied with the automated infrared fluorescence technology of a sequencer LICOR IR2 (LICOR, Lincoln, USA). For a given SSR locus, the forward SSR primer was designed with a 5'-end M13 extension (5'-CACGACGTTGTAAAACGAC-3'). Polymerase chain reaction (PCR) amplification was performed in a 384 wells Eppendorf mastercycler with PCR Master mix containing 10 ng of Musa DNA in a 10 µl final volume of reaction + PCR buffer (10 mM Tris HCl (pH 8), KCl 50 mM, 0.1% Triton-X100 and 1.5 mM MgCl2) + 8 pmol M13-labelled primer + 200 µM deoxynuleoside triphophates (dNTPs) + 1 U Taq DNA polymerase (Life Technologies, U.S.A.) + 0.06 µM of M13 primer-fluorescent dye IR700 or IR800 (Biolegio, Netherlands). The PCR program had initial denaturation step at 94°C for 5 min, followed by a touch-down protocol - initial decrease of annealing temperature by 1°C for the first cycle depending on the primer pairs used. Fixed annealing temperatures for further 35 cycles was applied and denaturation at 94°C for 45 s. Annealing was at lowest Tm of primer (between 43 and 52°C) for 60 s and elongation at 72°C for 60 s. A final elongation step at 72°C for 5 min was added to all the protocols. Musa standard was prepared with a mix of three Musa accessions (Pisang Jari Buaya, Popoulou/Maia Maoli and Tomolo), added in order to improve allele sizes determination. The ladder used had the range 71 to 367 bp. The IR700 or IR800-labeled PCR products were diluted 8- and 5-fold, respectively prior to electrophoresis on 6.5% polyacrylamide gel. The band sizes were determined by the IR fluorescence scanning system of the sequencer.
Random amplified polymorphic DNA analysis
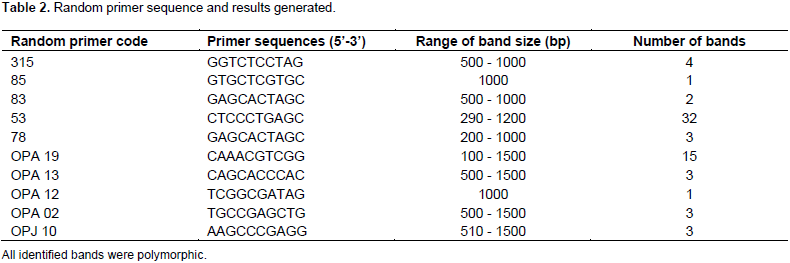
Plantain genomic DNA was diluted to an approximate concentration of 50 ng µl-1, prior to being used for PCR. The PCR cocktail volumes of 10 µl was used and the composition (final concentration) of cocktail was 50 ng/µl DNA, 1X buffer, 1.5 mM MgCl2, 250 µM each of dNTPs, 1.5 mM spermidine, 50 µM random primer, 5% dimethyl sulfoxide (DMSO), 0.2 to 0.5 µl of 5 U/µl Taq polymerase, and water to make up the difference in volume. The Invitrogen and the stoffel fragment PCR kit was used for the preparation of cocktail. The decamer random primers used are shown in Table 2. These primers were previously selected through sweet potato RAPD screening experiments at the Tuskegee University Plant Biotechnology and genomic lab (He et al., 1995; Egnin, unpublished data). The PCR conditions used for the amplification of DNA were as follows: an initial denaturation at 94°C for 3 min, 35 cycles of denaturation at 94°C for 30 s, annealing at 45°C for 30 s, extension at 72°C for 1 min, and a final extension for 10 min at 72°C holding at 4°C was included. A 2 μl loading dye was added to the reaction mixture, mixed and span down prior to being loaded on either 6.5% polyacrylamide gel electrophoresis (PAGE) or 1% agarose gel. The 100 base pair marker was loaded alongside the PCR samples. Electrophoresis was run at 120 V and bands were visualized using ethidium staining. Silver staining was used to visualize PCR produces run on PAGE.
Data analysis
The morphological data taken were translated into a presence or absence of a trait. The RAPDs analysis had agarose gels where the reproducible amplified bands were scored and data entered as present or absent alleles. Similarly, the SSR PCR products were resolved for electrophoresis in a 6.5% polyacrylamide gel. Bands produced were sized by the IR fluorescence scanning system of the sequencer. Genetic distances and clusters analysis were conducted using GENSTAT version 12, Nearest neighbor (simple). Similarity matrices and dendrograms were generated for all the three analysis conducted. Principal coordinated analyses 1 and 2 (PCA 1 and 2), were also carried out to show multiple dimension of the relationship in a scatter plot.
Genomic DNA isolation and PCR
The genomic DNA quantity as estimated with spectrophotometer is shown in Table 1. It could be deduced from the data that the quantity of genomic DNA isolate was appreciably high. The image generated after resolving the DNA on agarose gel (Figure 1), indicated high quality genomic DNA isolated.
SSR marker data
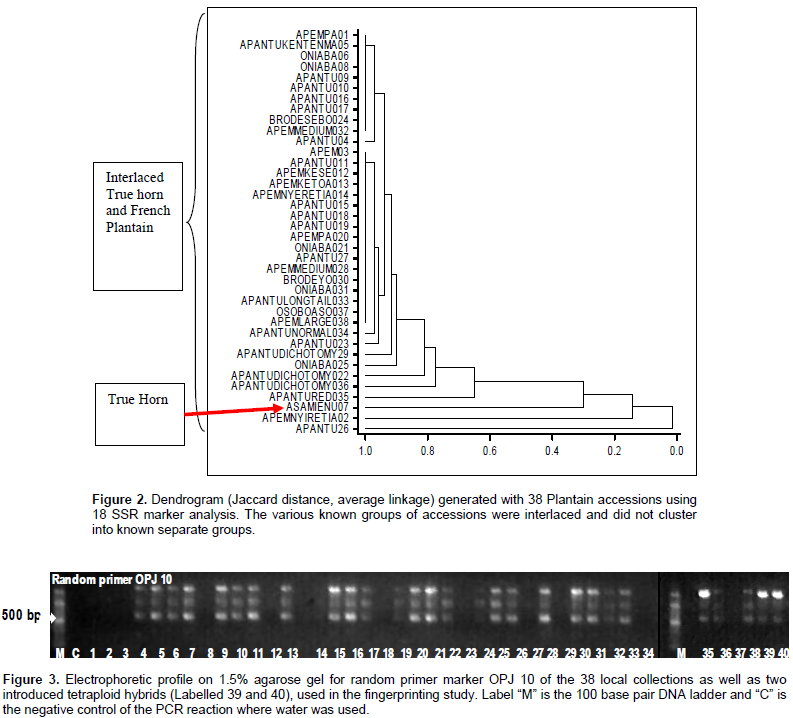
The SSR study screened 20 molecular markers, out of which 18 were selected for the analysis. The 18 loci produced 52 alleles in total. The number of alleles ranged from two in loci M45, M39, M307, M260, M24 and M150 to five in locus M90, the band size ranged from 111 to 458 bp. There was an average of 2.88 bands per loci and all were polymorphic. The Genstat version 12 analysis generated dendrogram (Figure 2) based on Jaccard distance average linkage. The SSR data set related the collections on a scale of 0 to 1.0 and it revealed two major groups. The first group of distantly related accessions was Apantu 26 and Apem 01. Apantu Red 035; a false horn, Asamienu 07; a true horn; and Apem nyiretia 02; a French plantain, were in individual subgroups close to each other. The second major group had seven subgroups with the three major plantain, namely, false horn, true horn and French plantain interspersed within subgroups. There was no distinct grouping for these three known genotypes. The most distantly related accessions were Apem 01 and Apantu 26 which are French plantain and false horn, respectively. There were 20 random primers that were screened, only 10 were found to produce reproducible polymorphic bands. The PCR products as resolved on agarose gel are as shown in Figure 3. Ten random primers used in the study were all polymorphic. The individual primers were considered as loci and they revealed a total of 67 alleles. The number of alleles ranged from 1 in primers RP 85, and OPA 12, to 32 in primer RP 53. The average number of alleles per locus was 6.7 and the band size ranged from 290 to 1500 bp (Table 2).
RAPD marker data
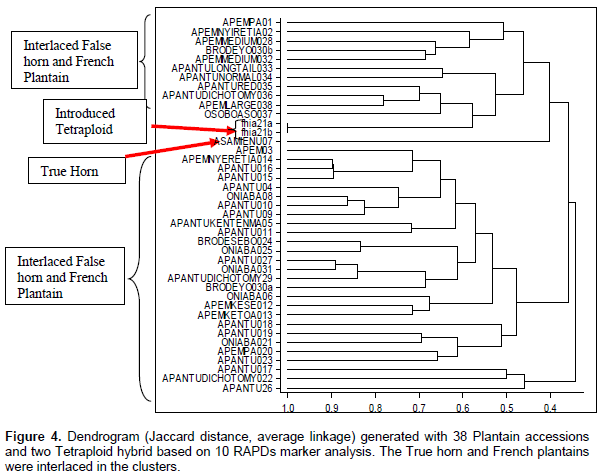
The RAPDs marker data set in the dendrogram, related the genotypes on a scale of 0.4 to 1.0. There were three major clusters which comprised two small groups of false horn and a French plantain both extreme ends. In between them, were false horn and French plantain accessions which had interlaced (Figure 4). Similar to the SSR results, the most distantly related samples as revealed by the dendrogram were Apem 01, a French plantain and Apantu 26, and a False Horn. This analysis included two FHIA 21, an introduced hybrid and they clustered between the true horn genotype (Asamienu) and a false horn subgroup. Included in the RAPDs data set were two entries of a false horn, locally called Brodeyo due to red pigmentation. They were sampled from the same location and labeled “Brodeyo a and b. In the dendrogram, they did not cluster together. Although to some extent, the various genotypic subgroups were clustered together (Figure 4), a few accessions were found to interlace within other genotypes. An example is Oniaba, a popular seedless French plantain which had four entries in the collection, however, these entries did not cluster together and they were interlaced in false horn genotypic subgroups.
Morphological data
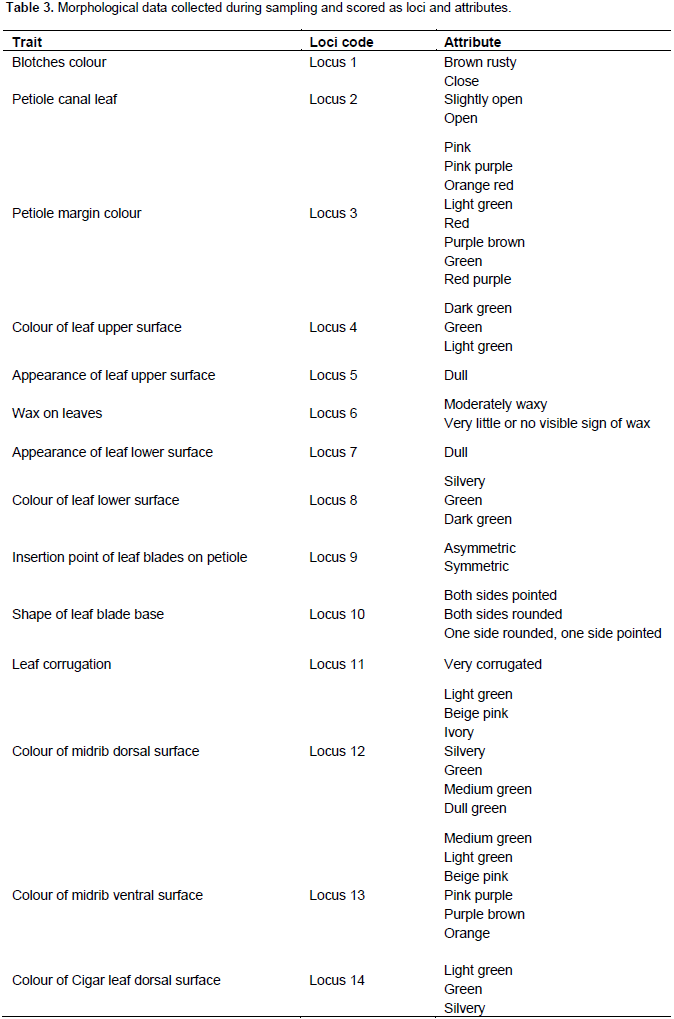
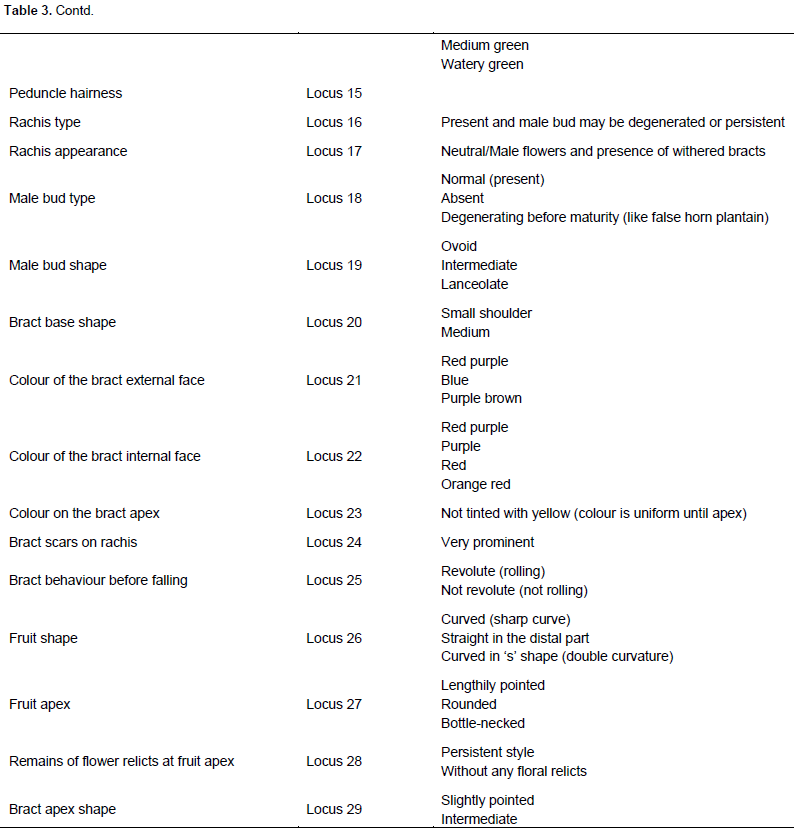
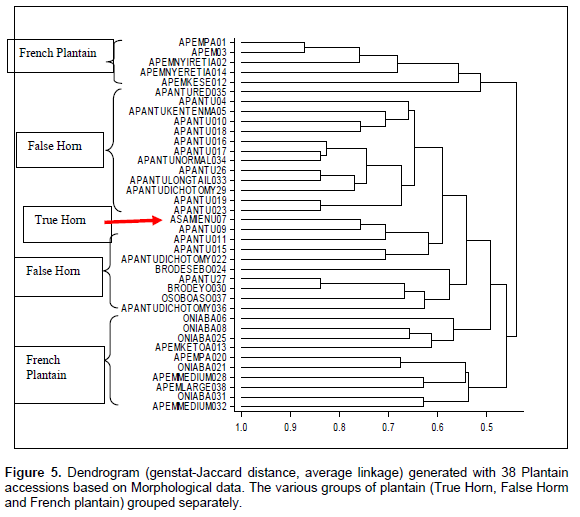
During sampling, the various morphological traits were scored as loci and the different attributes of a trait were scored as alleles. The morphological data scored was coded as in Table 3. There were 29 loci with a resultant of 79 alleles. The number of alleles ranged from 1 to 7. Single allele was recorded at the following loci: P1, P7, P15, 916, P17, P23, and P11. Seven alleles were recorded at loci P3 and P12. Out of the 29 loci, the seven which had single allele were all monomorphic, the remaining 22 loci were polymorphic, indicating 75.82% polymorphic loci (attributes). Averagely, there were 2.72 alleles per locus. According to the dendrogram generated, the morphological data analysis related the genotypes on a scale of 0.5 to 1.0. The French plantain Apem 01 was again the most distantly related sample to all the collections. However, unlike the molecular data, it was most distantly related to Apem Medium 032, which is also a French plantain by genotype. The morphological clusters resulted in three major groups. The two groups at both ends were French plantain genotypic group, whereas the false horn was in the middle. The true horn genotype clustered among the false horn as shown in Figure 5.
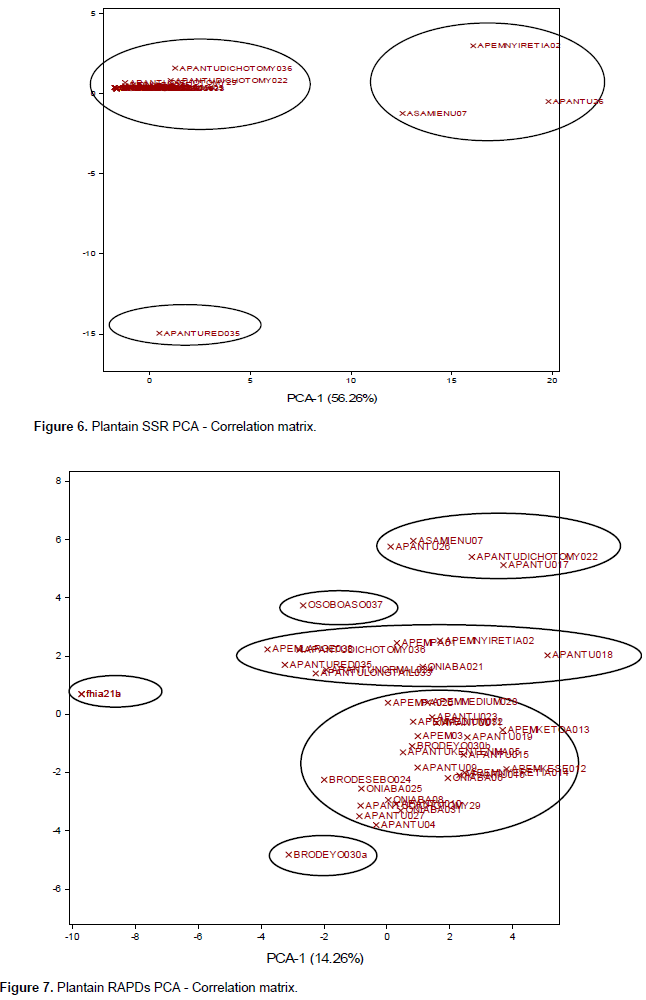
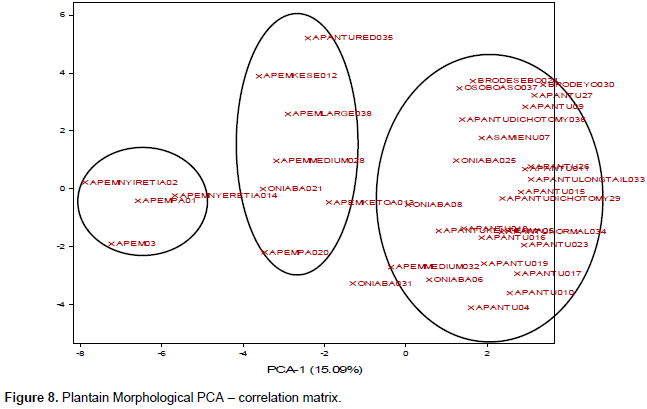
Principal component analysis (PCA)
PCA was carried out to show the multiple dimension and the relationship in a scatter plot for all the marker systems. The PCA plots generated (Figures 6 to 8) were all comparable to the cluster analysis. The PCA generated by SSR data set had two major groups (Figure 6), with 35 samples, tightly clustered together. However, accessions Asamienu which is a True Horn, Apem Nyiretia; a French plantain and Apantu a False Horn were scattered on the other side of the plot. The PCA1 for the plot was at 56.26%, whereas PCA2 was at 15.16%. The RAPDs plotted PCA2 at 11.64% and PCA1 at 14.26% (Figure 7). There were three major clusters on the plot. Although on the dendrogram Fhia 21 clustered with false horn, on the PCA plot, it was found in a separate group. The morphological data generated the most widely dispersed matrix (Figure 8) with PCA2 at 8.4% and PCA1 at 15.09%.
Similarity matrix
Similarity matrix was also generated from the data supplementary information and according to the SSR data, the samples were related on a scale of 0 to 1. The SSR analysis had Apantu26 (a False Horn) being distantly related to all the other collections on a scale of 0 to 0.07. It was related at a value of zero for samples Asamienu and Oniaba25 which are true horn and French plantain, respectively. Besides the sample Apantu26, which was distantly related to all the accessions, Apantu red35 and Apem20 were also distantly related at a value of 0.1. Out of the 722 permutations in the SSR similarity matrix, 181, representing 26.5% revealed a value of ‘1’, indicating that there were duplicates in the collections. The RAPDs analysis where two collections had a value of 1 was between 2 samples of FHIA21. This indicates the FHIA collections that had been maintained in vitro are still true to type and the RAPDs technique is capable of detecting duplicates in a collection. Similar observation was made when the SSR molecular marker technique was applied (Supplementary data - inserted). The similarity matrix of RAPDs (Supplementary data - inserted) analysis related the plantain collections on a scale of 0.17 to 0.90. The 0.17 value was between the two FHIA 21 entries (introduced tetraploid hybrid) and Apantu 07 which is a false horn. Next to the 0.17 value, 0.21 was also recorded as a low similarity index where Apantu 08 and Apem 01 were compared as well as between FHIA 21 hybrid and Apantu dichotomy 022. The only similarity value of 1 recorded was between two FHIA 21 entries. These were obtained from in vitro maintained lines and the result obtained is indicative that the RAPDs markers used are robust and capable of detecting duplicates in a collection. The most closely related collections were Apantu 016 and Apem nyiretia 014 at 0.90; these entries are however, a False Horn and French plantain, respectively. The two entries of brodeyo collected had a similarity value of 0.57, indicating that although morphologically, they are grouped together, at the molecular level, they are different. The morphological data (Supplementary data - inserted) related the plantain collections on a scale of 0.26 to 0.87. The most closely related collections were Apem 03 and Apem 01 both of which are French plantain genotypes. Brodesobe; a false horn which has pigmentation on the fruit and Apem 03 were the most distantly related entries at 0.26 similarity value. The morphological data did not reveal any duplicated since no two different accessions were related at a similarity value of 1.

The present study utilized three marker systems namely morphological, RAPDs and SSR microsatellites to characterize 38 Ghanaian plantain genotypes. All the three markers characterized the germplasm differently in terms of genetic relationship between different genotypes and clusters. The results demonstrate that it is extremely difficult to find a molecular marker system which is ideal. However, depending on the type of study to be undertaken, a marker system can be identified that would fulfil at least a few of the ideal characteristics (Weising et al., 1995). These results are similar to report by Samarasinghat et al. (2010), where in the morphological and SSR clustering, AAB genotypes well as all other genotypes occurred in different groups. A study by Christelová et al. 2016 used Molecular and Cytological systems to characterise global banana collections recommended more focus on molecular and morphological evaluation. The morphological analysis in this study generated 79 attributes, however, in a report by Samarasinghe et al. (2010), characterizing 27 Musa cultivars, generated 111 morphological attributes. The difference could be due to the fact that the morphological data in this present study was based solely on attributes that could be observed at the time of assembling data; therefore, details on fruit size, number and weight were not included. Similarly, Samarasinghe et al. (2010) used six MaSSR primers, all of which were polymorphic and generated 38 alleles. The 18 SSR markers used in this study generated 52 alleles.
The SSR markers used may therefore have limitations since they were developed based on known genetic information. In addition, due to specificity of SSR microsatellites, a more specific group of co-dominant markers may have to be evaluated as was reported by Quain et al., (2010), for a more informative data to be generated. Biswas et al. (2015) have in a genome-wide computation analysis of Musa microsatellites, classified cross taxon transferability and identified other genetic market potentials that can be utilized for effective molecular characterization of collections. The RAPDs marker system which is a dominant marker has been used by several investigators to characterize Musa germplasm. The advantage being, no prior information of genetic make-up is needed. Poerba and Ahmad (2010) used five RAPDs and ISSR to characterize 36 accessions of cooking banana. The five random primers used generated 63 bands. In this present study, 10 random primers generated 67 alleles, and all the primers used were polymorphic. All the bands generated were polymorphic. Unlike the reports by Poerba and Ahmad (2010) as well as Brown et al. (2009), where AAB and ABB and other Musa genomes were used, in this particular study, mainly AAB genome Musa accessions were analysed, the analysis included FHIA 21, which is an introduced tetraploid Musa hybrid. This FHIA 21 clustered between two known genotypes in the dendogram, whereas in the PCA presentation, it formed a separate group.
Brown et al. (2009) using 15 decamer RAPD markers to characterize 27 Musa accessions, detected 83% polymorphism, they showed that RAPDs based fingerprinting is a more appropriate alternative to determine the genetic diversity that is besides morphological data. However, they indicated that a more powerful tool such as AFLP would be most appropriate. El-khishin et al. (2009) used 10 AFLP primer pairs marker tools to characterized 11 Musa cultivars. In this classification, the plantains were clustered as a special AAB subgroup, while the M. sapeintum fell into the groups of AAB subgroup, AABB and even some AAA. The authors demonstrated that AFLPs can detect polymorphism among Musa cultivars with utmost precision and that they are capable of generating fingerprints for the discrimination and characterization of Musa cultivars. In the SSR analysis, which is a co-dominant marker system, the genetic distance of zero was observed between 26.5% of the collections, as well as a distance of 0.07 was between samples 7 and 25 which are true horn and French plantain, respectively. This is similar to report by Poerba and Ahmad (2010) where a value of 0.06 was observed between two accessions in their collection. Resmi et al. (2011) used ten STMS primers to detect polymorphism among 38 Indian Musa cultivars, and this revealed 27 alleles. The tool used for the analysis, clustered the cultivars into their respective groups as AA, AAA, AB, AAB, BB, and ABB. In other studies, Quain et al. (2010) using 49 SSR primers to screen 10 Musa cultivars revealed 233 alleles. The markers conveniently clustered the cultivars into the respective local accessions, introduced bananas and hybrid tetraploids.
It is possible that the SSR markers used in this present study, has been developed to reveal genotypes on the basis of A and B grouping, hence within a specific group, the clustering is limited thus identifying genotypes which are otherwise different as duplicates. The SSR markers used identified 26.5% duplicates in the collections and the PCA analysis clustered most of the accessions tightly together. This was not the results obtained in the RAPDs and morphological analysis. The results by the SSR markers indicate that most of the genotypes have a very narrow genetic base, although according to the morphological data, they may be ecotypes, however, according to the RAPDs data, though ecotypes, there may be genomic changes that have occurred that differentiates between the cultivars. Bananas and plantains are important food and cash crops (FAO, 2001) and more molecular and chromosomal information about their genomes is required to complement knowledge of their breeding and genetics (Rowe, 1984; Vuylsteke et al., 1997; Bakry et al., 2001). The small size of the genome (Dolezel et al., 1994) and chromosomes (Isobe and Hashimoto, 1994; Osuji et al., 1996a) and the difficulty in obtaining dividing cells (Osuji et al., 1996a, b) have made cytogenetic study difficult. Now methods of molecular cytogenetics are enabling us to characterize the genomes more fully (Osuji et al., 1997).
Genetic diversity exits among plantain accessions in Ghana and sub-Sahara Africa, however, the diversity is narrow. False Horn subgroup is distantly related to all the other subgroups. Using different approaches to determine the linkages showed that the French subgroup was different from the False Horn and False Horn different from the True Horn. The result showed distinctly cluster of the French subgroup, False and True Horns with the tetraploid hybrid linked to all. According to data obtained SSR markers specific of collections from West Africa have to be developed for effective breeding programs.
The authors have not declared any conflict of interests.
The authors would like to acknowledge Bioversity International and IFAR for the technical and financial support. They also acknowledge Dr. Jaroslav Dolezel of the Laboratory of Molecular Cytogenetics and Cytometry Institute of Experimental Botany Czech Republic for assisting in the SSR analysis.
REFERENCES
|
Bakry F, Carreel F, Caruana M-L, Coˆte F, Jenny C, Te Ìzenas du Montcel H (2001). Banana. In. Tropical Plant Breeding (Charrier A, Jacquot M, Hamon S, and Nicolas D Eds.), CIRAD Publisher, Collection Repe`res, Montpellier, France. pp. 1-29.
|
|
|
|
Biswas MK, Liu Y, Li C, Sheng O, Mayer C, Yi G (2015). Genome-Wide Computational Analysis of Musa Microsatellites: Classification, Cross-Taxon Transferability, Functional Annotation, Association with Transposons & miRNAs, and Genetic Marker Potential. PLoS One 10(6):e0131312.
Crossref
|
|
|
|
Brown N, Venkatasamy S, Khittoo G, Bahorun T, Jawaheer S (2009). Evaluation of genetic diversity between 27 banana cultivars (Musa spp.) in Mauritius using RAPD markers. Afr. J. Biotechnol. 8(9):1834-1840.
|
|
|
|
Christelová P, De Langhe E, Hribová E, Cižková J, Sardos J, Husáková M, Van den houwe I, Sutanto A, Kepler AK, Swennen R, Roux N, Doležel J (2016). Molecular and cytological characterization of the global Musa germplasm collection provides insights
into the treasure of banana diversity. Biodiversity and Conservation. 26(4): 801-8.
Crossref
|
|
|
|
Christelová P, Valárik M, Hribová E, Van den Houwe I, Channelière S, Roux N, Doležel J (2011). A platform for efficient genotyping in Musa using microsatellite markers. AoB Plants 2011:plr024.
Crossref
|
|
|
|
Creste S, Tulmann-Neto A, Vencovsky R, Silva S, Figueira A (2004). Genetic diversity of Musa diploid and triploid accessions from the Brazillian banana breeding program estimated by microsatellite markers. Genet. Res. Crop Evol. 51:723-733.
Crossref
|
|
|
|
Davey MW, Van den Bergh I, Markham R, Swennen R, Keulemans J (2009). Genetic variability in Musa fruit provitamin A carotenoids, lutein and mineral micronutrient contents. Food Chem. 115(3):806-813.
Crossref
|
|
|
|
Dolezel J, Dolezelova M, Novak FJ (1994). Flow cytometric estimation of nuclear DNA amount in diploid bananas (Musa acuminata and M. balbisiana). Biol. Plant. 36:351-357.
Crossref
|
|
|
|
Dzomeku BM, Armo-Annor F, Adjei-Gyan K, Darkey SK (2007). Consumer preference for three selected Musa hybrids in Ghana. Am. J. Food Technol. 2(7):684-688.
Crossref
|
|
|
|
Dzomeku BM, Dankyi AA, Darkey SK (2011). Socio-economic importance of plantain cultivation in Ghana. J. Anim. Plant Sci. 21(2):269-273.
|
|
|
|
Dzomeku BM, Solomon KD, Jens-Norbert W, Bam RK (2014). Response of selected local plantains to PIBS (Plants Issus de Bourgeons Secondaires) Technique. J. Plant Dev. 21:117-123.
|
|
|
|
Egnin M, Mora A, Prakash CS (1998). Factors Enhancing Agrobacterium tumefaciens- Mediated Gene Transfer in Peanut (Arachis Hypogaea L.). In Vitro Cell. Dev. Biol. Plants 34:310-318.
|
|
|
|
El-Khishin DA, Belatus EL, El-Hamid AA, Radwan KH (2009). Molecular Characterization of Banana Cultivars (Musa Spp.) From Egypt Using AFLP. Res. J. Agric. Biol. Sci. 5(3):272-279.
|
|
|
|
Food and Agriculture Organization (FAO) (2001).
View
|
|
|
|
He G, Prakash CS, Jaret RL (1995). Analysis of genetic diversity in sweetpotato (Ipomoea batatas) germplasm collection using DNA amplification fingerprinting. Genome 38:938-945.
Crossref
|
|
|
|
Hemeng OB, Banful B (1994). Plantain development project. Government of Ghana and International Development Research Centre, Canada. Final Technical Report 1991-1993.
|
|
|
|
IPGRI-INIBAP/CIRAD (1996). "Descriptor for banana (Musa spp.)", International Plant Genetic Resources Institute (IPGRI), Rome, Italy/International Network for the Improvement of Banana and Plantain (INIBAP), Montpellier, France/Centre de Cooperation Internationale en Recherche Agronomique pour le Development (CIRAD), Montpellier, France. 55 p.
|
|
|
|
Isobe M, Hashimoto K (1994). The chromosome count of 9 taxa in Musa and its allied genus Musella. Bull. Hiroshima Bot. Garden, Hiroshima, Japan 15:7-11.
|
|
|
|
Kresovich S, Szewc-Mcfadden AK, Blick S, McFerson JR (1995). Abundance and characterization of simple sequence repeats (SSRs) isolated from a size-fractionated genomic library of Brassica napus L. (rapseed). Theor. Appl. Genet. 91:206-211.
Crossref
|
|
|
|
Mapongmetsem PM, Nkongmeneck BA, Gubbuk H (2012). Socioeconomic Importance of the Banana Tree (Musa Spp.) in the Guinean Highland Savannah Agroforests. Sci. World J. 1-9.
Crossref
|
|
|
|
Olumba CC (2014). Productivity of improved plantain technologies in Anambra State, Nigeria. Afr. J. Agric. Res. 9(29):2196-2204.
Crossref
|
|
|
|
Onguso JM, Kahangi EM, Ndiritu DW, Mizutani F (2004). Genetic characterization of cultivated bananas and plantains in Kenya by RAPD markers. Sci. Hortic. 99:9-20.
Crossref
|
|
|
|
Osuji JO, Harrison G, Crouch J, Heslop-Harrison JS (1997). Identification of the genomic constitution of Musa lines (bananas, plantains and hybrids) using molecular cytogenetics. Ann. Bot. 80:787-793.
Crossref
|
|
|
|
Osuji JO, Okoli BE, Ortiz R (1996a). An improved procedure for mitotic studies of the Eumusa section of the genus Musa L. (Musaceae). Informusa 5:12-14.
|
|
|
|
Osuji JO, Okoli BE, Ortiz R (1996b). Cytological evaluation of plantains, bananas and their hybrids: Technique for mitotic study. Niger. J. Genet. 10:1-7.
|
|
|
|
Poerba YS, Ahmad F (2010). Genetic variability among 18 cultivars of cooking bananas and plantains by RAPD and ISSR markers. Biodiversitas 11(3):118-123.
Crossref
|
|
|
|
Quain, MD, Dzomeku BM, Thompson R, Asibuo JY, Adofo-Boateng P, Appiah-Kubi D, (2010). Genetic Diversity of Musa cultivars in Ghana and introduced hybrids. Aspects of Applied Biology 96, Agriculture: Africa Engine for Growth- Plant science and biotechnology the key. pp. 277-281.
|
|
|
|
Resmi L, Kumari R, Bhat KV, Nair AS (2011). Molecular characterization of genetic diversity and structure in South Indian Musa cultivars. Int. J. Bot. 7(4):274-282.
Crossref
|
|
|
|
Rowe P (1984). Recent advances in breeding dessert bananas, plantains, and cooking bananas. Fruits 39:149-153.
|
|
|
|
Roy R, Steffens DL, Gratside B, Jang GY, Brumbaugh JA (1996). Producing STR locus patterns from bloodstains and other forensic samples using an infrared fluorescent automated DNA sequencer. J Forensic Sci. 41:418-424.

Crossref
|
|
|
|
Samarasinghe WLG, Perera ALT, Wickramasinghe IP, Rajapakse S (2010). Morphological and Molecular Characterization of Musa Germplasm in Sri Lanka and Selection of Superior Genotypes. Proc. IC on Banana & Plantain in Africa Eds.: T. Dubois et al.,
Acta Hort. 879:571-576.
Crossref
|
|
|
|
Silva PRO, Jesus ONJ, Creste S, Figueira A, Amorim EP, Ferreira CF (2015). Evaluation of microsatellite loci from libraries derived from the wild diploid 'Calcutta 4' and 'Ouro' banana cultivars. Genet. Mol. Res. 14(3):11410-11428.
Crossref
|
|
|
|
Simmonds NW (1962). The evolution of the bananas. Longman, London. 170p.
|
|
|
|
Teo CH, Tan SH, Ho CL, Faridah QZ, Othman YR, Heslop-Harrison JS, Kalendar R, Schulman AH (2005). Genome constitution and classification using retrotransposon-based markers in the orphan crop banana. J. Plant Biol. 48:96-105.
Crossref
|
|
|
|
Vuylsteke D, Ortiz R, Ferris RSB, Crouch JH (1997). Plantain improvement. Plant Breed. Rev. 14:267-320.
|
|
|
|
Weising K, Nybom H, Wolff K, Meyer W (1995). DNA Fingerprinting in Plants and Fungi (ed. Arbor, A.) CRC Press, Boca Raton. pp. 1-3.
|
|
|
|
Wong C, Kiew R, Argent G, Set O, Lee SK, Gan YY (2002). Assessment of the validity of the sections in Musa (Musaceae) using AFLP. Ann. Bot. 90:231-238.
Crossref
|