ABSTRACT
Twenty two genotypes of J. curcas L. from Africa (Senegal, Burkina Faso, Mali, Congo and Madagascar Island), Asia (Cambodia, China and India) and America (Ecuador, Dominican Republic and Brazil) selected for their vigor and their productivity were analyzed with ten SSR primer pairs and six AFLP primer combinations. The two marker approaches showed their ability to effectively reveal polymorphism among the selected genotypes: 94.02 and 56% of polymorphism for AFLPs and SSRs respectively. Among the three groups of selected genotypes, the Asian group was the least diverse while the genetic diversities found in African and American groups were slightly comparable. The Nei’s genetic diversity (He) of all twenty-two selected genotypes was 0.2029 based on combined SSR+AFLP data. The Gst value and the AMOVA analysis indicated that more than 80% of the genetic diversity resided within the groups. The analysis of the genetic relationships between the genotypes using the Nei’s standard dissimilarity matrix gave dissimilarity coefficients ranging from 0.14397 to 0.73943 with an average of 0.3540. The most distant genotypes were found between a genotype from Africa (Congo) and one from America (Ecuador). The clustering of genotypes obtained with the neighbor-joining dendrogram and the PCoA analysis revealed the existence of a certain level of diversity that can be used by breeders.
Key words: Biodiesel, genetic diversity, jatropha, molecular markers, AFLP, SSR, plant breeding.
Jatropha curcas L. is a small perennial tree native to tropical America that has spread to tropical and subtropical regions of Asia and Africa over the last 200 years (Marinho et al., 2018). International attention to this plant has emerged during the past decade from the need to reduce dependence on the increasing scarcity and
cost of fossil fuels and their associated carbon emissions (Moniruzzaman et al., 2017). Jatropha has been identified as a promising candidate for clean and renewable energy because of its seed oil which had the characteristics of diesel, its non-food nature and its supposed capability of high yield on marginal soils with minimum management requirements and inputs (Vásquez-Mayorga et al., 2017; Cardoso et al., 2018). For these reasons, jatropha was assumed to have potential to bring socio-economic benefits and there has therefore been a heightened global interest in large-scale jatropha cultivation and many jatropha projects have been implemented in Asia, Africa and Latin America (Soto et al., 2018). However, the performance of this new crop has been very disappointing despite claims of high yields, drought tolerance, low nutrient requirements, high returns on investment etc.; jatropha investments failed to meet global expectations (Antwi–Bediako et al., 2019). Consequently, doubts have been cast on the profitability and the financial viability of its cultivation, leading to the disillusionment of farmers and disadoption of jatropha by most of them (Soto et al., 2018; Vandepitte et al., 2019).
One of the main causes of the problem of jatropha cultivation was the low seed yield (Moniruzzaman et al., 2017; Soto et al., 2018). The cultivars used did not achieve the initially anticipated high seed yields, because the expectations were not based on field performance and validated scientific knowledge (Govender et al., 2018). The promotion was based on a multitude of unfounded claims, which did not lead to a commercially successful jatropha production.
Actually, J. curcas is an incipiently domesticated species with no availability of competitive commercial cultivars (Díaz et al., 2017). It is mostly a xenogamic plant, highly heterozygous for most characteristics, which implies a high degree of segregation (Díaz et al., 2017). The less productivity observed was because of unavailability of suitable high yielding varieties and a good commercial variety is still missing (Cardoso et al., 2018). As for all non-domesticated perennials, time is needed for the development of commercial varieties of jatropha; unfortunately this fact seems to have been overlooked and jatropha has been considered a commercial crop without any real scientific basis.
According to Tjeuw (2017), Jatropha has the potential to be a cash-crop like cotton or rubber (Hevea brasiliensis M.) which are both equally non edible but seem to be well accepted and not seen as a threat to food production. However for the successful exploitation of jatropha, there is an urgent need for improved genetic material with known yield characteristics over a wide range of climatic and agro-ecological conditions. It is one of the main effective solutions and the future challenge for jatropha breeders (Díaz et al., 2017; Moniruzzaman et al., 2017; Cardoso et al., 2018). This will require extensive plant breeding and molecular strategies to investigate systematically and scientifically jatropha potential for the development of a competitive commercial variety (Tjeuw, 2017).
In recent years, works on the genetic improvement of the species have been undertaken but has not yet resulted in improved competitive cultivars (Montes and Melchinger, 2016; Peixoto et al., 2017; Cardoso et al., 2018). For example, in 2018, Cardoso et al. from the J. curcas plant breeding program of the Federal University of Viçosa (Brazil) reported the selection of 20 promising individuals for crosses and for cloning aiming to bring genetic gains for successful cultivation. Govender et al. (2018) for their part identified genes with a putative implication in biological processes linked to yield, which could be of great importance in breeding strategies and subsequent production of superior and efficient J. curcas varieties.
The present study deals with twenty-two genotypes selected for their production and vigor from a collection of J. curcas from Africa, Asia and America, and planted on an experimental farm located in Bokhol (Senegal). For the development of an efficient breeding program, the determination of genetic relationships among these selected genotypes is critical (Díaz et al., 2017). It is an initial step towards efficient parental selection and breeding of superior genotypes. The present study was undertaken to determine and understand the genetic relationships between the selected genotypes, using SSR and AFLP markers in order to propose the best crossing scheme for a breeding program.
Plant materials
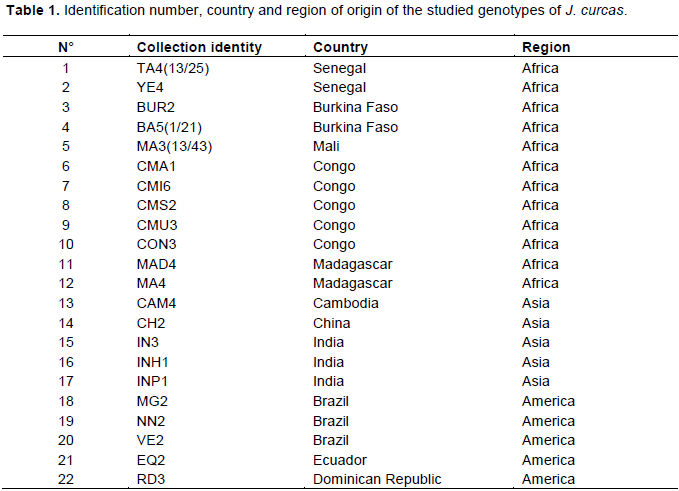
The plant material was provided by the Laboratory of Tropical Agroecology of Gembloux Agro-Bio Tech (University of Liège, Belgium). It included dried leaves of twenty-two genotypes of J. curcas (Table 1) originating from Africa (Senegal, Burkina Faso, Mali, Congo and Madagascar), Asia (Cambodia, China and India) and America (Ecuador, Dominican Republic and Brazil). These genotypes were selected according to several parameters but especially on the basis of their productivity and their good vigor from a collection of J. curcas grown on an experimental farm located in Bokhol in Senegal.
DNA isolation
Total genomic DNA was isolated from 20 mg of dried leaves following a slightly modified mixed alkyltrimethylammonium bromide (MATAB) method as described by Lacape et al. (2003). Briefly, leaves were ground in 2 ml safe-lock microtubes (Eppendorf, Belgium) with stainless steel beads using a TissueLyser mixer-mill (Qiagen, Belgium) and dissolved in 800 µL of MATAB buffer (0.1 M Tris HCl, pH 8.0, 1.5 M NaCl, 20 mM EDTA, 2% MATAB, 1% polyethylene glycol 6000, 0.5% sodium sulphite) at 72°C. The samples were incubated for 1 h at 72°C and cooled for 5 min at room temperature. Then, 960 µL of chloroform-isoamyl alcohol (CIA) (24:1) was added to each sample. All samples were homogenized by inversion for 5 min, before centrifugation at 6200 g for 20 min at room temperature. The supernatant (800 µL) was collected and the DNA was precipitated with 640 µL of isopropanol by gentle shaking. After a centrifugation at 6200 g for 20 min, the pellet was washed with 600 µL of 70% ethanol through a centrifugation at 6200 g for 10 min, dried at 60°C for 10 min and dissolved in 100 µL of TE buffer (10 mM Tris HCl, pH 8.0,1 mM EDTA). RNA was removed by RNAse treatment at 37°C for 1 h. DNA quality and concentration were evaluated by electrophoresis in SYBR Safe (Invitrogen) stained with 1% agarose gels through comparison with low DNA mass ladder (Invitrogen, Belgium). Final concentration of DNA was adjusted to 50 ng μL-1 for use in PCR analysis.
SSR analysis
Ten SSR primer pairs (jcds 10, jcds 24, jcds 58, jcds 66, jcps 1, jcps 6, jcps 20, jcps 21, jcms 2 and jcms 30) were selected from the study of Pamidimarri et al. (2009). Polymerase chain reactions (PCR) were performed in 10 μL volume containing approximately 25 ng of template DNA, 0.6 U of Taq DNA Polymerase, 2.5 mM MgCl2, 1x Polymerase Buffer, 2 µM of each forward and reverse primers, and 0.2 mM of dNTPs mix. A PTC-200 thermal cycler (BioRad, Belgium) was used, with a PCR conditions consisting of an initial denaturation at 94°C for 5 min, followed by 35 cycles of denaturation at 94°C for 30 s, annealing at 55°C for 1 min and extension at 72°C for 1 min, with a final 72°C extension for 8 min. Amplification products were separated on 6.0% denaturing polyacrylamide gel and visualized by silver stain according to the following protocol: Fixing the gel for 3 min in a fixing solution (10% ethanol, 0.5% acetic acid, in water), staining for 5 min in a staining solution (0.2% silver nitrate, in water), rinsing in de-ionized water for 3 s, developing in a cold (4–10°C) developer solution (0.15% sodium hydroxide, 0.2% formaldehyde, in water) until the DNA bands became visible. The gel was rinsed for 1 min in the fixing solution, air-dried and the microsatellite bands were photo-documented and analyzed.
AFLP analysis
Six AFLP primer combinations were used (E-AAG/M-CAC, E-ACT/M-CAT, E-AAC/M-CTT, E-ACA/M-CAT, E-ACG/M-CTC and E-AGC/M-CAA). AFLP was carried out using the “AFLP Analysis System I / AFLP starter primer kit” (Invitrogen, Belgium) following the protocol proposed by Invitrogen. Briefly, genomic DNA (250 ng) was double digested with EcoR I and Mse I restriction endonucleases. The digested DNA fragments were ligated to EcoR I and Mse I adaptors with T4 DNA ligase to generate template DNA for amplification by PCR. Two consecutive PCR were performed: A pre-selective and selective PCR. In the pre-selective reaction, DNA was amplified using an AFLP pre-amp primer pair complementary to the adaptors and each having one selective nucleotide. Pre-selective PCR amplification was used as template for the selective amplification using AFLP primers, each containing three selective nucleotides. The amplified Fragments were resolved using 6.0% denaturing polyacrylamide gels and DNA bands were visualized by silver staining, as described previously.
Data collection and statistical analysis
The scoring of bands was done as present (1) or absent (0) for each SSR and AFLP marker allele and data was entered in a binary data matrix as discrete variables. POPGENE software (version 1.32) was used to calculate observed number of alleles (Na), effective number of alleles (Ne), Nei’s genetic diversity (He) and Shannon’s information index (I). Within species diversity (Hs), total genetic diversity (Ht), mean coefficient of gene differentiation (Gst) and estimate of gene flow (Nm) were also calculated by POPGENE software. Dissimilarity coefficients between the genotypes, in a pairwise comparison, were computed using the Nei’s standard dissimilarity coefficient (Ds) to estimate relationships between the genotypes studied. The resulting dissimilarity matrix was subjected to cluster analysis by Neighbor-joining method and a dendrogram, showing the distance-based interrelationship among the genotypes, was generated using FreeTree software (Pavlicek et al., 1999) and the drawing program TreeView (http://taxonomy.zoology.gla.ac.uk/rod/treeview.html).
Analysis of molecular variance (AMOVA) was carried out with GenALEx 6.5 software (Peakall and Smouse, 2001) to examine total genetic variation among and within accessions. In addition, Principal Component Analysis (PCoA) was performed with the same software, in order to more effectively view the patterns of genetic distance. GenALEx software was also used to calculate Nei’s unbiased genetic distance among the different populations. Nei’s unbiased genetic distance is an accurate estimate of the number of gene differences per locus when populations are small (Nei, 1978). Finally, a Mantel test was achieved with the GenALEx software to reveal the correlation between the two techniques (SSR and AFLP).
Polymorphism of SSR and AFLP amplified products
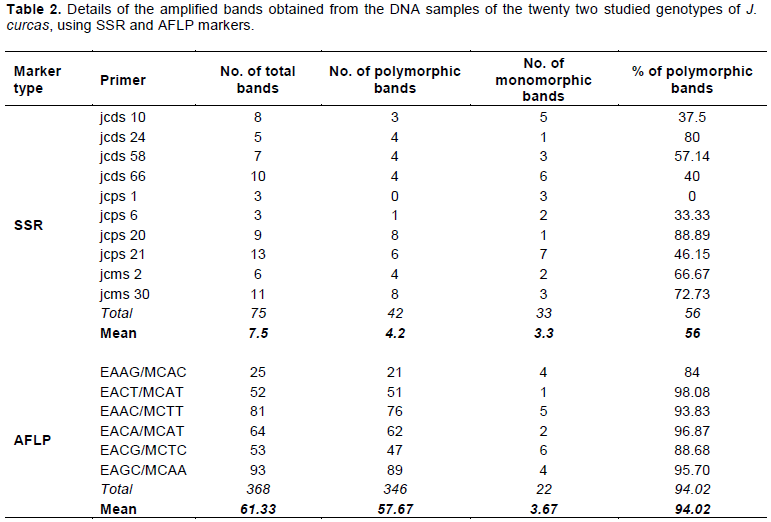
All the SSR primers and the AFLP primer combinations used amplified fragments across the twenty two genotypes studied (Table 2). In total, 75 bands were revealed for the 10 SSR primers. The number of bands per primer ranged from three (jcps 1 and jcps 6) to thirteen (jcps 21), with an average of 7.5 bands per primer. All the primers showed different levels of polymorphism except jcps 1 which showed no polymorphism among the twenty two jatropha genotypes. The percentage of polymorphic bands per primer ranged from 0% (jcps 1) to 88.89% (jcps 20), with an average of 56%. Four primers out of the 10 primers showed less than 50% polymorphic bands. For the six AFLP primer combinations, a total of 368 bands were produced. The number of bands per primer combination ranged from 25 (EAAG/MCAC) to 93 (EAGC/MCAA) with an average of 61.33 bands per primer combination (Table 2). Of the 368 AFLP bands produced, 346 bands were polymorphic, accounting for 94.02%. The percentage of polymorphism per primer combination ranged from 84% (E-AAG/M-CAC) to 98.07% (E-ACT/M-CAT).
Genetic variability revealed with single-population descriptive statistics
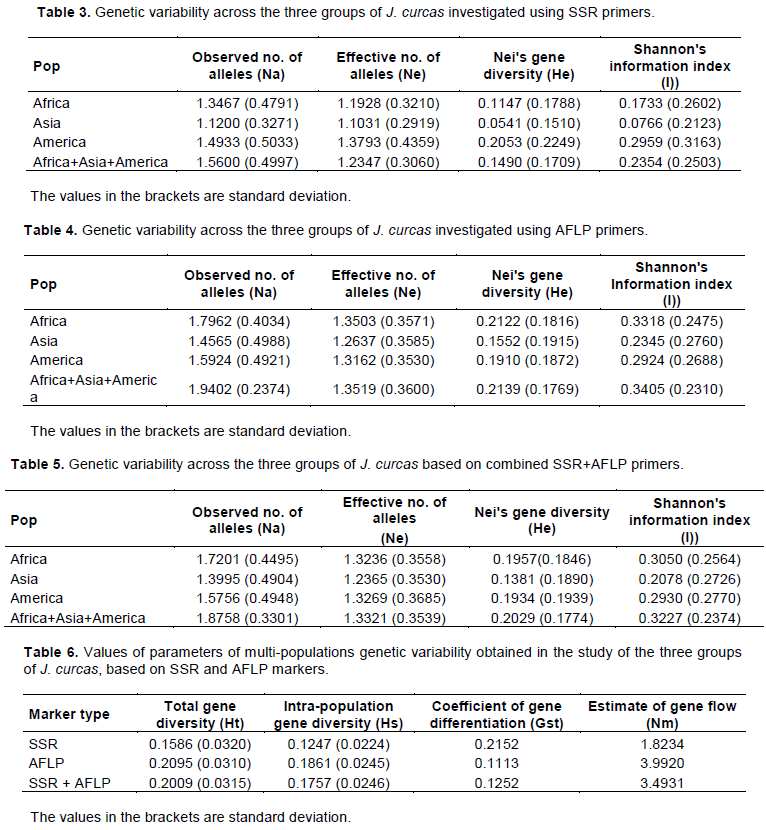
At the level of single-population descriptive statistics, SSR results (Tables 3) revealed that the group of American genotypes had the highest values for observed number of alleles (Na), effective number of alleles (Ne), Nei’s genetic diversity (He), Shannon’s information index (I) with 1.4933, 1.3793, 0.2053 and 0.2959 respectively. The group of Asian genotypes showed the lowest values for these parameters (Na = 1.12, Ne = 1.1031, He = 0.0541 and I = 0.0766), while the group of African genotypes presented intermediate values (Na = 1.3467, Ne = 1.1928, He = 0.1147 and I = 0.1733). The values of these parameters for all the twenty two genotypes were Na = 1.5600, Ne = 1.2347, He = 0.1490 and I = 0.2354.
With AFLP data (Table 4), the highest values for Na, Ne, He and I were found in African genotypes (Na = 1.7962, Ne = 1.3503, He = 0.2122 and I = 0.3318), followed by American (Na = 1.5924, Ne = 1.3162, He = 0.1910 and I = 0.2924), and then Asian (Na = 1.4565, Ne = 1.2637, He = 0.1552 and I = 0.2345). For all the 22 genotypes the results were Na = 1.9402, Ne = 1.3519, He = 0.2139 and I = 0.3405.
With the combined SSR+AFLP data (Table 5), the highest values for Na, Ne, He and I were found in African genotypes (Na = 1.7201, Ne = 1.3236, He = 0.1957 and I = 0.3050), followed by American (Na = 1.5756, Ne = 1.3269, He = 0.1934 and I = 0.2930), and then Asian (Na = 1.4565, Ne = 1.2637, He = 0.1552 and I = 0.2345). The values of these parameters for the twenty two genotypes were Na = 1.8758, Ne = 1.3321, He = 0.2029 and I = 0.3227.
Genetic diversity revealed with multi-populations descriptive statistics
Results of multi-populations descriptive statistics are presented in Table 6. The values for total genetic diversity among the groups (Ht) was 0.1586 for SSR, 0.2095 for AFLP and 0.2009 for SSR+AFLP, while within groups diversity (Hs) was found to be 0.1247, 0.1861 and 0.1757 for SSR, AFLP and SSR+AFLP respectively. Mean coefficient of gene differentiation (Gst) was 0.2152 with SSR data, indicating that 21.52% of the total genetic variation in the groups occurred among groups while 78.48% of the genetic diversity resided within groups. With AFLP and SSR+AFLP data, Gst value was 0.1113 and 0.1252 respectively, indicating that 88.87% (for AFLP) and 87.48% (for SSR+AFLP) of the genetic diversity resided within groups.
Analysis of molecular variance (AMOVA) partitioned the total genetic variance into variance among groups and within groups. The results of AMOVA based on SSR, AFLP and SSR+AFLP data showed respectively 5, 0 and 1% of molecular variance among groups, while within the groups these values were 95, 100 and 99%.
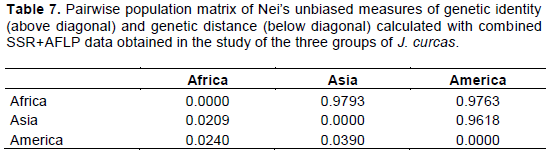
The Nei’s unbiased measures of genetic similarity (GS) and genetic distance (GD) among the three studied groups of J. curcas were calculated using SSR+AFLP data (Table 7). The GD of the three groups of genotypes varied from 0.0209 to 0.0390, with an average of 0.0279. The largest GD (0.0390) was found between the American and Asian groups and the smallest (0.0209) between African and Asian groups.
Genetic relationships among the genotypes and cluster analysis
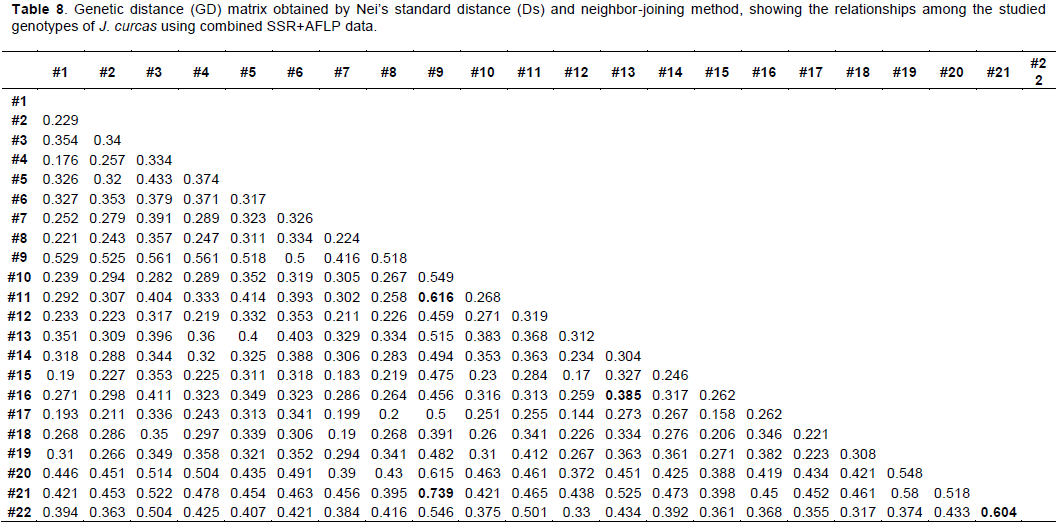
Genetic relationships among the genotypes of the three groups of J. curcas were constructed by neighbor-joining cluster analysis based on the Nei’s standard dissimilarity coefficients (Ds). GD matrixes were obtained from the SSR, AFLP and SSR+AFLP binary data. The Nei’s standard dissimilarity coefficients (Ds) between the genotypes ranged from 0.00741 to 0.36682 with a mean of 0.08404 for SSR. The lowest dissimilarity coefficient was between the genotype#10 from Africa (Congo) and the genotype#19 from America (Brazil), and the highest was between genotype#21 from America (Ecuador) and genotype#22 from America (Dominican Republic). For AFLP, the Nei’s standard dissimilarity coefficients ranged from 0.22044 to 1.22921 with a mean of 0.53718. The least dissimilar genotypes were genotype#12 from Africa (Madagascar) and genotype#17 from Asia (India) and the most dissimilar were genotype#9 from Africa (Congo) and genotype#11 from Africa (Madagascar). When the SSR and AFLP data were combined, the Nei’s standard dissimilarity coefficients ranged from 0.14397 to 0.73943 with a mean of 0.3540. The lowest coefficient was found between genotype#12 from Africa (Madagascar) and genotype#17 from Asia (India), and the highest between genotype#9 from Africa (Congo) and genotype#21 from America (Ecuador). The GD matrixes generated by the combined SSR+AFLP data (Table 8) also showed that, the most genetically distant genotypes in the African group were genotype#9 from Congo and genotype#11 from Madagascar (Ds = 0.61553). In the American groups the most distant genotypes were genotype#21 from Ecuador and genotype#22 from Dominican Republic (Ds = 0.60396). And finally in the Asian group, the most distant genotypes were genotype#13 from Cambodia and genotype#16 from India (Ds = 0.38502).
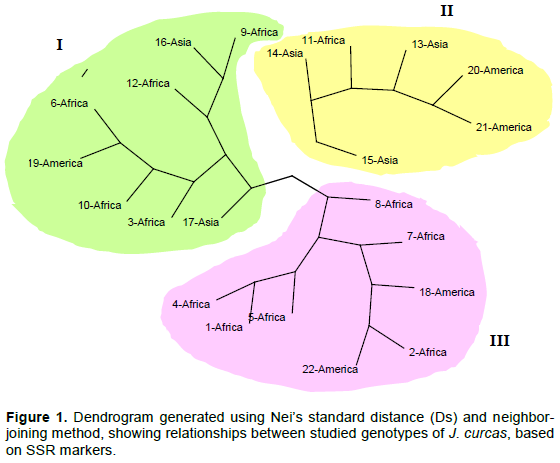
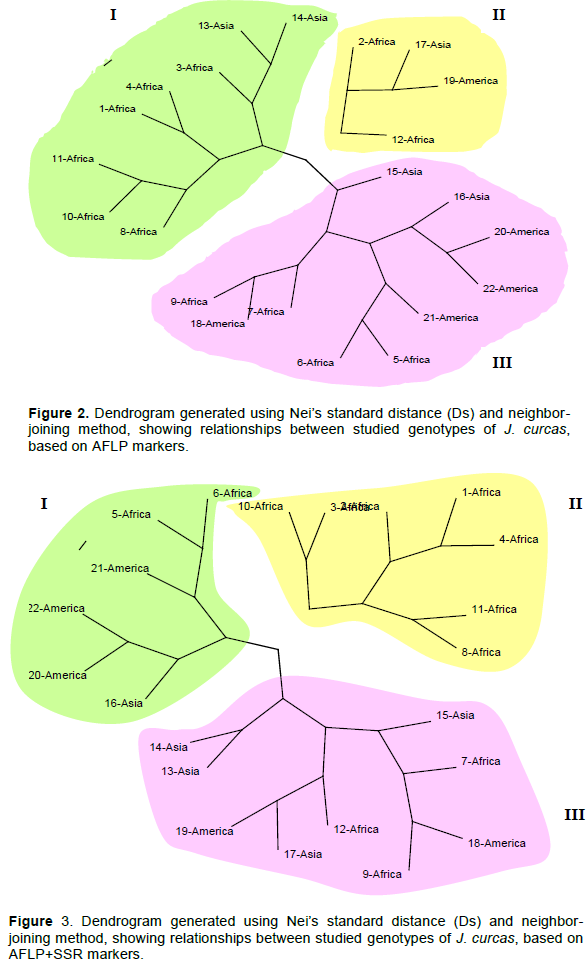
The dendrograms (Figures 1 to 3) constructed, defining the genomic relationships among analyzed genotypes, grouped the 22 J. curcas genotypes into three main clusters (I, II and III). For SSR, the composition of each cluster (Figure 1) was: Eight genotypes for cluster I (2 from Asia, 1 from America and 5 from Africa), six genotypes for cluster II (3 from Asia, two from America and 1 from Africa) and eight genotypes for cluster III (2 from America and 6 from Africa). The clustering results for AFLP (Figure 2) was: Eight genotypes for cluster I (2 from Asia and 6 from Africa), four genotypes for cluster II (1 from Asia, 1 from America and 2 from Africa), ten genotypes for cluster III (2 from Asia, 4 from America and 4 from Africa). For combined SSR and AFLP data, the clustering (Figure 3) was: Six genotypes for cluster I (2 from Africa, 1 from Asia and 3 from America), seven genotypes from Africa for cluster II and nine genotypes for cluster III (3 from Africa, 4 from Asia and 2 from America).
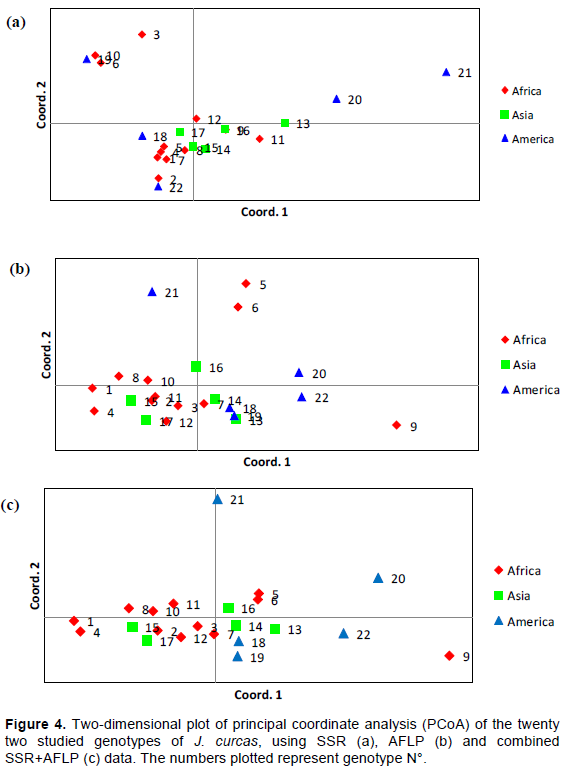
Principal Coordinate Analysis (PCoA) was used to add complementary information to the cluster analysis. The results of PCoA (Figure 4a, b and c) showed, clustering comparable to those of the dendrograms. No clear relation was shown between genotype associations and geographical origin.
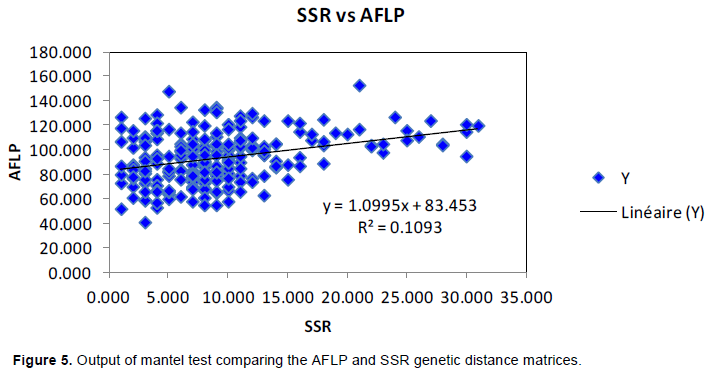
A mantel test between the two Nei’s genetic diversity indexes was performed with 99 permutations, in order to estimate correlations for the two molecular systems. It resulted in r² = 0.1093 (Figure 5).
In the present study, the two marker approaches (SSR and AFLP) showed their ability to effectively reveal polymorphism among plant materials of J. curcas. However, AFLP exceeded SSR in the ability to detect genetic polymorphism with higher resolving power (94.02% of polymorphic bands for AFLP against 56% for SSR). This might be due to the type of genetic polymorphism detected by each molecular marker system and the different type of information provided by each of them (Augustinos et al., 2016). Indeed, the higher multiplexing ability of arbitrarily dominant technologies such as AFLP is more efficient in detecting polymorphism per assay rather than high levels of polymorphism at each locus of the codominant SSR technology (Costa et al., 2016). Osorio et al. (2014) using a set of 29 SSR and 20 AFLP in a collection of J. curcas, found also higher percentage of polymorphism with AFLP (86%) than with SSR (73%).
The difference between the two marker systems was also shown by the Mantel test that revealed no significant associations between them (r² = 0.1093). A low correlation between AFLP and SSR has also been reported by Mardi et al. (2011) working on durum wheat, with r2 = 0.116. According to Augustinos et al. (2016), poor correlation between genetic markers most likely indicates that they refer to different portion of the genome. Accordingly, the combined use of different marker systems may provide more reliable information about genetic diversity when compared to the use of only one marker system (Leal et al., 2010; Augustinos et al., 2016). Therefore, the results obtained from the two marker systems used in the present study should be considered complementary.
With the combined data of the two markers systems, the values of Nei’s genetic diversity obtained for the twenty two selected genotypes was He= 0.2029. This values was lower than those reported from populations of J. curcas in Chiapas in Mexico (He = 0.34-0.54) by Sanou et al. (2015). Considering that Chiapas (Mexico) is recognized as a center of origin and diversity of jatropha (Angel et al., 2016), the genetic diversity of the selected genotypes in the present study was not negligible.
Wright (1951) has previously shown that Gst is a valuable parameter to determine the degree of genetic differentiation between populations. For the selected genotypes, Gst value was 0.1252 with combined SSR+AFLP. This Gst value globally indicated that more than 87.48% of the genetic diversity resided within the groups and only 12.52% of the total genetic variation occurred among groups. These results agreed with the weak molecular variance among groups shown by AMOVA analysis and the low genetic distances found among the three groups of genotypes. Other studies in J. curcas based on different types of molecular markers have also reported that in general, there is limited variation among groups of J. curcas from various part of the world (Kumar et al., 2009; Subramanyam et al., 2009; Rosado et al., 2010). The low genetic differentiation among groups indicates that accessions of J. curcas have originated from the same genetic background, as mentioned by Pamidimarri and Reddy (2014) and Díaz et al. (2017).
Analysis of the genetic relationships between genotypes using the Nei standard dissimilarity matrix obtained from combined SSR + AFLP data, showed dissimilarity coefficients ranging from 0.14397 to 0.73943. This result indicated the existence of relatively important genetic distances between some genotypes. The most distant genotypes can be good candidates for crosses. The dendrogram, obtained from these genetic relationships among the genotypes, grouped the 22 J. curcas genotypes into three main clusters (I, II and III). Globally, the dendrogram showed three tendencies: (i) Genotypes from diverse regions group together in the same cluster, (ii) Genotypes from the same region scattered in different clusters, and (iii) Genotypes from the same region cluster together. This pattern of clustering showed no clear association between geographical distribution of genotypes and genetic diversity. This means that the geographical origin of the genotypes studied is not significantly related to their genetic similarity. Principal Coordinate Analysis (PCoA) confirmed this clustering pattern. Similar results were found by other authors such as Ambrosi et al. (2010), Maghuly et al. (2015) and Konan et al. (2018) showing that geographical origin do not necessarily reflect the genetic diversity of accessions of J. curcas. This lack of correspondence between the molecular classification and geographic origin of the accessions could be due to their possible common origin, confirming the hypothesis that J. curcas genetic stocks of Asia and African were introduced from America (Li et al., 2017; Gangapur et al., 2018).
The challenge of all plant genetic breeding programs is to maintain the genetic diversity within the target species while improving desired traits that enable plant materials to perform well (Díaz et al., 2017). The results obtained in this study indicate the existence of a certain level of diversity that can be used by breeders. The choice of the parents can be based on the distance existing between the different genotypes. Based on the Nei’s standard dissimilarity matrix and the PCoA analysis using the combined SSR+AFLP data, the greatest heterosis might be expected from the following crossing schemes. Cross on the one hand, the two most genetically distant genotypes from Africa (genotype#9 from Congo and genotype#11 from Madagascar); and on the other hand, cross the two most genetically distant genotypes from America (genotype#21 from Ecuador and genotype#22 from Dominican Republic). Then, select from each cross, the best F1 progenies by phenotypic performance. Finally, cross the selected African F1 genotypes to the selected American F1 genotypes and select their best progenies according to their phenotypic performances. These selected progenies can be multiplied by vegetative propagation to preserve excellent clonal genetic stocks in the heterozygous status or used for further selections by back crossing. Such crossings might allow for greater success in the production of genetic variability and thus might maximize the exploitation of heterosis and segregation.
The authors have not declared any conflict of interests.
REFERENCES
|
Ambrosi DG, Galla G, Purelli M, Barbi T, Fabbri A, Lucretti S, Sharbel TF, Barcaccia G (2010). DNA markers and FCSS analysis shed light on the genetic diversity and reproductive strategy of Jatropha curcas L. Diversity 2(5):810-836.
Crossref
|
|
|
|
Angel IZD, García-Pérez E, Hernández DG, Pérez-Vázquez A, Reséndiz CÁ (2016). Genetic diversity of Jatropha curcas L. in Veracruz State, Mexico, and its relationships with the content of phorbol esters. Global Advanced Research Journal of Agricultural Science 5:149-158.
|
|
|
|
|
Antwi-Bediako R, Otsuki K, Zoomers A, Amsalu A (2019). Global investment failures and transformations: A review of hyped jatropha spaces. Sustainability 11:3371.
Crossref
|
|
|
|
|
Augustinos AA, Petropoulos C, Karasoulou V, Bletsos F, Papasotiropoulos V (2016). Assessing diversity among traditional Greek and foreign eggplant cultivars using molecular markers and morphometrical descriptors. Spanish Journal of Agricultural Research 14:e0710.
Crossref
|
|
|
|
|
Cardoso PMR, Dias LAS, Resende MDV, Freitas RG, Corrêa TR, Muniz DR, Zaidan IR (2018). Genetic evaluation and selection in Jatropha curcas L. Crop Breeding and Applied Biotechnology 18:192-199.
Crossref
|
|
|
|
|
Costa R, Pereira G, Garrido I, Tavares-de-Sousa MM, Espinosa F (2016). Comparison of RAPD, ISSR, and AFLP molecular markers to reveal and classify orchard grass (Dactylis glomerata L.) Germplasm Variations. PLoS ONE 11(4):e0152972.
Crossref
|
|
|
|
|
Díaz BG, Argollo DM, Franco MC, Nucci SM, Siqueira WJ, de Laat DM, Colombo CA (2017). High genetic diversity of Jatropha curcas assessed by ISSR. Genetics and Molecular Research 16(2):gmr16029683.
Crossref
|
|
|
|
|
Gangapur DR, Agarwal P, Agarwal PK (2018). Molecular markers for genetic diversity studies in Jatropha (Jatropha curcas L.). AIMS Environmental Science 5(5):340-352.
Crossref
|
|
|
|
|
Govender N, Senan S, Mohamed-Hussein ZA, Wickneswari R (2018). A gene co-expression network model identifies yield-related vicinity networks in Jatropha curcas shoot system. Scientific Reports 8:9211.
Crossref
|
|
|
|
|
Konan NO, Nacoulima LN, Diouf FH (2018). AFLP Analysis of genetic diversity among different Jatropha curcas L. Genotypes from Africa and Ecuador. Tropicultura 36:11-22.
|
|
|
|
|
Kumar RV, Tripathi YK, Shukla P, Ahlawat SP, Gupta VK (2009). Genetic diversity and relationships among germplasm of Jatropha curcas L. revealed by RAPDs. Trees-Structure and Function 23:1075-1079.
Crossref
|
|
|
|
|
Lacape JM, Nguyen TB, Thibivilliers S, Courtois B, Bojinov BM, Cantrell RG, Burr B, Hau B (2003). A combined RFLP-SSR-AFLP map of tetraploid cotton based on a Gossypium hirsutum x Gossypium barbadense backcross population. Genome 46:612-626.
Crossref
|
|
|
|
|
Leal AA, Mangolin CA, Amaral Júnior AT, Gonçalves LSA, Scapim CA, Mott AS, Eloi IBO, Cordovés V, Silva MFP (2010). Efficiency of RAPD versus SSR markers for determining genetic diversity among popcorn lines. Genetic and Molecular Research 9:9-18.
Crossref
|
|
|
|
|
Li H, Tsuchimoto S, Harada K, Yamasaki M, Sakai H, Wada N, Alipour A, Sasai T, Tsunekawa A, Tsujimoto H, Ando T, Tomemori H, Sato S, Hirakawa H, Quintero VP, Zamarripa A, Santos P, Hegazy A, Ali AM, Fukui K (2017). Genetic tracing of Jatropha curcas L. from its Mesoamerican arigin to the world. Frontiers in Plant Science 8:1539.
Crossref
|
|
|
|
|
Maghuly F, Jankowicz-Cieslak J, Parbinger S, Till BJ, Laimer M (2015). Geographic origin is not supported by the genetic variability found in a large living collection of Jatropha curcas with accessions from three continents. Biotechnology Journal 10(4):536-551.
Crossref
|
|
|
|
|
Mardi M, Naghavi MR, Pirseyedi SM, Alamooti MK, Monfared SR, Ahkami AH, Omidbakhsh MA, Alavi NS, Shanjani PS, Katsiotis A (2011). Comparative assessment of SSAP, AFLP and SSR markers for evaluation of genetic diversity of durum wheat (Triticum turgidum L. var. durum). Agricultural Science and Technology 13:905-920.
|
|
|
|
|
Marinho ACTA, Vasconcelos S, Vasconcelos EV, Marques DA, Benko-Iseppon AM, Brasileiro-Vidal AC (2018). Karyotype and genome size comparative analyses among six species of the oilseed-bearing genus Jatropha (Euphorbiaceae). Genetics and Molecular Biology 41:442-449.
Crossref
|
|
|
|
|
Moniruzzaman M, Yaakob Z, Shahinuzzaman M, Khatun R, Islam AKMA (2017). Jatropha Biofuel Industry: The Challenges. In: Jacob-Lopes E, Zepka LQ (Eds). Frontiers in Bioenergy and Biofuels. IntechOpen.
Crossref
|
|
|
|
|
Montes JM, Melchinger AE (2016). Domestication and breeding of Jatropha curcas L. Trends in Plant Science 21:1045-1057.
Crossref
|
|
|
|
|
Nei M (1978). Estimation of average heterozygosity and genetic distance from a small number of individual. Genetics 89:583-590.
|
|
|
|
|
Osorio LRM, Salvador AFT, Jongschaap REE, Perez CAA, Sandoval JEB, Trindade LM, Visser RGF, Loo EN (2014). High level of molecular and phenotypic biodiversity in Jatropha curcas from Central America compared to Africa, Asia and South America. BMC Plant Biology 14:77.
Crossref
|
|
|
|
|
Pamidimarri DVNS, Sinha R, Kothari P, Reddy MP (2009). Isolation of novel microsatellites from Jatropha curcas L. and their cross-species amplification. Molecular Ecology Resources 9:431-433.
Crossref
|
|
|
|
|
Pamidimarri SDV, Reddy MO (2014). Phylogeography and molecular diversity analysis of Jatropha curcas L. and the dispersal route revealed by RAPD, AFLP and nrDNA-ITS analysis. Molecular Biology Reports 41(5):3225-3234.
Crossref
|
|
|
|
|
Pavlicek A, Hrda S, Flegr J (1999). FreeTree - freeware program for construction of phylogenetic trees on the basis of distance data and bootstrap/jackknife analysis of the tree robustness. Application in the RAPD analysis of genus Frenkelia. Folia Biologica 45:97-99.
|
|
|
|
|
Peakall R, Smouse PE (2001). GenAlExV5: GeneticAnalysis in Excel. Population genetic software for teaching and research. Australian National University, Canberra, Australia. (Online).
|
|
|
|
|
Peixoto LA, Laviola BG, Alves AA, Rosado TB, Bhering LL (2017). Breeding Jatropha curcas by genomic selection: A pilot assessment of the accuracy of predictive models. PLoS ONE 12(3):1-16.
Crossref
|
|
|
|
|
Rosado TB, Laviola BG, Faria DA, Pappas MR, Bhering LL, Quirino B, Grattapaglia D (2010). Molecular markers reveal limited genetic diversity in a large germplasm collection of the biofuel crop Jatropha curcas L. in Brazil. Crop Science 50:2372-2382
Crossref
|
|
|
|
|
Sanou H, Angulo-Escalante MA, Martinez-Herrera J, Kone S, Nikiema A, Kalinganire A, Hansen JK, Kjaer ED, Graudal L and Nielsen LR (2015). Loss of genetic diversity of Jatropha curcas L. through domestication: Implications for its genetic improvement. Crop Science 55:749-759.
Crossref
|
|
|
|
|
Soto I, Ellison C, Kenis M, Diaz B, Muys B, Mathijs E (2018). Why do farmers abandon Jatropha cultivation? The case of Chiapas, Mexico. Energy for Sustainable Development 42:77-86. https://doi.org/10.1016/j.esd.2017.10.004
Crossref
|
|
|
|
|
Subramanyam K, Muralidhararao D, Devanna N (2009). Genetic diversity assessment of wild and cultivated varieties of Jatropha curcas (L.) in India by RAPD analysis. African Journal of Biotechnology 8(9):1900-1910.
|
|
|
|
|
Tjeuw J (2017). Is there life after hype for Jatropha? Exploring growth and yield in Indonesia. PhD Dissertation, Wageningen University, Wageningen Netherlands, 223p.
|
|
|
|
|
Vandepitte K, Valdés-Rodríquez OA, Sánchez-Sánchez O, De Kort H, Martinez-Herrera J, García-Pérez E, De Meyer T, Pérez-Vázquez A, Muys B, Honnay O (2019). High SNP diversity in the non-toxic indigenous Jatropha curcas germplasm widens the potential of this upcoming major biofuel crop species. Annals of Botany 20:1-8.
Crossref
|
|
|
|
|
Vásquez-Mayorga M, Fuchs EJ, Hernández EJ, Herrera F, Hernández J, Moreira I, Arnáez E, Barboza NM (2017). Molecular characterization and genetic diversity of Jatropha curcas L. in Costa Rica. Peer Journal 5:e2931.
Crossref
|
|
|
|
|
Wright S (1951). The genetical structure of populations. Annals of eugenics 15:323-354.
Crossref
|
|