A cross sectional survey was conducted to characterize production system and to identify breeding objectives of Maefur goat population in the eastern zone of Tigray, Northern Ethiopia. A pre-tested questionnaire was used for the personal interview with purposively selected 150 households. The data collected through personal household interview were analyzed using descriptive statistics. Indices were used to provide the ranking. The mean (±SD) family size of the household was 8.5±2.1. The average (±SD) livestock holdings of the sampled household for goat, chicken, sheep, bee colony, and cattle were 31.0±11.1, 12.2±4.2, 6.8±4.5, 3.7±3.7, and 3.0±1.5, respectively. Does are mainly reared for milk, breeding, meat and for manure production with an index value of 0.25, 0.24, 0.17 and 0.14, respectively. Average composition of goat flock was 50, 22, 15, 10, and 3% for does, gimmers, bucks and wethers, respectively with an average ration of intact male to female goat was 6.3:1. Male and female goat reached for sexual maturity at the average (±SD) age of 11.1± 1.5 and 12.7±2.1 months, respectively with an average (±SD) age of 21.1±2.0 months at first kidding of the female goat. The average (±SD) kidding interval was 7.1±0.6 months.
General household characteristics
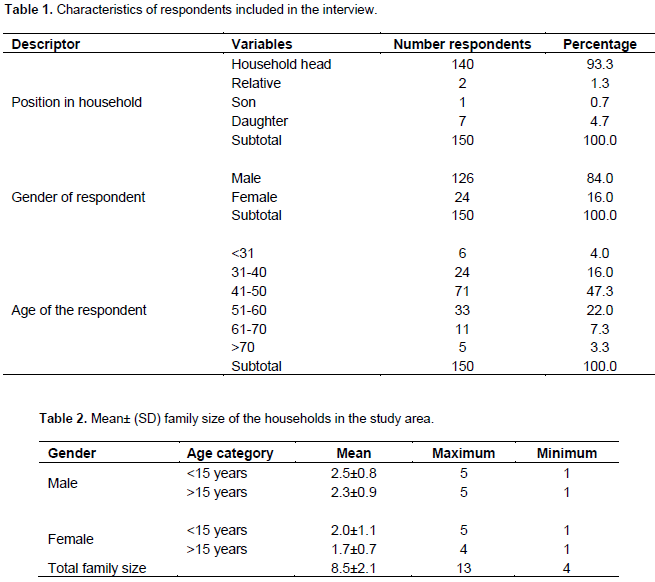
One hundred and fifty households (150) participated in survey research work as respondent in personal household interview (Table 1). The respondents were household head, son of the household head, daughter of household head and other relatives. Male and female-headed households represented about 83.3 and 10% of the overall proportion (93.3%) of respondents. To validate this finding, relevant literature is available. Among the similar study report, Bosenu et al. (2014) discussed that 73.3% of the interviewed households were male-headed households. The current study compared this information with the proportion of male and female-headed households in the district. The proportion of male and female-headed households from the total number of 6900 households found in the district was 58.4 and 41.6%, respectively. The mean ± (SD) composition of the households for male less than 15 years and greater than 15 years old age were 2.5±0.8 (1 to 5) and 2±1.1 (1 to 5), respectively (Table 2). The mean ± (SD) composition of the households for female in these age were 2.3±0.9 (ranging 1 to 5) and 1.7±0.7 (ranging from 1 to 4), respectively. The overall mean family size of the households was 8.5±2.1 (ranging from 4 to 13).
Characterization of the goat production systems
Majority (98%) of the respondents indicated that agro pastoral production system was the dominant livestock production system in which human and cattle settled with limited land holding for cereal cultivation. Goat flocks are kept to move towards the potential communal grazing land of Sengede for specific period possible with herders’ ready stay around the resource area for a week. There is a broad question: why is goat dominant in the pastoral and agro pastoral production system? Regarding this question the main driven force is searching for water for animals and the communal rangeland (Solomon et al., 2010; Wilson, 1991). In most pastoral system, goat spends more efforts searching for feed and water which is mostly associated with mobility towards the resource area (Tsedeke, 2007).
Livestock holding and their relative importance for households
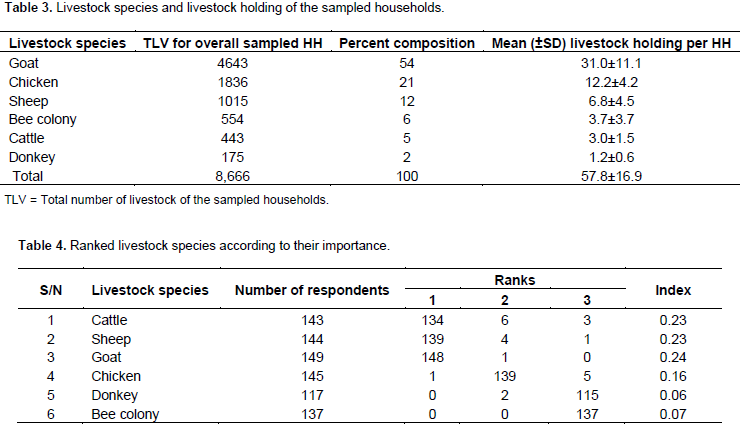
The average (±SD) livestock holdings of the sampled household for goat, chicken, sheep, bee colony, and cattle were 31.0±11.1, 12.2±4.2, 6.8±4.5, 3.7±3.7, and 3.0±1.5, respectively (Table 3). The current study observed that the average holding of goat in the sampled households was relatively higher than the average holding of other livestock species. There are reviewed literatures, which indicate there might be a shifting of livestock holding because of the changing environmental conditions (Solomon et al., 2010). The current study found that goat, sheep, and cattle were considered as most important livestock species with an index value of 0.24, 0.23, and 0.23, respectively (Table 4). Goat in the study area adapted to the mountainous topographical feature, were able to survive, reproduce, and provide milk, meat, and was source of income to smallholder farmers. This is the reason why goats were ranked first by households because of their ability of utilizing various browse plant species and to stand and, climb to browse from shrubs. Similar findings were obtained for the above reason in Amhara region of Metema woreda (Tesfaye, 2009). According to the respondents' point of view, households have developed their own weighting preference on the desirable traits over the specified livestock species.
Breeding objective of the indigenous Maefur goat population
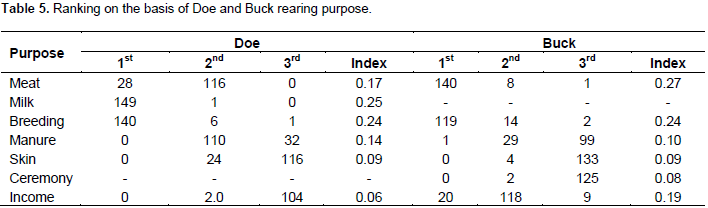
Respondent`s ranking of the production objectives of buck and doe are presented in Table 5. The main purpose of keeping bucks was for meat, breeding, income generation, and manure production with an index value of 0.27, 0.24, 0.19, and 0.10, respectively while the does were mainly for milk, breeding, meat, and source of manure with an index value of 0.25, 0.24, 0.17, and 0.14, respectively. The respondents realized that they first prioritized bucks during festival when there is a need to prepare food from meat and retained one buck for breeding. If they produced access bucks, they sold them for the immediate source of income. Similar findings on identifying the breeding objectives of goat under pastoral and agro pastoral production are system discussed by Adugna and Aster (2007), Solomon et al. (2010) and Tesfaye (2009) in different part of Ethiopia. There is also similar report on breeding objectives of goat under mixed crop-livestock production system reported by Lamba (2015) in Loma District, southern Ethiopia in lowland, midland, and highland agro ecologies.
Goat flock ownership
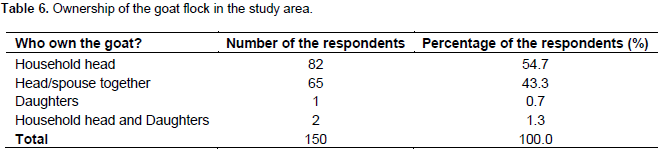
According to the respondents point of view, the whole member of the family could have a sense of goat flock ownership for common wealth (Table 6). However, on behave of the whole family within the households, the ownership was under the household head (husband) and head/spouse jointly with the respondents' proportion of 54 and 43.3%, respectively. This finding of the current study is in parallel to the previous research work done by Tesfaye (2009) who reported that large proportion of goat flock were owned by husband while wife owned 29.0% of the goat flock in Metema Woreda, Amhara region, Ethiopia.
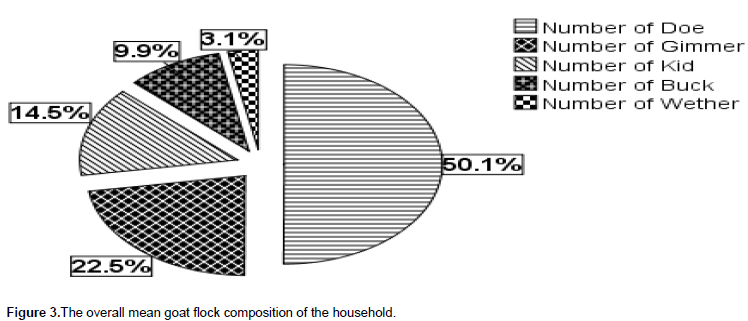
Goat flock composition
The approach for describing this information used age class categories of the flock and the reproductive physiological status of the male goat like intact male (buck) and castrated male (wether). The age categories used in this study is equivalent to the goat age categories of CSA (2017). The flock composition summarized as kids (male and female) are under 6 months age, gimmers with the age range of 6 months to 1 year, buck with age of 1- 2 years, does with the age of 2 and above years and castrated with 2 and above years (Figure 3). Accordingly, the overall average composition of goat flock for kids, gimmers, bucks, does, and wethers was 15, 22, 10, 50, and 3%, respectively. This report of the current finding is in parallel to the research report of Belete (2009) who studied flock composition of the household which used similar age categories of goat in Goma district of Jimma zone of Western Ethiopia. The current study found that the average proportion of the does to bucks in the study area was 6.3:1. The finding of the current study is more similar with the study report of Tsedeke (2007) who found the proportion of the does and bucks as 6.6:1 to 6.8:1. However, the general recommendation on the proportion of doe and buck suggested by Wilson and Durkin (1988) is 25:1. The current study revealed that smallholder farmers retained enough number of bucks for breeding purpose.
Feed resource for goat flock
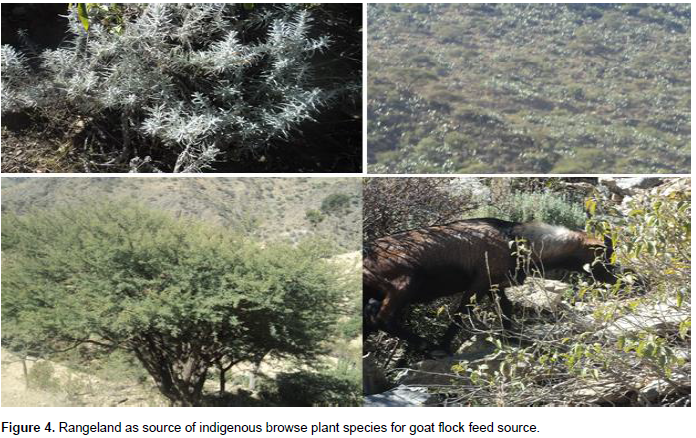
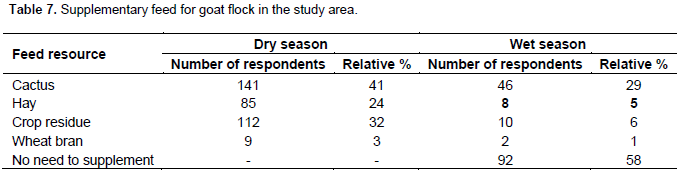
According to the observational study point of view, indigenous goats are free grazing around the mountainous rangeland (Figure 4). This observation coincided with other observational studies in different part of Ethiopia as they indicate goats are browsers that spent more time during the daytime searching for edible green feeds from different plant species (Girma et al., 2013). The respondents indicated that supplementary feeds (mostly roughage) like cactus (41%), crop residue mostly maize Stover (32%) and hay (24%) are required during prolonged drought (dry season) for providing supplementary feed for goat flock (Table 7). Majority (58%) of the respondents indicated no need of supplementation during the wet season but about 29% of the respondents replied that there was a need of supplementation of cactus for goat flock if there is a shortage of feed during the wet season (Table 7). This finding of the current study is in agreement with those of previous finding of Tesfaye (2009) who reported that the source of feed for goat in Metema district Amhara region, Ethiopia is main from rangeland (pasture land).
Flock health management and factor for death of goat
Access to veterinary service
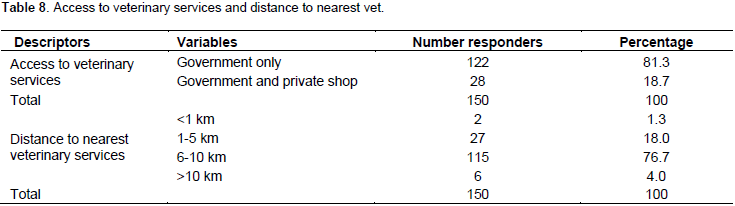
Even though the district has a regular control mechanism for disease and parasite, there is still a problem of poor health management of the goat flock under smallholder framers. As the study area is with up and down hill topographical features, giving animal health management services is very tedious. It needs more transportation facilities to keep diseased animals from lost. Most of the respondents discussed about animal health they got from government only (81.3%) or government and private veterinarians (18.7%) within the distant range of 6-10 km (76.7%) while 18% of the respondents could access goat veterinary services within a range of 1-5 km (Table 8).
Occurrence of goat death in the study area
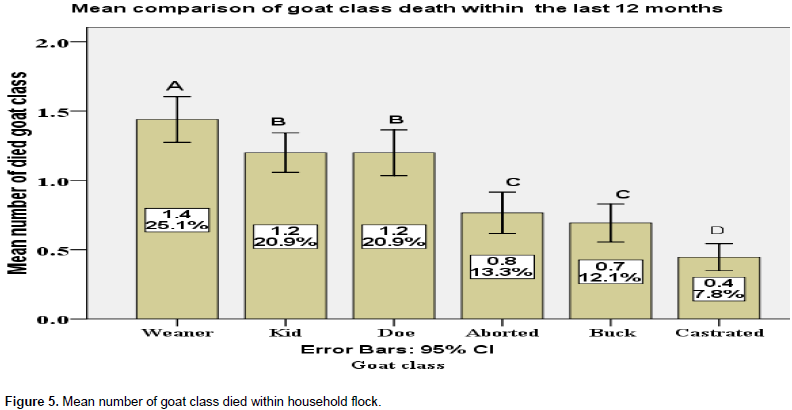
The mean ±(SD) for death of aborted, kid, weaned, doe, buck and castrated in the last 12 months per households were 0.8±0.9, 1.2±0.9, 1.4±1.0, 1.2±1.0, 0.7±0.8 and 0.4±0.6, respectively (Figure 5). The study revealed that higher proportions weaned kids (25.1%) are lost from the flock than any other goat class due to occurrence of death. The study is confident enough to provide this information at the level of 95% of confidence Interval.
Factor for goat death
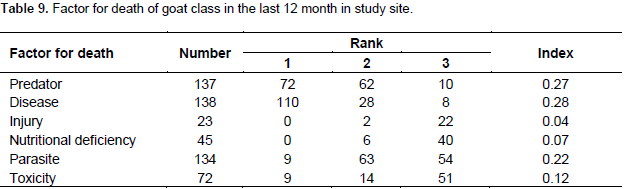
The main factors for goat death are listed in Table 9. The respondents indicated that goat died due to disease, infestation of parasite and incidence of predator (mainly tiger) with an index value of 0.28, 0.27, and 0.22, respectively. The death of goat flock was aggravated by feed toxicity and nutritional deficiency of the goat flock with an index value of 0.12 and 0.07, respectively. The main factors for goat death reported in the current study are common cause of goat death in different part of Ethiopia reported by Fikru and Gebeyew (2015) and Solomon et al. (2011).
Goat disease surveillance
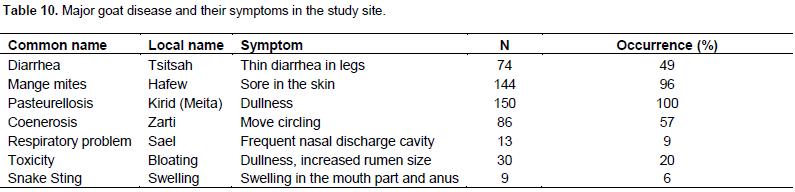
The most common diseases in the study area were addressed from the description of symptoms noted down during the field survey study. The most noticeable goat disease that occurred in the study area was Pasteurelosis (kirid or meita) indicated by 100% of the respondents. Mange mites (Hafew), Coenerosis (Zarti), Diarrhea (Tsehtsah) and feed toxicity were the major goat disease reported by about 96, 57, 49 and 20% of the respondents, respectively (Table 10). Snake stings and respiratory problem (Sael) were reported by 9 and 6% of the respondents. The smallholder households described diseases using local names. Veterinary names of the diseases were established based on farmers’ description of the symptoms. These major diseases of goat are the common goat disease in Ethiopia (Solomon et al., 2011. Almost all (100%) of the respondents did not use traditional control method for the mentioned goat prevalent disease. Modern control method for the major goat disease was done when a need arose (99.3%) by goat flock owners.
Internal and external parasite of goat and their control method
The most common internal parasite of goat in the study area hosted inside the gastro intestinal track was nematodes mostly the large parasitic tapeworm species of Taenia local name Habie. The control activities for this gastro intestine nematode was done when the need arise indicated by about 98.0% of the respondents. Out of 150 respondents, almost all (99%) the respondents reported that dipping and spraying were the most important and widely used modern control for external parasite. About 43 and 14% of the respondents reported that they control the external parasite of the goat population through traditional methods and using tablets, respectively. The most common type of external parasite was tick, lice, and their control activities done routinely by about 54% and done when need arise by about 46.0% of the sampled household.
Goat flock dynamics
Mean total exit from goat flock
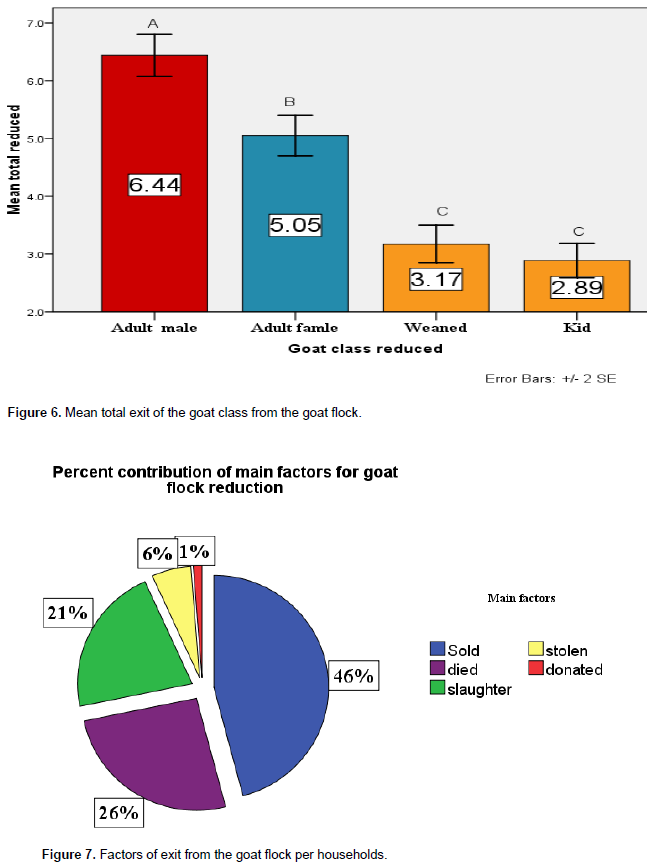
Among the goat class, adult male with mean ± (SD) total exit from the goat flock (6.4±2.2) were highly reduced (A) followed by adult female (B), weaned (C) and kids (C) with mean± (SD) total reduction of 5.1±2.2, 3.2±2.0 and 2.9±1.9, respectively (Figure 6). Figure 7 illustrates the main factor for total reduction of goat flock per household and the relative contribution of the main factor to the mean total reduction. Goat sold contributed about 46% to the total reduction in goat flock size in the study area. This result is higher than from the findings of Tsedeke (2007) reported as 29.4%. The current study found that goat death (mortality) contributed about 26% to the total reduction of goat flock but Tsedeke (2007) reported that mortality is accounted for 49.2% from the total reduction of goat flock size. Slaughtering also contributed 21% to the total reduction of goat flock in the study area. Commercial off-take and mortality rate might be the major cause for goat flock decline under traditional management system (Solomon et al., 2011). Figure 7 shows small proportion of goat lost from flock through theft (6%) and donation (1%).
Mean total entry to goat flock
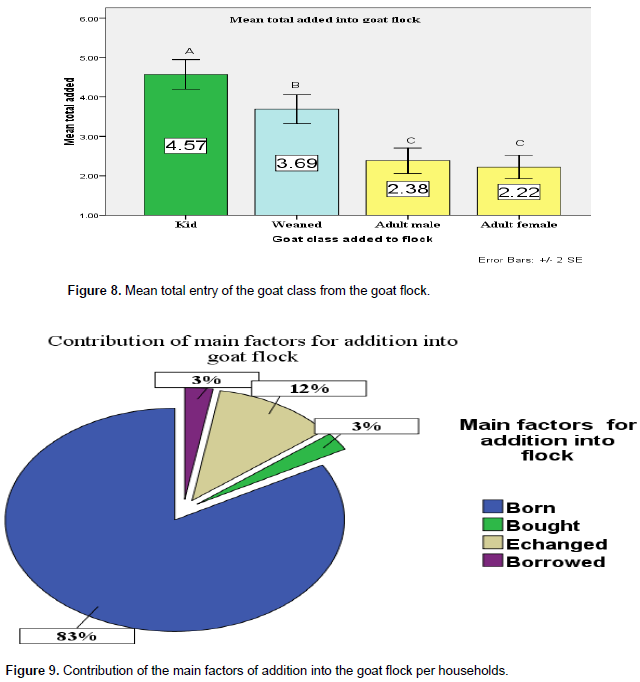
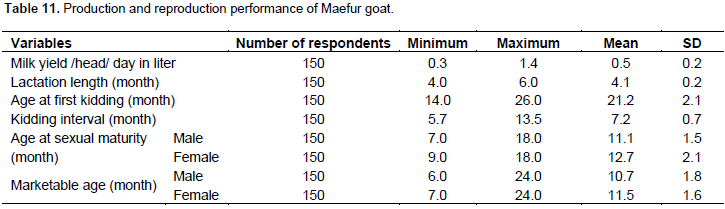
Figure 8 shows that the mean total entry into the goat flock of the households was higher for kids followed by weaned. The mean± (SD) total entered to the goat flock for adult male, adult female, weaned and kids were 2.4±2.0, 2.2±1.8, 3.7±2.2, and 4.6±2.3, respectively. The average entry of adult male and female into the goat flock of the households was similar. With the increased number of kid and weaned, goat flock within household are able to compensate the decreasing number of flock under traditional management system. This is one mechanism for flock productivity evaluation in general. Figure 9 illustrates that the contribution of each factors for entry into goat flock. The current study found that born contributed about 83% to build the goat flock in the study area. This finding is in line to the finding of Tsedeke (2007).
The overall trend of the goat flock of the sampled household
The overall mean± (SD) total reduction from goat flock per the households in the study area was 17.5±4.4 whereas the overall mean± (SD) total added was 12.9±2.3. The overall mean± (SD) total reduced goat flock in the last 12 months was higher than the overall mean± (SD) total added. The average net off take of the goat flock under the agro pastoral and pastoral production system was 4.9. Based on this evidence the important breed in the study site decreased both in composition and in total number of the goat flock.
Productive performance of Maefur goat
Milk production and lactation length
According to the respondent point of view, goat milk in the study area is very important source of food. Goat milk is not processed in the pastoral and agro pastoral livestock production system (FARM-Africa, 1996). The estimated milk yield and lactation length are presented in Table 11. Selling goat milk is a cultural taboo in the study area. Average milk yield of the goat under study was 0.5±0.2 (SD) L per head per day; ranges from 0.3 to 1.4 L per head per day. The average lactation length was 4.01±0.7 (SD) months; ranges from 4 to 6 months. This finding is somewhat higher from goat in Ethiopia reported by Alefe (2014) as 3.6 months. The overall average milk yield per lactation length was 60.1 L per head. The overall average milk production per head is similar with other milk production of goat in pastoral and agro pastoral livestock production system (Alefe, 2014).
Marketable age male and female goat
The average marketable age for Maefur he male and female is presented in Table 11. The mean marketable age of the goat in the study site was 10.7±1.8 (SD) and 11.5±1.6 (SD) for male and female goat, respectively. This result is similar with the average marketable age of male and female goat as 11.01 and 11.69 months for male and female goats, respectively in other part of Ethiopia (Alefe, 2014).
Reproductive performance
Age at puberty
The age at puberty for male and female goat is presented in Table 11. According to the respondent, the age at puberty is defined as the age at which male produced viable sperm for successful mating and female produced fertile eggs and gets pregnancy. The average age at puberty for male and female was 11.1±1.5 (SD) and 12.7±2.1 (SD) months, respectively. This result is higher than from age at first puberty of Begait goat reported as 6 months and 7 months, respectively by Gebrekiros et al., (2016) and Tsedeke (2007).
Age at first kidding
The average (mean ±SD) age at first kidding in the study area was 21.1±2.0 month ranges from 19.1±2.2 and 23.3±2.0 months. Tesfaye (2009) reported that the age at first kidding varied between 7 and 24 months for Metema goat, Amhara region. The age at first kidding under traditional management system is largely depends on the management and availability of feed. Late age at first kidding might be the result of fail to conceive after mating led to large age at first kidding.
Kidding interval
The average kidding interval of the indigenous goat in the study area was 7.1±0.6 months (ranges from 8.2±0.8 to 6.2±0.7 months). The current result is in line to the previous report for goat breed of Ethiopia reported by Tesfaye (2009) as 8.4 ±1.4 months. However, it is lower than from kidding interval of Abergelle and central highland goats reported as 11.31±2.2 and 10.3 ±1.42 months, respectively (Belay, 2008; Tesfaye, 2009).
Liter size
The most common type of litter size was singleton with an index of 0.43 followed by twins with an index value 0.37 in the study area (Table 12). Maefur goat breed gives birth to triplets with an index value of 0.20. The average litter size for most of the goat breed of Ethiopia is reported as a singleton (Tsedeke, 2007; Solomon et al., 2011; Endashew, 2007 and Adugna and Aster, 2007).
Average weaning age
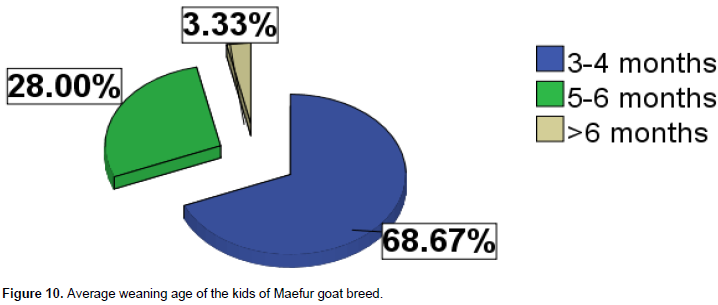
Majority of the respondents (68.7%) indicated that kids weaned when they reached at 3-4 months age interval on average but sometimes weaned between 5-6 months (28%) age interval (Figure 10). This result is in agreement with the report of Tesfaye (2009) who found mean weaning age for both male and female as 4.1 months for Metema goat of Amhara region evaluated on farm with protein supplementation. However, kids weaned rarely at greater than 6 months (3.3%). Therefore, kids grow well to reach the age for meat consumption.
Status of Maefur goat population
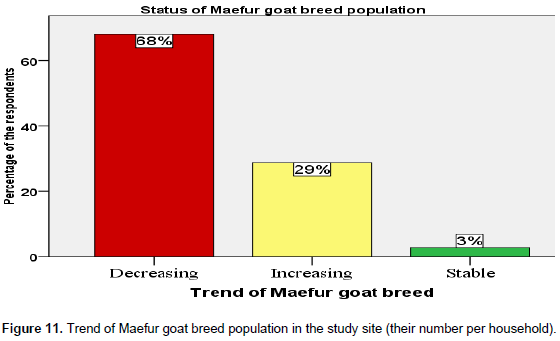
Majority (68%) of the respondets indicated that the status of Maefur goat population was decreasedfrom time to time (Figure 11). According to the respondent’s point of view, the main reason for decreased trend of goat population was the rare availability (53%) of goat breed. The other factor for the decreased goat population were decreased interest of households (3%) that means they did not add goat into their goat population and the breed become rare (7%) due to prolonged drought in the area. The reasons for increased number of goat population were increased interest of the households (19%) through addition of goat into their population and breed becomes available (17%) for household rapid recovery in reproduction performance.
Breeding management
Selection of breeding Buck and Doe and traits preferred of the smallholder
The selection criteria for breeding bucks involved size, conformation, color, temperament, and performance (Table 13). Size, performance, and body conformation were the most important selection criteria for breeding bucks with index values of 0.29, 0.28, and 0.27, respectively. However, Belete (2009) reported that conformation is first prioritized followed by performance for selection of buck. Size of the buck is the collective observation on his body length; heart girth and height at wither. Based on the index value, the owner used large body size as primary selection criteria. Buck with wide conformation and optimum body condition was selected for breeding purpose. Temperament (index value 0.11) and color except black (index value 0.06) were supportive selection criteria for bucks.
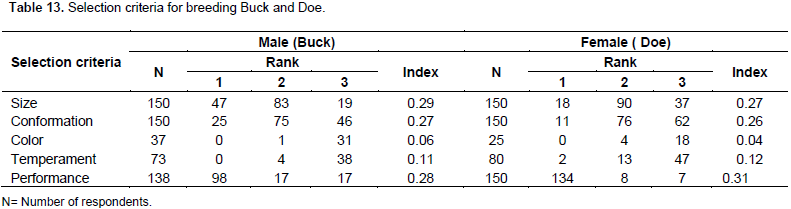
The households first prioritized the production traits of their goat flock and then the physical appearance for selection of breeding bucks. The selection criteria for doe (breeding female) included milk yield and breeding performance, size, and conformation, temperament, and body color. The most important selection criteria for breeding doe are performance, size, and conformation with index values of 0.31, 0.27, and 0.26, respectively (Table 13). The responders indicated that those criteria are the primary factors for female breeding characteristics. According to the respondents, temperament and body color with index values of 0.12 and 0.04, respectively were useful criteria for selection of breeding female.
Culling unwanted goat from reproduction
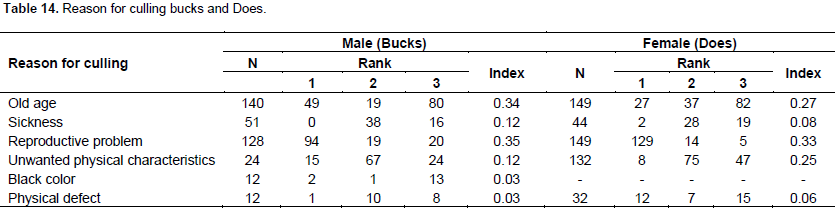
The reasons for culling male and female goat are listed in Table 14. The respondents indicated that farmers practiced culling unwanted male and female from goat due to various reasons. The major reasons for culling male goat include reproductive (fertility) problem and old age with an index value of 0.35 and 0.34, respectively. The major reasons for culling female goat include reproductive (fertility) problem, old age, and unwanted physical characteristics with index values of 0.33, 0.27, and 0.25, respectively. The level and degree for culling reasons might be varying across different places. This finding of the current study is in line to the previous findings of (Belete, 2009) who reported that higher percentages of goats were culled due to fertility problem (90.9%) and unwanted physical characteristics (81.8%).
Kidding and breeding season of the goat
Major kidding season occurred in the dry season of Octobers, November, and December with index values of 0.16, 0.15, and 0.16, respectively. The minor breeding season occurred in May, June and July with index values of 0.12, 0.14, and 0.14, respectively. Rare breeding season occurred in August and September and January with index values of 0.04 and 0.07, and 0.01, respectively. The natural environment governs at what time of mating/kidding occurred with respect to the availability of feed (Solomon et al., 2011). Two possible breeding seasons of the goat flocks were identified. As to the index value of 0.03 and 0.08, some goat flock started at early March and April, respectively (Table 15). As the rainy season intensified, goat population adjusted their breeding season. The occurrence of breeding season intensified between May, June and July with an index 0.18, 0.19, and 0.18, respectively.
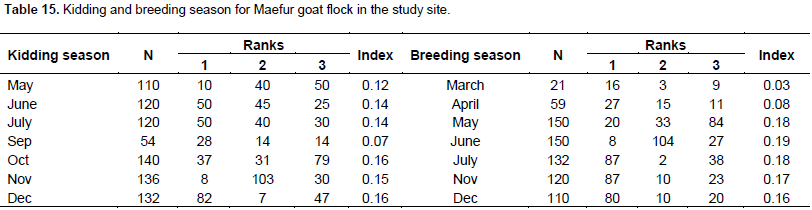
Therefore, the major breeding seasons for goat flock in the study site are between May and July. The second breeding season was between November and December with index values of 0.17 and 0.16, respectively. However, Tsedeke (2007) reported that the major breeding seasons for goat flock in Alaba, southern Ethiopia are between November and January whereas the minor breeding season are April and June. The owner of the flock in the current study area justified that the occurrence of the breeding season mainly depends on the availability of feed, which determines the body condition of breeding animals. The breeding season might be collapsed by the prolonged dry season.
Origin of the breed
About (43.3%) of respondents reported that they obtained their goat flock from parents through inheritance and bought from neighbor farmers whereas 29.3% of the respondents reported that the origin of the goat flock was from parents transferred from generation to generation through inheritance. Small proportion (14.7%) of the respondents reported that their goat breed originated from own flock since long time ago. Majority (80.7%) of the respondents reported that the indigenous goat is moderately tractable whereas 19.3% of respondents indicated that the breed is docile.
Constraints of goat production
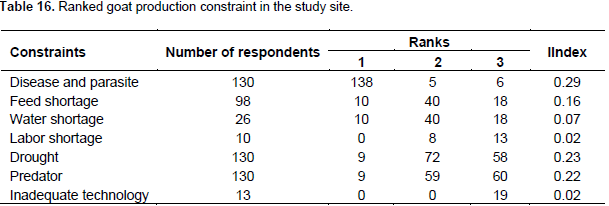
The major limiting factors for constraints of goat production in the study area are presented in Table 16. The incidence of disease and parasite with an index value of 0.29 was the major limiting factor for goat production under traditional management system. The problem of prolonged drought with an index value of 0.23 aggravated the incidence of disease and parasite causing major constraints for goat production. According to the respondents’ point of view, the problems of predators were the third major constraint with an index value of 0.22. This finding of the current study is comparability similar to the previous findings reported by Tsedeke (2007) and Solomon et al. (2011) who studied similar constraints for poor fertility of the goat production across the pastoral and agro pastoral production system in Ethiopia.

 \
\


