ABSTRACT
Length of productive life is an important economic trait in dairy cattle that has shown to have a genetic component and thus, it is subject to improvement through selection. Lifetime records of 13,659 Holstein cows from 72 herds, calving for the first time between January 2000 and December 2014 and their conformation, milk yield (ME 305 d milk) and pedigree information were used to evaluate the relationship of conformation and length of productive life. Length of productive life was adjusted to a maximum of 305 days for each lactation and of these 34% were right censored records. The objective of this study was to investigate the effect of conformation traits on the genetic evaluation of functional length of productive life of Mexican Holstein cattle using survival analysis with a sire-maternal grandsire model. The hazard function was modeled with a baseline function assumed to follow a Weibull distribution, including the fixed covariates of age at first calving and conformation traits (one at a time), time dependent covariates (random effect of herd-year of calving, milk yield level, and lactation phase with changes at 29, 249 and 305 days in each of the first four lactations), and random effects of sire and maternal grandsire. All effects incorporated in the model, before including conformation traits had significant contributions to the likelihood function (P <0.05), and when conformation traits were included, five of them (chest width, teat length, median suspensory ligament, udder texture and udder depth) were statistically significant in order to predict breeding values for length of productive life; therefore the genetic evaluation for length of productive life should include these traits as indirect predictors of longevity. This study strongly recommends the inclusion of conformation traits in the model for genetic improvement of length of productive life of Mexican Holstein cattle.
Key words: Holstein cattle, genetic improvement, conformation traits.
Abbreviation:
LPL, Length of productive life; HW, height to the withers; ST, stature; SI, size; CW, chest width; BD, body depth; LO, loin strength; RA, rump angle; RW, rump width; FA, foot angle; UN, claw uniformity; DH, heel depth; BQ, bone quality; RSV, rear leg side view; RLW, rear leg rear view; FUA, fore udder attachment; FTP, front teat placement; TL, teat length; MSL, median suspensory ligament; TE, udder texture; RUH, rear udder height; RUW, rear udder width; RTP, rear teat placement; UD, udder depth; DF, dairy form.
Functional longevity was defined by Ducrocq et al. (1988) as the ability of the cow to avoid culling for reasons other than low performance and it has been reported to be strongly related with length productive life (LPL) measured as the time from the first calving to the death or culling of a cow adjusted by production level (Chirinos et al., 2007). LPL is a trait of increasing importance in cattle breeding programs. In dairy, the economic advantage of LPL lies mainly in retaining productive and healthy cows for as long as possible in the herd and it’s important because when herd life is increased, expenses for raising replacement heifers can be decreased (Boettcher et al., 1997); in addition, lifetime milk production can be larger (Van Raden and Wiggans, 1995). LPL of a cow in the herd is influenced by different factors, for example fertility, milk yield, health, management and other reasons of voluntary culling (Ducrocq and Sölkner, 1998a; Weigel et al., 2003).
Many of the current genetic evaluation models for LPL in dairy cattle are based on survival analysis, which allows to combine data on both dead (uncensored/ observed LPL) and alive (censored/unobserved LPL) individuals, and enables a proper statistical treatment of censored records and accounts for nonlinear characteristics of LPL data. Survival analysis also allows the estimation of random effects using the covariance structure among observations based on genetic relationships and the calculation of animal culling risks with a mixed model (Ducrocq and Sölkner 1998b; Caraviello et al., 2004). Different traits have been used in order to increase the reliability of the prediction of breeding values for LPL in cattle. For many years, conformation traits have been used as indirect selection criteria for herd life since they can be measured early in productive life (usually during the first lactation) and have moderate genetic correlations with LPL. Different studies have used conformation traits in order to predict LPL (Vukasinovic et al., 2002; Caraviello et al., 2004; Sewalem et al., 2004). In previous studies of dairy cattle in Mexico, longevity was calculated as stability at 48 months or as LPL at the third lactation, using linear mixed models (Valencia et al., 2004) and more recently, survival analysis was used to study LPL including the effect of milk yield level, age at first calving and the time dependent variable of lactation phase (Abadía et al., 2016), but the impact of indirect indicators such as conformation traits has not been evaluated. The Mexican Holstein association scores 24 conformation traits describing udder, feet and legs, rump and body structure systems in a linear scale from 1 to 9, and the explanation of each trait is presented in Appendix A. All traits are being scored according to the standards of the World Holstein Friesian Federation (WHFF, 2005). Considering that LPL is of high economic importance, it presents low heritability and that it is measured late in life, the use of indirect predictors measured early in the LPL of a cow to improve breeding value calculations for this trait is warranted. The objective of this study was to evaluate the effect of conformation traits on the genetic evaluation of LPL of Mexican Holstein Cattle in order to provide a suitable model for the studied population.
The data set obtained from the Mexican Holstein Association consisted of 37,870 lactation records, corresponding to 13,659 Holstein cows, calving for the first time between January 2000 and December 2014. Data files had corrected ME 305 d milk yield with an average ± STD of 10,050 ± 4,368 kg, age at first calving with an average ± STD of 24.76 ± 2.08 months, censoring indicator (34% of right censored records), LPL adjusted to 305 days per lactation, with accumulated days from the first to the fourth lactation with an average ± STD of 706.90 ± 330.82 days, information of the sire and maternal grandsire and score of 24 conformation traits: height to the withers (HW), stature(ST), size (SI), chest width (CW), body depth (BD), loin strength (LO), rump angle (RA), rump width (RW), foot angle (FA), claw uniformity (UN), heel depth (DH), bone quality (BQ), rear leg side view (RSV), rear leg rear view (RLW), fore udder attachment (FUA), front teat placement (FTP), teat length (TL) , median suspensory ligament (MSL), udder texture (TE), rear udder height (RUH), rear udder width (RUW), rear teat placement (RTP), udder depth (UD), and dairy form (DF). All conformation traits were measured in a 1 to 9 discrete scale, and classes with less than 50 observations were added to the immediate superior (classes 1 through 4) or inferior class (classes 6 through 9). Following the methodology described by Ducrocq et al. (1988) the production level was calculated based on the normal distribution of ME Milk yield, animals were classified into 10 levels of milk yield for each lactation, being 1 the lowest production level and 10 the highest. In order to better represent changes in culling risk due to within lactation reproduction and production stages of the cow, the time dependent variable lactation phase was included in the model. Three levels per lactation were considered, the first one from day 1 to 29, the second one from day 30 to 249 and the last one from day 250 to 305. The programs used for editing the data were FORTRAN 5.0 and SAS 9.3.
Model
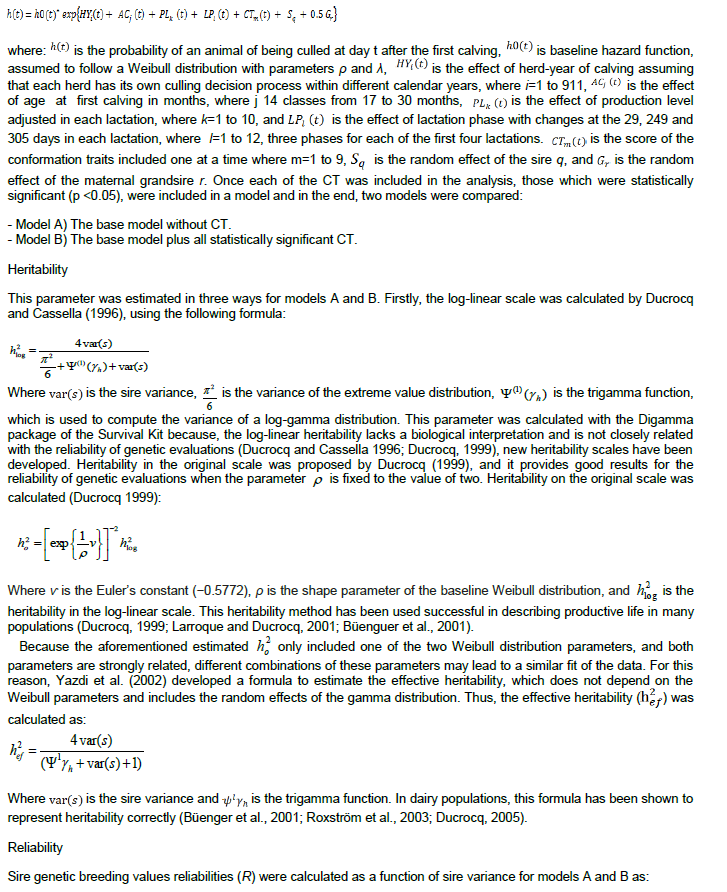
A Weibull survival model was used for this study. The parameter estimation of the Weibull distribution and the prediction of genetic values were performed using the Survival Kit Software V3.12 (Ducrocq and Sölkner 1998a; Ducrocq 1994), using a sire-maternal grandsire model and including time dependent variables(t). The hazard function h(t) for a particular cow at time t was modeled as follows:
From each hazard function, it is possible to semi-parametrically estimate a baseline survivor function (S) and if a Weibull model is adequate, a plot of ln (-ln Åœ) versus ln (t) should give a straight line with a slope equal to p (Kleinbaum, 1996). In this study, the test graph of survival analysis, gave a straight line with a slope close to ρ (1.89) (graph not shown); this results indicates that a Weibull model is proper for the data. Similar ρ values have been estimated in other studies (Dürr et al., 1999; Vollema et al., 2000; Chirinos et al., 2007; Schneider et al., 2005).
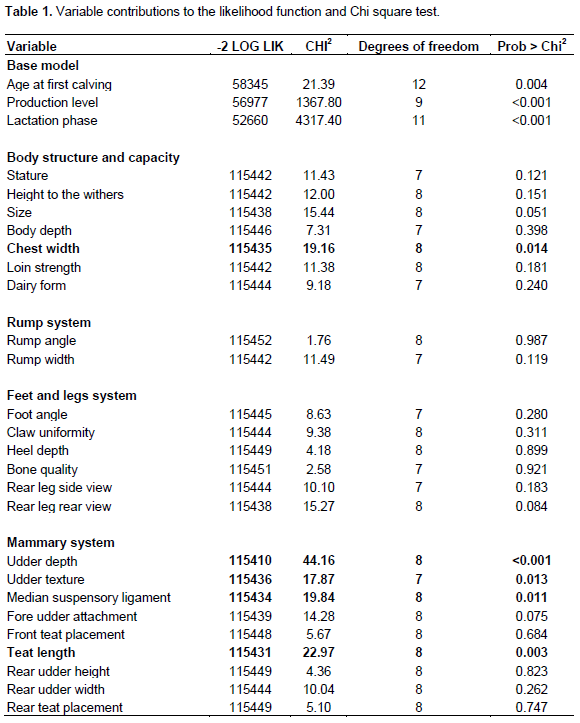
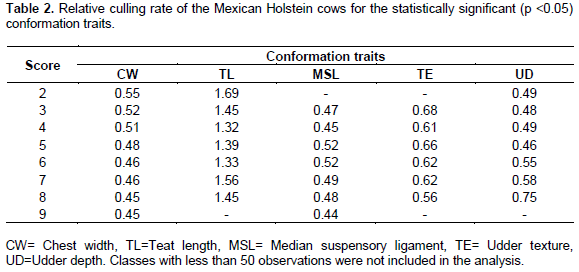
All base model effects (AC, PL and LP) were statistically significant (p <0.005), and when CT were tested one at a time, only one body and four udder CT were statistically significant (CW, TL, MSL, TE and UD). Table 1 shows the contribution of variables to the log likelihood function, including all CT scored in Mexico.
Age at first calving (AC)
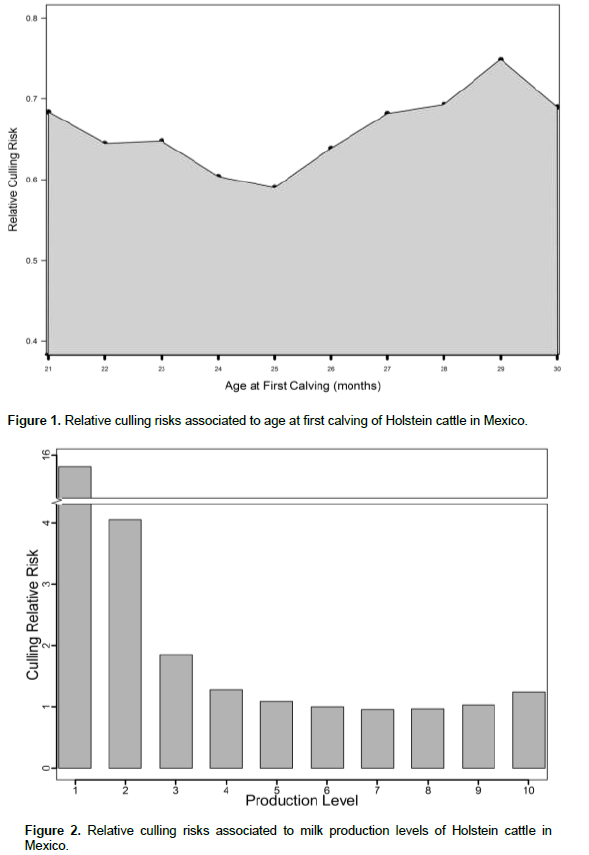
Cows calving at 21 months of age presented a relative culling risk of approximately 0.7 and it decreased as age at first calving increased until 25 months of age, when cows showed the lowest risk to be culled. Previous studies in the Mexican Holstein population also reported higher culling risks when cows calve early (Abadía et al., 2016), and it could be due to the fact that heifers that calve before 24 months of age, have not reached the appropriate size and weight to calve and this could influence the relative risks. In this study, cows calving after the 26 months showed an increased relative culling risk until the 30 months (Figure 1) possibly because they start their productive life later and reach later parities at older ages. These findings agree with those reported in other populations, where culling risk increased with age (Chirinos et al., 2007, Mészáros et al., 2008).
Production level
The influence of production level on relative culling rates is shown in Figure 2. Low producing cows are more likely to be culled than high producing cows, an indication of the influence of voluntary culling for low production. Low producing animals (level 1) have 16.5 times more possibilities to be culled at any given time than animals that have higher production levels (level 7 and 8). Similar results were found in other studies (Vukasinovic et al., 1999; Pasman and Reinhardt, 1999; Terawaki et al., 2006; Weigel et al., 2003). High risks in low production levels have been associated to voluntary culling for milk yield or to health problems, which in turn lower production (Chirinos et al., 2007, Vukasinovic et al., 2001). Animals with extremely high milk production (level 10) have a slightly higher culling risk than those with moderate production (6, 7 and 8). This increase in relative risk was explained previously in this population by Ruiz et al. (1994) and in other populations by Ducrocq et al. (1988) and Weigel et al. (2003) who indicated that cows with high production commonly are under stress, particularly in large herds.
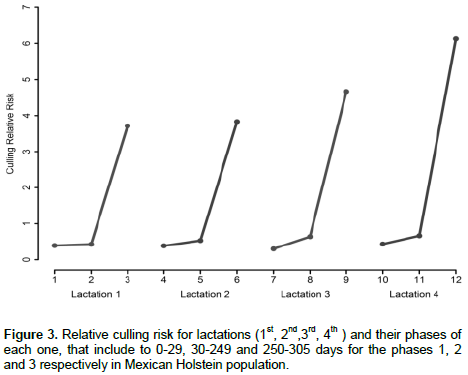
Lactation phase (LP)
Figure 3 shows the effect of relative risk in each lactation phase (including 1st, 2nd, 3rd and 4th lactations). Relative culling rates increased from the beginning to the end of each lactation. This trend is in accordance with results presented by Dürr, et al. (1999); Vukasinovic et al. (1999) and Roxtrom et al. (2003) who explained the changes in relative risks as a result of selection pressure changes during the lactation or more intensive culling of non-pregnant cows near the dry period, because cows are culled when they are not pregnant and milk production is finished (Dürr et al., 1999; Vukasinovic et al., 1999 and Terawaki et al., 2006). The relative culling risks across lactations also increased with the cow´s age as reported in other studies in the Mexican dairy cattle Holstein population (Abadía et al., 2016) and in other populations (Dürr et al., 1999; Ducrocq, 1999; Terawaki et al., 2006; Chirinos et al., 2007).
Conformation traits (CT)
Five CT were statistically significant as predictors of LPL. One of them is from the capacity and structure system (CW) and the others from the mammary system (TL, MSL, TE and UD). These findings agree with the results of Dadpasand et al. (2008), which concluded that mammary system traits have a strong relationship with functional longevity. The relative culling risks within scores of CW, TL, MSL, TE and UD traits are presented in Table 2. CW low scores show a high relative risk of culling which decreased as CW scores increased (Table 2, CW). This is probably because cows with low scores, anatomically have narrow chests, which could indicate not enough space for housing vital organs, as the heart and lungs whereas high CW scores indicate a wide chest and enough thoracic capacity. Similar CW culling risk patterns were reported in the Canadian Holstein Population, although, this trait had a low contribution to the likelihood function (<5%; Sewalem et al., 2004) and other populations where other authors have reported moderate correlation between CW and LPL (-0.24) in dairy cattle (Zavadilová et al., 2009). TL presented the lowest culling relative risk in intermediate classes (4, 5 and 6) (Table 2, TL), probably because it is difficult to attach milking units on short teats (scores 1 to 3) and the vacuum will not be optimal, whereas long teats (score 7 to 9) could be in contact with the feet and legs and might catch an infection. Similarly to CW, TL has been reported to have a low contribution to the likelihood function (Sewalem et al., 2004; Morek-Kopeć and Zarnecki, 2012) and its genetic correlation with LPL was still lower (-0.16) than CW (Zavadilová et al., 2009). MSL low scores (≤ 4) did not present a clear relative risk of culling trend, but for the upper five classes (5 to 9) it was observed that animals with high scores, have lower risks to be culled (Table 2, MSL) because animals with strong MSL present better supported udders. In other populations, MLS has been reported with medium contributions (~17%) to the likelihood function (Sewalem et al., 2004). TE is a qualitative CT highly associated to longevity in Holstein cattle (Sewalem et al., 2004). In the present study, TE showed that animals with the highest score have lower culling risks than animals with low scores (Table 2, TE). UD is a CT strongly related with true and functional longevity in many populations (Caraviello et al., 2004; Morek-Kopeć and Zarnecki, 2012; Sewalem et al., 2004; Zavadilová et al., 2009). As it was found in Canadian and German Holsteins UD presented a medium optimum in the Mexican Holstein cattle which suggests that cows with the udder floor slightly above the hock have less risk to be culled than cows with udder floors below or above the hock (Sewalem et al., 2004) (Büenger et al., 2001),. These results agree with those reported in Polish Holstein cattle (Morek-Kopeć and Zarnecki, 2012) for true longevity.
Heritability
As mentioned earlier, this parameter was calculated in different ways. LPL heritabilities calculated with model A were 0.06, 0.10 and 0.09 for logarithmic, original and effective scales respectively while for model B the values were 0.08, 0.12 and 0.14, respectively. Previous studies used model A for predicting longevity in the Mexican Holstein population using more life time records (36,507) because animals included in that study were not limited by the presence of conformation traits but only for milk yield. The estimated logarithmic, original and effective scale heritabilities were higher than the ones presented with a similar model (0.08, 0.13 and 0.12, respectively (Abadía et al., 2016). However, results of the current study are in the range of values reported for LPL in other populations (from 0.02 to 0.11 for logarithmic scale from 0.04 to 0.22 for original scale and from 0.03 to 0.19 for equivalent scale (Ducrocq, 1999; Vucasinovic et al., 2001; M’hamdi et al., 2010; Wiebelitz et al., 2014). When the statistically significant CT were included in the model (Model B) for LPL, heritability estimation improved for all scales and the heritability in the effective scale was higher compared to values obtained by Abadía et al. (2016). The heritability values obtained in the current study were also higher values than values obtained in Australian Brown Swiss and Simmental cattle (Sölkner et al., 1999).
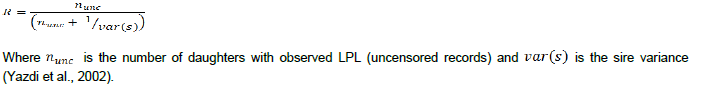
Estimated breeding values and reliability
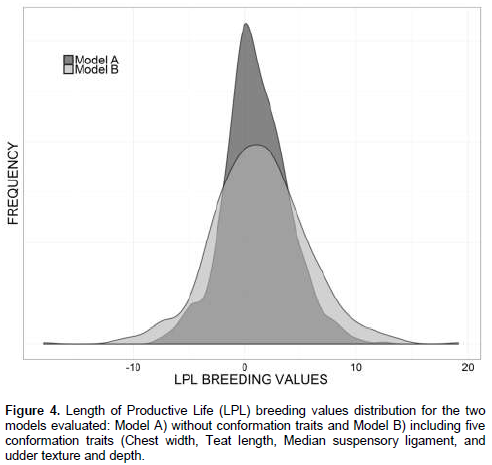
The mean and standard deviation of BV, expressed, as relative risk ratios were 1.06 ± 2.89 and 1.31 ± 4.22 for models A and B respectively. BV distributions for both models are showed in Figure 4. Results suggest that model B, which includes CT has a better fit for LPL, because the included CT increased the proportion of the explained genetic variance and the somewhat larger BV range allows to select the better animals to improve LPL. Additionally, Model B increased the average reliability by 14 percentage points, compared to model A, because reliability depends on the estimated sire variance (Yazdi et al., 2002) which was 0.03 and 0.04 for models A and B, respectively. Results of this study agree with the findings of Vukasinovic et al. (2002), which concluded that the use of CT improves reliability of longevity.
Survival analysis is adequate to calculate length of productive life, to estimate heritability and to predict breeding values in the Mexican Holstein cattle registered population.
The time dependent variables included in the analysis were good predictors for length of productive life, and five conformation traits were statistically significant in order to improve the length of productive life model. One conformation trait (chest width) was from the structure and capacity system, and the others were related with udder composition (teat length, median suspensory ligament, udder texture and udder depth). The inclusion of these five conformation traits improves the estimation of length of productive life, the prediction of breeding values and its reliability. The only challenge of using conformation traits in the longevity prediction for the Mexican Holstein population is that this information (conformation traits) must be available for all animals included in the analysis, which limits, especially, the number of uncensored data. Nevertheless, the reliability gain and the improvement of breeding value estimation justify the inclusion of the conformation traits. Therefore, inclusion of conformation traits in the length of productive life model of the Mexican Holstein cattle is recommended.
The authors have not declared any conflict of interest.
This study was supported by project SIGI No 12125933076 “Desarrollo y Validación de Evaluaciones Genómicas para Características de Conformación en Ganado Holstein de México”.
LPL, Length of productive life; HW, height to the withers; ST, stature; SI, size; CW, chest width; BD, body depth; LO, loin strength; RA, rump angle; RW, rump width; FA, foot angle; UN, claw uniformity; DH, heel depth; BQ, bone quality; RSV, rear leg side view; RLW, rear leg rear view; FUA, fore udder attachment; FTP, front teat placement; TL, teat length; MSL, median suspensory ligament; TE, udder texture; RUH, rear udder height; RUW, rear udder width; RTP, rear teat placement; UD, udder depth; DF, dairy form.
REFERENCES
|
Abadía RJ, Ruiz-López FJ, Vega MV, Montaldo HH (2016). Análisis Genético Para Vida Productiva en Ganado Holstein de México. Rev. Mex. Cienc. Pecu. 7(1):1-14.
|
|
|
|
Boettcher P, Jairath L, Koots K, Dekkers J (1997). Effects of Interaction Between Type and Milk Production on Survival Traits of Canadian Holsteins. J. Dairy Sci. 80(11):2984-2995.
Crossref
|
|
|
|
|
Büenger A, Ducrocq V, Swalve H (2001). Analysis of survival in dairy cows with supplementary data on type scores and housing systems from a region on northwest Germany. J. Dairy Sci. 84(6):1531-1541.
Crossref
|
|
|
|
|
Caraviello DZ, Weigel KA, Gianola D (2004). Analysis of the relationship between type traits and functional survival in US Holstein cattle using a weibull proportional hazards model. J. Dairy Sci. 87(8):2677-2686.
Crossref
|
|
|
|
|
Chirinos Z, Caraba-o MJ, Hernadez D (2007). Genetic evaluation of length of productive life in the Spanish Holstein-Friesian population. Model validation and genetic parameters estimation. Livest. Sci. 106(2):120-131.
Crossref
|
|
|
|
|
Dadpasand M, Miraei-Ashtiani R, Moradi Shahrebabak M, Vaez Torshizi R (2008). Impact of conformation traits on functional longevity of Holstein cattle of Iran assessed by a Weibull proportional hazards model. Livest. Sci. 118(3):204-211.
Crossref
|
|
|
|
|
Ducrocq VP (2005). An improved model for the French genetic evaluation of dairy bulls on length of productive life of their daughters. Anim. Sci. 80:249-256.
Crossref
|
|
|
|
|
Ducrocq V (1999). Two years of experience with the French genetic evaluation of dairy bull on production - adjusted longevity of their daughter. Proceedings of an International Workshop on EU Concerted Action for Genetic Improvement of Functional Traits in Cattle (GIFT): Longevity. Jouyen- Josas, Francia. INTERBULL Bull. 21:60-68.
|
|
|
|
|
Ducrocq V (1994). Statistical analysis of length of productive life for dairy cows of the Normande breed. J. Dairy Sci. 77(3):855-866.
Crossref
|
|
|
|
|
Ducrocq V, Casella G (1996). A Bayesian analysis of mixed survival models. Genetics Selection Evolution, BioMed Central. 28(6):505-529.
|
|
|
|
|
Ducrocq V, Sölkner J (1998). Implementation of a routine breeding value evaluation for longevity of dairy cows using survival analysis techniques. In Proc. 6th World Congr. Genet. Appl. Livest. Prod., Armidale, Australia. 23:359-362.
|
|
|
|
|
Ducrocq V, Solkner J (1998b). The Survival Kit: A Fortran Package for the Analysis of Survival Data. Proc. 6th World Congr. Genet. Appl. Livest. Prod., Armidale, Australia 22:51-52.
|
|
|
|
|
Ducrocq V, Quaas RL, Pollak EJ, Casella G (1988). Length of productive life of dairy cows. 1. Justification of a Weibull model. J. Dairy Sci. 71(11):3061-3070.
Crossref
|
|
|
|
|
Dürr JW, Monardes HG, Cue RI (1999). Genetic analysis of herd life in Quebec Holsteins using Weibull models. J. Dairy Sci. 82(11):2503–2513.
Crossref
|
|
|
|
|
Kleinbaum GD (1996). Statistics in tha Healt Sciences "Survival Analysis". Ed. Springer. 1st edition. pp 4-16. DOI: 10.1007/978-1-4757-2555-1
Crossref
|
|
|
|
|
Larroque H, Ducrocq V (2001). Relationship between type and longevity in the Holstein breed. Genet. Sel. Evol. 33(1):39-59.
Crossref
|
|
|
|
|
M'hamdi N, Aloulou R, Brar SK, Bouallegue M, Ben HM (2010). Study on functional longevity of Tunisian Holstein dairy cattle using a Weibull proportional hazards model. Livest. Sci. 132(1-2): 173-176.
Crossref
|
|
|
|
|
Mészáros G, Wolf J, KadleÄík O (2008). Factors affecting the functional length of productive life in Slovak Pinzgau cows. Czech J. Anim. Sci. 53(3):91-97.
|
|
|
|
|
Morek-Kopeć M, Zarnecki A (2012). Relationship between conformation traits and longevity in Polish Holstein Friesian cattle. Livest. Sci. 149(1-2):53-61.
Crossref
|
|
|
|
|
Pasman E, Reinhardt F (1999). Genetic Evaluation for Length of Productive Life of Holstein Cattle in Germany. INTERBULL Bull. 21:55-59.
|
|
|
|
|
Roxström A, Ducrocq V, Strandberg E (2003). Survival analysis of longevity in dairy cattle on a lactation basis. Genet. Sel. Evol. 35(2):305-318.
Crossref
|
|
|
|
|
Schneider M, Strandberg V, Ducrocq V, Roth A (2005). Survival Analysis Applied to Genetic Evaluation for Female Fertility in Dairy Cattle. J. Dairy Sci. 88(6):2253-2259.
Crossref
|
|
|
|
|
Sewalem A, Kistemaker GJ, Miglior F, Van Doormal BJ (2004). Analysis of the Relationship Between Type Traits and Functional Survival in Canadian Holsteins Using a Weibull Proportional Hazards Model. J. Dairy Sci. 87(11): 3938-3946.
Crossref
|
|
|
|
|
Sölkner J, William A, Gierzinger E, Egger-Danner C (1999). Effects of including conformation in total merit indices of cattle. INTERBULL Bull. (23):143.
|
|
|
|
|
Terawaki Y, Katsumi T, Ducrocq V (2006). Development of a Survival Model with Piecewise Weibull Baselines for the Analysis of Length of Productive Life of Holstein Cows in Japan. J. Dairy Sci. 89(10):4058-4065.
Crossref
|
|
|
|
|
Valencia MP, Ruiz LF, Montaldo VH (2004). Estimación de Parámetros genéticos para Características de Longevidad y producción de Leche en Ganado Holstein de México. Intercienc. 29(1):52-56.
|
|
|
|
|
Van Raden PM, Wiggans GR (1995). Productive Life Evaluations: Calculation, accuracy and economic value. J. Dairy Sci. 78(3):631-638.
Crossref
|
|
|
|
|
Vollema AR, Van Der Beek S, Harbers A, De Jong G (2000). Genetic evaluation for longevity of Dutch dairy bulls. J. Dairy Sci. 83(11):2629-2639.
Crossref
|
|
|
|
|
Vukasinovic N, Moll J, Casanova L (2001). Implementation of a routine genetic evaluation for longevity based on survival analysis techniques in dairy cattle populations in Switzerland. J. Dairy Sci. 84(9):2073-2080.
Crossref
|
|
|
|
|
Vukasinovic N, Moll J, Künzi N (1999). Genetic Evaluation for Length of Productive Life with Censored Record. J. Dairy Sci. 82(10):2178-2185.
Crossref
|
|
|
|
|
Vukasinovic N. Schleppi Y, Kunzi N (2002). Using Conformation Traits to Improve Reliability of Genetic Evaluation for Herd Life Based on survival Analysis. J. Dairy Sci. 85(6):1556-1562.
Crossref
|
|
|
|
|
Weigel K, Palmer R, Caraviello D (2003). Investigation of Factors Affecting Voluntary and Involuntary Culling in Expanding Dairy Herds in Wisconsin using Survival Analysis. J. Dairy Sci. 86(4):1482-1486.
Crossref
|
|
|
|
|
Wiebelitz J, Reinhardt F, Liu Z, Erbe M, Simianer H (2014). Genetic evaluation of survival traits in Germany Holstein dairy cattle using a six trait linear model. Proc. 10th World Congr. Genet. Appl. Livest. Prod. Canada.
|
|
|
|
|
World Holstein-Friesian Federation (WHFF) (2005). Evaluación morfológica internacional del vacuno de leche.
|
|
|
|
|
Yazdi MH, Visscher PM, Ducrocq V, Thompson R (2002). Heritability, reliability of genetic evaluations and response to selection in proportional hazard models. J. Dairy Sci. 85(6):1563-1577.
Crossref
|
|
|
|
|
Zavadilová L, NÄ›mcová E, Štípková M, Bouška J (2009). Relationships between longevity and conformation traits in Czech Fleckvieh cows. Czech J. Anim. Sci. 54(9):387-394.
|
|