Full Length Research Paper
ABSTRACT
INTRODUCTION
Livestock systems in developing countries are changing rapidly in response to a variety of drivers (Thornton et al., 2009); population growth and the gradual emergence of peri-urban centres are creating potential market opportunities for livestock producers (Markakis, 2004), in many developing countries. However, the dire effects of climate change have plagued the livelihoods of rural communities in East Africa for generations (Berhe et al., 2017). The four main agricultural communities including pastorals, semi-pastorals, agro-pastorals and mixed-farming are increasingly threatened by drought and climate factors. The impact of climate change on food security and poverty depends on multiple interacting drivers especially the timing of extreme events which are expected to become more frequent (IPCC, 2007). Climate change manifests itself through increasing variation in the weather, including temperature, precipitation, and wind (Ali and Erenstein, 2017).
The variability and change in these factors also affect the availability of water and feed for livestock; thereby, affecting livestock reproductive cycles and reducing the quantity of milk and meat produced by livestock and by increasing their vulnerability to disease. The growing period length varies with rainfall patterns and reduced, resulting in negative impacts on food production and income levels. Extreme temperature events are rare in the highlands but tend to be more frequent in the lowlands and severely affect crop and livestock production. The other extreme event is high rainfall that increases the incidence of flooding. Flooding damages crops and may even result in livestock losses. The global impact of El Niño event is apparent on drought, whereas some areas like the Horn of Africa show a significant effect on rainfall like large-scale floods (WFP, 2015).
Drought may be the most devastating (Edwards, 1997), yet wet stress, floods and landslides are important events that undermine the food security of a large number of people in Ethiopia. Mitigating these impacts requires understanding how current drought impacts measure up with the impacts of other droughts in terms of intensity, areal coverage and duration. Currently, a number of studies have employed climatic factor as an explicit event indicator to measure the severity of a wet or dry period.
The standardized precipitation index (SPI) is normalized so that wetter and drier climate is represented in a similar way (Mckee et al., 1993). Rainfall is the primary drivers of meteorological drought (Naresh et al., 2009). The value of SPI is expressed in standard deviations in which positive value indicates higher median precipitation and negative value vice-versa (Edwards, 1997). In the arid and semi-arid areas of northern Kenya and southern Ethiopia, some measures such as index-based insurance are taken as a mitigation strategy against the risk of drought-related livestock mortality (Njeri, 2016).
This paper aimed to evaluate the impact of climate change on livestock in relation to biomass base dry matter production discretely subdividing in different agro-ecological zones into land use land cover class using climatic factors and vegetation greenness in both a component and comparative analysis in southwestern Ethiopia.
MATERIALS AND METHODS
Description of the study area
Fourteen administrative zones constitute the South Nations Nationalities Peoples’ (SNNP) regional state. The study was conducted in two of the zones, namely Gamo Gofa and Dawuro zones. The total area of the zones is about 16 530.49 km2. The two zones lie between 5° 34′ 16.31′′ N and 7°20′ 58.01′′ N of latitude and 36° 22′ 13.04′′ E and 37° 51′ 26.31′′ E of longitude (Amejo et al., 2018). The zones are divided broadly into dry upper highland, wet highland, wet humid, wet sub-humid, wet upper lowland, wet lower lowland and wet and dry lowland agro-ecological zones (AEZs). The selected subregions in the zones belonged to wet highland, wet sub-humid, wet upper lowland, wet and dry lowland AEZ. The altitude in the zones varies from about 500 m.a.s.l (meter above sea level) in lower Omo valley basin to about 3600 m.a.s.l on the highland mountain in Dita. The terrain surface coverage in the zones remarkably reflects silvopasture agricultural system despite complex heterogeneous mixtures of the crop-livestock systems.
Agricultural production system
The dominant agricultural production system in the study area is smallholder mixed crop-livestock systems. In this system, the livelihood activities of the farm population are interdependently tuned to the natural environment, land use the land cover, off-farm activities, though crop and livestock productions are a significantly vital source of food, income, fiber, medicine, production power and has various social and cultural roles. The bushes and woody trees such as acacia in lower altitudes and trees such as bamboo at higher locations are abundant. These resources can promote basic livelihoods and generate incentives for farmers through investment alternatives. The reallocation of rangeland biomass conditions can accelerate quite development opportunities.
Sampling and data collection procedure
Sampling procedure
The two study zones in the SNNP region were selected purposively based on the diversity of the farming systems and AEZs. In each zone, the districts were stratified into three AEZs as highland, midland and lowland based on area proportion in the location. In each AEZ, the districts were randomly selected, followed by the Peasant administrations (PAs), designated for their production potential in discussion with local authorities. Later using the baseline information data tracked by geographical position systems, four distinct AEZs (the wet highland, wet upper lowland to the sub-humid, and wet and dry lowland) were identified which differ significantly. There were 13 PAs, in the two zones selected for the study. In the Gamo Gofa administrative zone, there was a total of seven PAs; one at wet highland (Losha), two at wet upper lowland to sub-humid (Fishto and Grss Zala) and four at dry lowland (Alga, Ancover, Furra and Para Gossa). In Dawuro, six Pas, one at wet highland (Gmra Qema), two at wet upper lowland to sub-humid (Guzza and Myla) and three at wet lowland (Qcheme Kessi, Tarcha Zuri, and Yallo Worbati) were selected. The households were selected randomly.
Data collection procedure
Data were collected using structured questionnaire, which was prepared and used to collect data from the sampled household. The enumerators were under the close supervision of researcher andr esearch assistants. The data collection included demographic characteristics, household socioeconomic factors, land holdings, the livestock species kept, herd structure of cattle, sheep, goats, and equine, and production and reproduction performance of the livestock. The crops type grown, land use, land cover area by crop and seasons of growing, feed type and grazing pattern, were together gathered. Livestock feed supply from crop production, pastureland and communal grazing was determined. The data collection took place between February and December, 2016.
The land use land cover of the private ownership was gathered together with geographical information at the household level. Rangeland biomass in the respective site was the proportion of average farm holdings, population, and total area coverage was classified according to interview data, field experience, and other literature for the study zones. The feed availability from food production, pastureland and rangeland biomass was quantified in relation to maintenance and productivity performance of female breeding animal and livestock herd population in each farming system according to the interview result. Biomass productivity potential was determined using soil, slope, land use type and livestock utilizable factors.
Rainfall and normalized difference vegetation index (NDVI) data
The rainfall and NDVI data used in this study are processed data obtained from livelihood early assessment and protection (LEAP) software version 2.7 for Ethiopia (Hoefsloot and Calmanti, 2012) which is available in pixel based on each district of the zones. There were decadal values of actual rainfall (RF1, RF2, and ARC2), available over some years. In a series of actual rainfall available from 1983-1994 (ARC2), 1995-2000 (RF1) and 2000-2016 (RF2), a total of 34 years were processed. The actual NDVI value of MODIS (FAO) from 2008-2016 and USGS from 1983-2007 were processed together.
Standardized precipitation index
The SPI was derived from the actual rainfall record in the districts within the sample PAs. A long-term data for 34 years (1983-2016) was used to quantify the SPI. McKee et al. (1993) described the standard procedure that was used first to fit the rainfall data into a probability distribution function. The series of three decadal (10 days) average rainfall aggregated to each month of the year was used in the present study. Before computing the SPI, the rainfall value was adjusted to mean 0 standard deviations 1.0 and skewness of the given precipitation was readjusted to zero as shown in Equations 1 to 3:
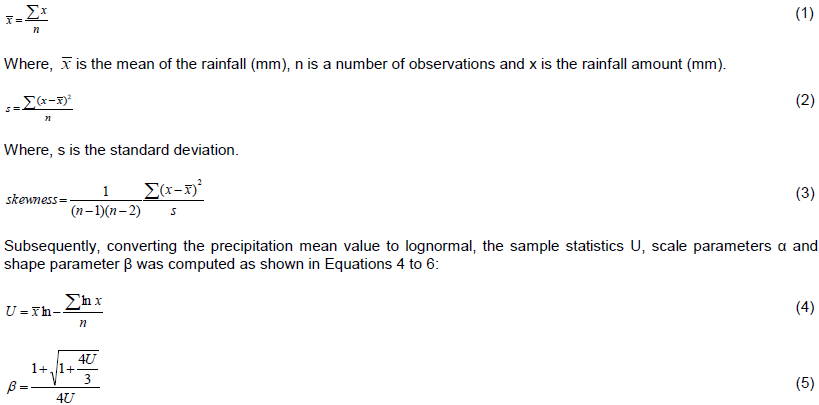
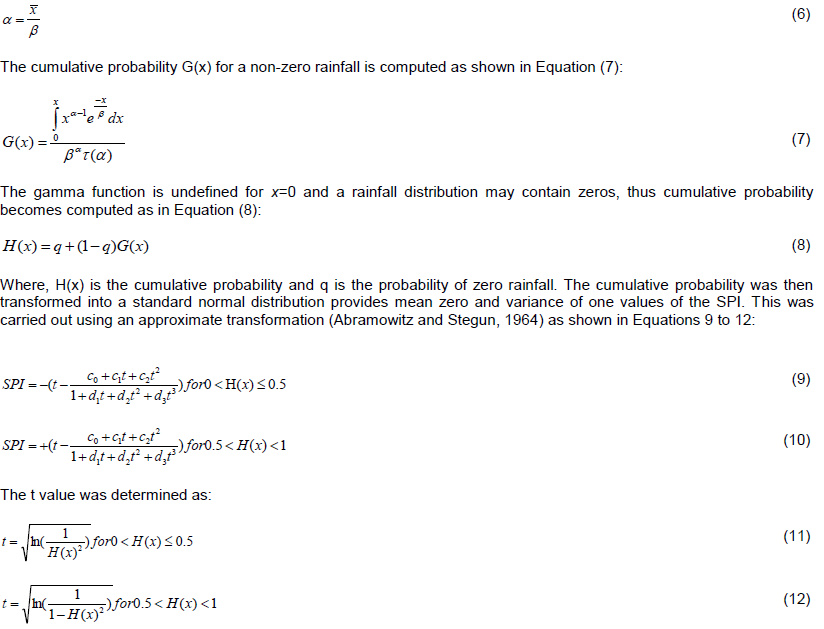
Where, c0 = 2.515517, c1 = 0.802583, c2 = 0.010328, d1 = 1.432788, d2 = 0.189269 and d3 = 0.001308.
Equations 1 to 12 were computed in Excel using method given by Naresh et al. (2009) and Wambua et al. (2015). The monthly SPI value was computed in Excel, whereas standardization and further analyze was carried out using the statistical software as described by Edwards (1997). The SPI extreme event classes were defined as SPI ≥ 2.0 extremely wet, 1.5 < SPI ≤ 2.0 severely wet, 1.0 < SPI ≤ 1.5 moderately wet, -1.0 < SPI ≤ 1.0 almost normal, -1.5 < SPI ≤- 1.0 moderately dry, -2.0 < SPI ≤ -1.5 severely dry and SPI ≤ -2.0 extremely dry (McKee et al., 1993).
Biomass base feed production index
Livestock feed shortage risk related to climate change was assessed using the biomass base DM production derived from LULC class in the study area. The DM was derived from NDVI by determining goodness-of-fit independently in each selected site for consequent 34 years as equation given by Quiroz et al. (1999). The component analysis involved NDVI, and normal rainfall as the sensitivity factors, and SPI as an extreme event. The availability index (Deressa et al., 2008) measures the risk of livestock feed shortage in biomass base during drought occurrence as shown in Equation 13:

The index is the amount of feed availability in month i for the respective 34 years calculated as shown in Equation 14. The annual total was the sum of the respective month in a year processed in Excel which was further used in the statistical analysis.

Where, index is biomass dry matter for livestock adaptive capacity in climate event occurrences in month i; DM is dry matter consumable amount from biomass by livestock; NDVI is Normalized Difference Vegetation Index, and N Rf is normal rainfall, sensitivity factors; and SPI is Standardized Precipitation Index, extreme factor.
Statistical analysis
The one sample run test was employed to define a possible effect of the event extremity. The deviation below and above the median was used in normality test. Three tests of normality, the Shapiro-Wilk statistic, p-values and the absolute value of the median was suggested (Wu et al., 2007). The analysis was done using Statistical Package for the Social Sciences (SPSS) version 20, and the significant difference was defined (p<0.05).
RESULTS
Temporal scale of climate change extreme event
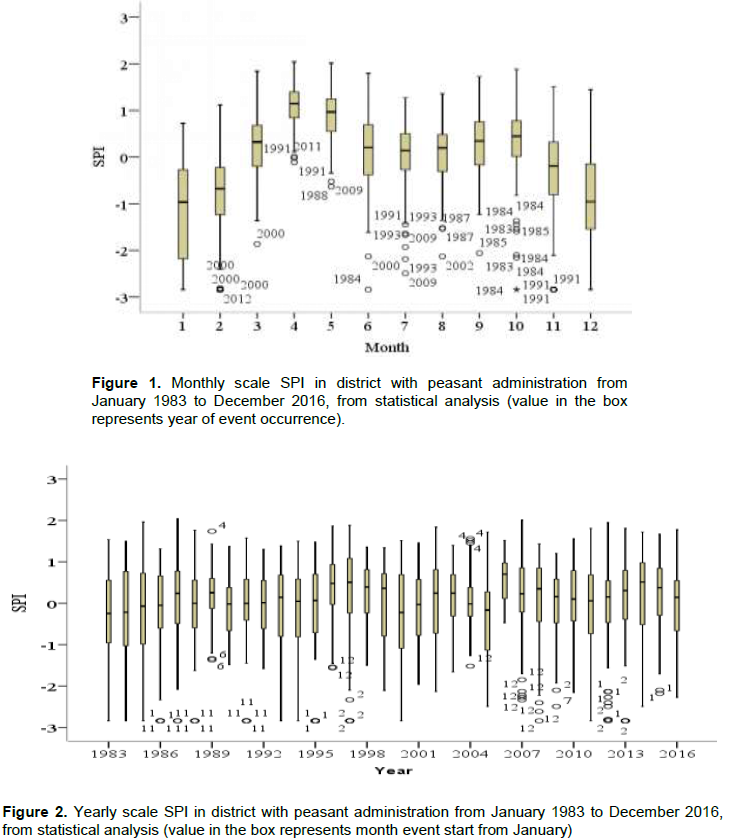
Drought event with extended duration in 1988, 1991, 2000, 2009 and 2011/12 took place during the main rainy season (Figure 1). Although, the repeated occurrences were observed in the dry season. The drought of 1984/85, 1986/87, 1993, 2000 and 2002 lasted longer in the dry season with a short duration in a rainy month (Figure 1).
The drought incidence was mainly frequent in January, February, June, July, November and December (Figure 2). This also varied over the years in appearance. For example, before 1992, it commenced in June and November, whereas in later years, it was common in the above indicated months. The wetter event incidence was observed in April (in wet dry season) in 1989 and 2004 in different districts (Figure 2).
According to the study result, during 34 years period, the extreme event incidence appeared in 19 different years (Figure 3). The drought was main rife in the districts of Chencha, Mirab Abaya and Bonke of Gamo Gofa zone where in Loma, Mareka, Issera and Tocha districts of Dawuro zone, both wet and drought incidences were frequent (Figure 3). The drought observed in the districts in the year 1987, 1988, 1991, 1993, 1994, 1995, 2011, 2012 and 2013 was found in extreme dry class with SPI ≤ -3.0 (Figure 3). Severely wet event with SPI ≥ 1.7 in Tocha in 1989, and similarly in 2004, in all districts of Dawuro zone within sample Pas, were ascertained (Figure 3).
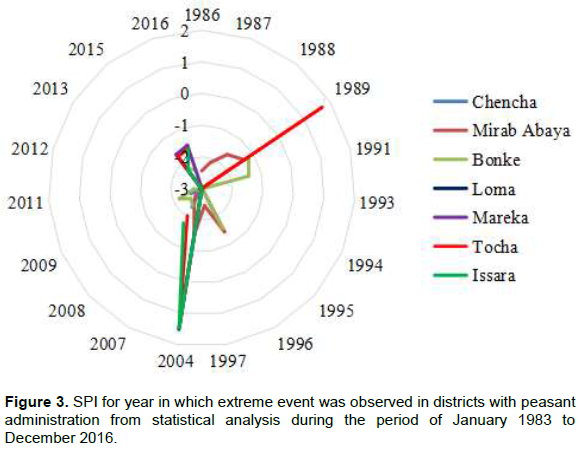
During the progress of this study fieldwork, one of the study areas, Mirab Abaya, was visited by American Ambassador because of severe incidence of the very recent (2014/15) drought. However, the statistical analysis claimed that the extreme drought incidence (SPI ≤ -2.2) in that year was in Issara and Bonke districts which continued with SPI ≤ -2.4 in the latter year in 2016 in the same districts (Figure 3).
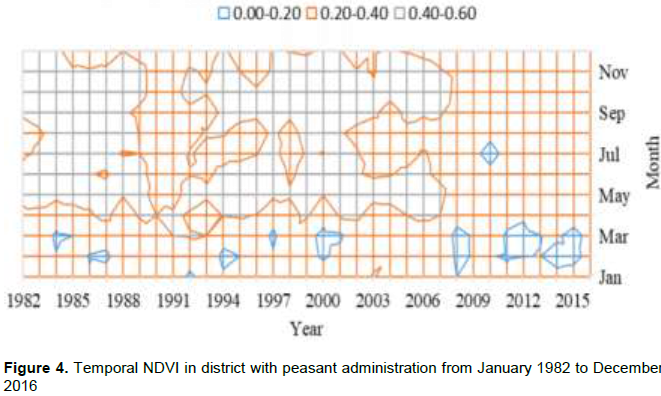
The magnitude, duration and occurrence of droughts varied highly and rapidly increased over time (Figure 4). The circumstances most probably dented environment responding capability and a spatial variability intra-seasonally. The extreme events in 2007/08 and 2009/10 appeared in February, July and December but very recent drought in 2012/13 and 2014/15 were in January and February (Figure 4).
Livestock feed production risk
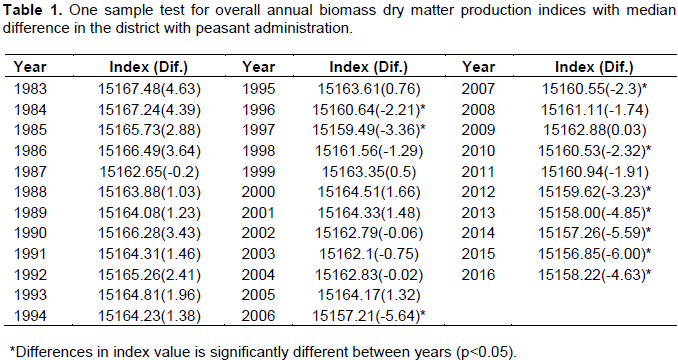
Livestock feed shortage risk explained the highest significant deviation in 2015 (-6.00) than the median (15,162.85), similar consequences occurred for ten different years (Table 1). The overall test effect was significantly different (Z=-2.61, p=0.01) between the years.
DISCUSSION
Temporal scale of climate change extreme event
Earlier studies in Ethiopia indicated that the infamous drought of the 1984/85 has significantly affected belg season (March, April and May) than the main rainy season (June, July, August), but the 1991 drought has targeted the main rain season while in 1994, there was a significant fluctuation between dry and wet extremes in southeastern Ethiopia (Awass, 2009). A more detailed view from two rainfall datasets analysis of the USGS, the central trends precipitation (1960-2014) by Florida State University, and Climate Hazards Group Infrared Precipitation with Station data, 1981-2015 indicated that the total rainfall deviation was averaged 480 mm across central/eastern Ethiopia between March and September 2015. Its outcome resulted in the worst drought in 50 years in Ethiopia (http://fews.net/Ethiopia; http://wfp.org).
The soil moisture is a closer proxy indicator of crop conditions than rainfall. The Land Data Assimilation System model run by NASA indicated the soil across most parts of Ethiopia, the driest in at least 30 years during the main cropping/rangeland regeneration period in 2015 (https://fews.net/Ethiopia)). Similarly, the highest negative deviation in the biomass base feed dry matter production was observed in the year 2015, followed by 2006 and 2014, in the present study.
Livestock feed production risk
Drought occurs in virtually all climate zones, is attributed to deficiency in precipitation over extended periods of time such as a season or year which results in water shortage, causing adverse impacts on vegetation, livestock and human beings (Mishara and Singh, 2010). Currently, the economic costs involved (Hewitt, 1997; Belal et al., 2014), countries and organizations are increasingly pursuing strategies aimed at mitigating the negative impacts of drought.
Njeni et al. (2016) found a positive correlation with a higher percentage and strong coefficients (r>0.75) in the inter-annual relationship between indices in seasonal forage scarcity and drought in the short rains seasons than the long one. The significant difference revealed for extreme event in the current study coincided with other several findings, which is described in this paper in a different section. A similar change was also reflected in the temporal scale comparisons between the study parameters of SPI and NDVI independently, as well as in the component analysis in the combination.
In another study, more than 94% of pastoral, semi-pastoral, agropastoral and mixed-farming communities perceived that lack of animal feed was their critical challenge during drought periods (Berhe et al., 2017). Drought severely harms the ecosystem and worsens human crises (Masih et al., 2014).
On the other hand, Tsegaye et al. (2013) described crop failure that directly causes scarcity of animal feed to be also associated with lack of rain and drying of water sources. As a result, semi-pastoral (86.5%), agro-pastoral (95.1%) and mixed-farming (83.3%) communities perceived that climate change, manifesting as drought, significantly destroyed crops that described by the households, they experienced crop failure twice or more times within five years (Berhe et al., 2017). Similarly, SPI analysis from 34 years long-term rainfall data, in 19 different years extreme events were obtained in the current study area. Moreover, the drought event of 2014-2016 was the most heightened in history and had substantial focus on the international diplomats in Ethiopia. Such a striking shock observed was high in Mirab Abaya district with the complete failure of field crops, particularly maize before maturity and harvested for livestock. This was even extremely highest in Bonke and Issara districts in 2015 and 2016 as compared to Mirab Abaya which is evident in this statistical analysis.
Currently, focus has been given to drought; however, in the current study, both extreme drought and wet event was observed in all smallholder rural production systems. The result is also in support of respondent farmers claim as well as the field observation that households in the wet event reflected areas were less anticipation for belg season cropping activities is common for other PAs which is usual throughout the country in bi-modal rainfall receiving regions.
Moreover, the land area change computed in relation to the total population, the land area, and average holdings per sampled household indicated a negative balance in the magnitude of change in the wet highland PAs. This is probably associated with the extreme event (such as landslide, flood, etc.), and will be another aggression in peasant holdings and potential production, so it should be taken into consideration. The climatic extreme event seems like removing alternative means of farming practice although a combination of agricultural production performance for improved land productivity as well as livestock production in both wet stress and drought-prone area largely capitalize on household income and production input, supply, resilience and response of capability to most common supply-side difficulties.
CONCLUSIONS
According to the result of the study, during the years of drought occurrences, the biomass DM production intrusively declined, and significant difference appeared later in 1990’s in the current study area. The continuous dry condition could be seen in 2007 which continued as the recent severe drought. The negative impact of climate change on biomass dry matter production is increasing much more rapidly, which might shift to the southwestern part of the country over time. The responding capability of rangeland/vegetation condition is weak and completely dry, manifesting even longer after the drought in southwestern Ethiopia was reported. Wet and dry events typical in the region can adversely affect both human and livestock production in such a less reachable area. Thus, future of livestock production in terms of feed supply could not be standard during the drought occurrence period. The risk which increasingly manifest, needs devising adaptive and mitigation mechanism in the area, taking into account, the increasing trend in the progress of extreme events.
CONFLICT OF INTERESTS
The authors have not declared any conflict of interests.
ACKNOWLEDGEMENTS
This work was supported through skills and knowledge transfer from the German Academic Exchange Service (DAAD) and fund by the Federal Ministry for Economic Cooperation and Development (BMZ) of Germany, provided by Food Security Center (FSC) of Hohenheim University. The authors also thank Arba Minch University, Ethiopia for partial financial support of this work.
REFERENCES
|
Abramowitz M, Stegun I.A (1964). Handbook of mathematical functions: with formulas, graphs, and mathematical tables (Vol. 55). Courier Corporation. |
|
|
Ali A, Erenstein O (2017). Assessing farmer use of climate change adaptation practices and impacts on food security and poverty in Pakistan. Climate Risk Management 16:183-194. |
|
|
Amejo AG, Gebere YM, Dickoefer U, Kassa H, Tana T, Lawrence P (2018). Herd dynamics and productivity performance modeling of livestock in smallholder crop-livestock systems in Southwestern Ethiopia. International Journal of Veterinary medicine and Animal Husbandry 3(1):17-24. |
|
|
Awass AA (2009). Hydrological drought analysis-occurrence, severity, risks: the case of Wabi Shebele River Basin, Ethiopia. |
|
|
Belal AA, El-Ramady HR, Mohamed ES, Saleh AM (2014). Drought risk assessment using remote sensing and GIS techniques. Arabian Journal of Geosciences 7(1):35-53. |
|
|
Berhe M, Hoag D, Tesfay G, Tadesse T, Oniki S, Kagatsume M, Keske CM (2017). The effects of adaptation to climate change on income of households in rural Ethiopia. Pastoralism 7(1):12. |
|
|
Deressa T, Hassan RM, Ringler C (2008). Measuring Ethiopian farmers' vulnerability to climate change across regional states. International Food Policy Research Institute. |
|
|
Edwards DCM (1997). Characteristics of 20 th century drought in the United States at multiple time scales, Colorado State University. Climatology Report (No. 97-2). |
|
|
Hoefsloot P, Calmanti S (2012). LEAP version 2.61 for Ethiopia. hoefsloot.com |
|
|
IPCC (2007). In: M.L. Parry, O.F. Canziani, J.P. Palutikof, P.J. van der Linden, C.E. Hanson (eds.), Climate Change 2007: Impacts, Adaptation and Vulnerability: Contribution of Working Group II to the Fourth Assessment Report of the Intergovernmental Panel on Climate Change, Cambridge University Press, Cambridge, United Kingdom and New York, NY, USA. |
|
|
Markakis J (2004). Pastoralism on the Margin (pp. 14-18). London: Minority Rights Group International. |
|
|
Masih I, Maskey S, Mussa FEF, Trambauer P (2014). A review of droughts on the African continent: A geospatial and long-term perspective. Hydrology and Earth System Science, 18(9):3635-3649. |
|
|
McKee TB, Doesken NJ, Kleist J (1993). The relationship of drought frequency and duration to time scales. In Proceedings of the 8th Conference on Applied Climatology, Boston, MA: American Met. 17(22):79-183. |
|
|
Mishra AK. Singh VP (2010). A review of drought concepts. Journal of Hydrology 391(1):202-216. |
|
|
Naresh KM, Murthy CS, Sesha SMVR, Roy PS (2009). On the use of Standardized Precipitation Index (SPI) for drought intensity assessment. Meteorological Applications 16(3):381-389. |
|
|
Njeri WL (2016). Examining satellite rainfall estimates as an alternative to NDVI for livestock insurance in East Africa. |
|
|
Quiroz R, Zorogastúa P, Baigorria G, Barreda C, Valdivia R, Cruz M, Reinoso J (1999). Toward a dynamic definition of agroecological zones using modern information technology tools. CIP Program Report 2000:361-370. |
|
|
Thornton PK, van de Steeg J, Notenbaert A, Herrero M (2009). The impacts of climate change on livestock and livestock systems in developing countries: A review of what we know and what we need to know. Agricultural Systems 101:113-127. |
|
|
Tsegaye D, Vedeld P, Moe SR (2013). Pastoralists and livelihoods: A case study from northern Afar, Ethiopia. Journal of Arid Environments, 91:138-146. |
|
|
Wambua RM, Mutua BM, Raude JM (2015). Spatio-temporal Drought Characterization for the Upper Tana River Basin, Kenya Using Standardized Precipitation Index. World Journal of Environmental Engineering 3(4):111-120. |
|
|
World Food Programme (WFP) (2015). Food security emergency in central/eastern Ethiopia follows worst drought in 50 years. |
|
|
World Food Programme (WFP) (2015). El Ni-o: Implications and Scenarios for 2015/16. View. |
|
|
Wu H, Svoboda MD, Hayes MJ, Wilhite DA, Wen F (2007). Appropriate application of the standardized precipitation index in arid locations and dry seasons. International Journal of Climatology 27(1):65-79. |
|
Copyright © 2024 Author(s) retain the copyright of this article.
This article is published under the terms of the Creative Commons Attribution License 4.0


