ABSTRACT
Proper diet is important in preventing many diseases, and colorectal cancer is no exception. The aim of this study was to identify major dietary patterns among the general population in Arusha Tanzania to determine whether diet is one of the predictors contributing to the observed pattern and distribution of colorectal cancer in Tanzania. A population based cross-sectional study recruited a sample of self-reported healthy individuals residing in four wards of the City of Arusha, Tanzania. A total of 549 participants were recruited on a voluntary basis. The Food Frequency Questionnaire and the World Health Organization (WHO) Step® survey tool were used to collect data. Factor analysis, Pearson correlation (Pearson’s r), and logistic regression were used to analyze the data.Two major dietary patterns, namely “healthy” and “western”, and one minor pattern existed among the study population. The "healthy" pattern was generally associated with females (56.2%, p=0.074), people with primary level of education (62.7%, p=0.667), age category of 25 to 44 (66.3%, p= 0.370), normal range body mass index (BMI) (42.4%, p=0.967), self-employed (78.5%), non-smokers (86.6%) and non-alcohol drinkers (51%), although the differences were not statistically significant. "Western" dietary pattern adherence was associated with area of residence (p=0.0001), gender (p=0.003) and BMI status (p=0.04) in univariate analysis. In multivariate analysis, higher odds were observed in individuals aged 25 to 34 (OR=1.104, 95%, CI(0.537-2.2267) and 45 to 54 OR=1.091, 95%, CI(0.521-2.283), alcohol drinkers (OR=1.2, 95%, CI(0.767-1.877), people with college or high levels of education (OR=0. 853, 95%, CI(0.260-2.803) and OR=0.550, 95%,CI(0. 159-1.897), smokers (OR=1.030, 95%, CI(0.519-2.044) and overweight or obese (OR=2.676, 95%, CI(0.981-7.298) and OR=2.045, 95%, CI(0.767-5.454). These data support our previous hypothesis that diet could be an important potential predictor of the previously observed pattern and distribution of colorectal cancer in Tanzania.
Key words: Diet, colon cancer, rectal cancer, Tanzania, population.
Colorectal cancer (CRC) is largely attributable to unhealthy lifestyle and behavior patterns (Kirkegaard et al., 2010). Western lifestyle, characterized by being overweight or obese, physically inactive, eating certain types of food, smoking and heavy alcohol drinking have modifiable lifestyle risk factors(Johnson et al., 2013).
Specifically, diet which is modifiable, is said to account for between 30 and 50% of all CRC incidences and 70 to 90% of CRC prevention (Vargas and Thompson, 2012). The World Cancer Research Fund (WCRF) and the American Institute for Cancer Research (AICR) have classified several food components as being convincing, probable or suggestive causative factors of CRC. The evidence is convincing that foods containing dietary fiber are protective against CRC (WCRF and AICR, 2011). Evidence indicating increased CRC risk with the consumption of red and processed meat, and ethanol from alcoholic beverages is convincing for men and probable for women. Consumption of garlic, milk and calcium probably protect against this cancer (WCRF and AICR, 2011).
Diet exposures are likely to play a key role in CRC etiology (Chan and Giovannucci, 2010). Nutrient-nutrient interactions, complementary and synergistic effects of different food components, and difficulties ascribing nutritional effects to single dietary components all play a role (Johnson et al., 2013; Vargas and Thompson, 2012; Cross et al., 2010; Fedirko et al., 2011; Limsui et al., 2010). But there remains a tentativeness and even suspiciousness surrounding this etiological connection. Historically, analysis of the independent effects of specific nutrients or foods revealed several conceptual and methodological limitations yielding inconsistent or conflicting findings (Marmot et al., 2007). Furthermore, the effects of single nutrients may be too small to detect, and assessing the effect that numerous nutrients or food items may produce associations simply by chance (Kant, 2010).
So, many researchers have suggested that analyzing diet instead of isolated nutrients or food items may be more suitable, to account for exposure to a variety of foods with complex combinations of nutrients (Kant, 2010; Magalhaes et al., 2012). Dietary patterns represent food and nutrient consumption patterns which have become a focus for nutritional epidemiology as predictive of diseases risk (Miller et al., 2010).
The extant literature demonstrates that certain dietary patterns are associated with risk of colon and rectal cancer. Randi et al. (2010) conducted a systemic review of 32 articles: dietary patterns labeled healthy, prudent, fat-reduced/diet foods, healthy eating index-2005, recommended food and Mediterranean diet scores were all associated with reduced risk of CRC with risk estimates varying from 0.45 to 0.90. In contrast, diets dubbed Western, and traditional patterns were associated with increased risk of CRC with risk estimates varying from 1.18 to 11.7 (Randi et al., 2010). An American-based study identified three dietary patterns: fruit and vegetables, fat-reduced/diet foods and ‘meat and potatoes’. Findings revealed that low-frequency consumption of meats and potatoes and frequent consumption of fruit and vegetables and/or fat-reduced foods were associated with a decreased risk of colorectal cancer (Flood et al., 2008). In another study, four dietary patterns -healthy, Western, drinker and meat eaters were identified. The meat-eaters pattern was positively associated with CRC risk (RR=1.58, 95%, CI (0.98-2.53); p=0.02) (Kesse et al., 2006). A systematic review of cohort studies dating from 2000-2011implicated Western dietary pattern, mainly consisting of red and processed meat and refined grains, with an elevated risk of development of CRC. Healthy or prudent diet, which consisted of vegetables, fruits, fish and poultry, were found to be protective against CRC (Yusof et al., 2012). Beyond CRC, in Tanzania, a case-control study examined dietary pattern impacts on breast cancer risk among women in the Kilimanjaro Region. A study by Jordan et al. (2013) found an increased risk for fatty diet, characterized by a higher consumption of milk, vegetable oils and fats, butter, lard and red meat (OR = 1.42, 95% CI (1.08–1.87); p=0.01). Findings from other studies have assigned more risk to people following the western dietary pattern than many other dietary patterns.
However, dietary patterns cannot be measured directly (Hu, 2002). Three statistical approaches commonly used include: factor analysis, cluster analysis and dietary indices. In both factor and cluster analysis, dietary patterns are derived through statistical modeling of extant data (Trichopoulos and Lagiou, 2001). Conversely, in the dietary index approach, the indices are created on the basis of previous knowledge of a `healthy' diet (Chiuve et al., 2012). Hence, the current study focus on current eating behaviors based on available empirical data without a priori hypothesis, supported either factor and cluster analysis, with selection of the former in order to optimize comparison with previous study findings.
This study was conducted to identify major dietary patterns among general health population in Arusha region of Tanzania. It is an extension of a retrospective chart audit study identifying the pattern and distribution of CRC in Tanzania. It was observed that CRC incidence rates increased for both males and females. Regions of Dar es Salaam, Coast, Kilimanjaro and Arusha had more
CRC cases as compared to others. The disease was almost equally distributed between males and females, although gender likelihood of diagnosis type (rectal or colon) was significantly different. There was a 2% increase in incidences levels of colon cancer and 1.5% decrease for rectal cancer every year from 2005 to 2015. Arusha was among the top four regions with higher rates. It is hypothesized that, a number of factors may be acting either singly or in combination to influence the observed trend. Epidemiological studies suggest correlation between the incidence of CRC and several lifestyle factors (diet, alcohol intake, cigarette smoking, lack of physical activities, etc) and genetic factors (Katalambula et al., 2016). The authors decided to evaluate the status of these factors in the general population of Arusha Tanzania. Therefore, the study goal is to understand local dietary pattern as a predictor contributing to the observed pattern and distribution of CRC in Arusha Tanzania.
Study area
The study was carried in the Arusha Region, which is located in the north-eastern corner of Tanzania. It lies below the equator between latitudes 2° and 6°. Longitudinally, the region is situated between 35° and 38° east of Greenwich. The region has a common border with Kenya in the north, to the east, it borders with Kilimanjaro and Tanga Regions. To the south, it shares a border with Manyara Region and to the west with Shinyanga and Mara Regions (URT, 2016).The main economic activities of Arusha region are agriculture, tourism, mining and livestock keeping. Both commercial and peasant farming are carried out in the region. Commercial farming is for seed beans, wheat, coffee and floriculture. Maize and beans though produced by small landholders are grown widely and substantially contribute to the region's economy. Tourism contributes roughly 20% to the region's gross domestic product (GDP). Similarly, the large livestock population is estimated to make an annual contribution of about 20% to the region's GDP. Industries and mining sectors contribute roughly 5 and 2% to the regional GDP, respectively (URT, 2016).
Administratively, the region is subdivided into seven districts including Arusha City. According to the 2012 population census, the city had 416,000 individuals (URT, 2016) across 25 wards of which four (i.e., Sekei, Unga Ltd, Muriet, and Sokon I) were used for the study.
Study population
This population based cross-sectional study recruited a sample of self-reported healthy individuals residing in four wards of the City of Arusha, Tanzania.
Study design
A cross-sectional study design was conducted in which quantitative method of data collection was employed.
Inclusion and exclusion criteria
Inclusion criteria were age between 25 and 64 years, residence in selected wards within Arusha city, voluntary participation in the
study; exclusive criteria were non-residents and not consenting.
Sample size and sampling procedure
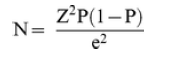
The sample size was calculated using the Kish and Lisle formula for cross-sectional studies:
Where N  =  sample size, Z  =  level of confidence, P  =  baseline level of the selected indicator and e  =  margin of error.
The values were set at P = 0.42(42%) for the purchase diet to be described later (Keding et al., 2011); Z = 1.96 (at 95% confidence interval); e  =  0.05. The sample size was adjusted for a non-response rate of 10%.
A total of 549 participants were included in this study. Participants were recruited on a voluntary basis, essentially by self-motivation after sensitization. One week before each interview, signboards were placed around the study area, neighborhoods and public places were visited to sensitize people through local leaders and selected sensitizers inviting them to attend a free (no cost) health screening assessment and consultation. The interviews occurred in public places such as dispensaries and schools. The questionnaire and other measurements were carried out by trained medical practitioners.
Ethical considerations
This study received ethical approval from the National Institute of Medical Research Ethical Committee as well as approval by Arusha Regional Commissioner and Arusha City Council. All subjects in the survey participated voluntarily and provided written informed consents.
Assessment of dietary intake
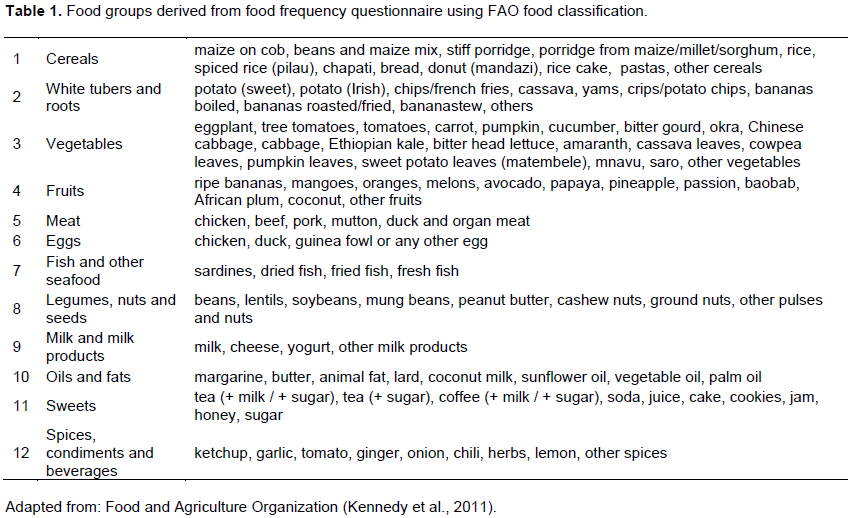
Dietary intake information was collected by the adapted standardized food frequency questionnaire (FFQ), whose reliability and validity had been tested previously (Jordan et al., 2013), to assess recalled average food intake over the previous year. The FFQ was validated in Kilimanjaro, the neighboring region to Arusha where these regions share so many things in common including diets. The FFQ included 63 commonly consumed food items. For each food item, participants indicated their average frequency of consumption over the past year by checking 1 of 5 frequency categories ranging from “never” to “daily intake.” Alcoholic beverages were excluded in the analysis, thus, 58 food items were remaining. The remaining 58 food items in the FFQ were sorted into 12 predefined food groups as previously classified by Food and Agriculture Organization (FAO) (Kennedy et al., 2011) to minimize within-person variations in intakes of individual foods (Table 1).
Measurement of other variables
The survey was conducted using the WHO recommended STEP® wise approach questionnaire (WHO, 2008). Trained field staff with medical backgrounds administered the questionnaires, which were developed from core, expanded and optional variables of the tool.
Statistical analysis
Principal component factor analysis was used to identify dietary patterns. Varimax rotation method with Kaiser Normalization to achieve a simpler structure with greater interpretability was used where the rotation converged in 5 iterations. To determine the number of factors to retain, the authors considered Eigenvalues >1, the scree plot, the proportion of variance explained by each factor, and the interpretability of the factors. Confirmation of sampling adequacy of the food group variables was confirmed using the Kaiser-Meyer-Olkin measure with the resultant value of 0.752. As per a study by Chen et al. (2015), food groups with factor loadings between -0.4 and 0.4 were disregarded for defining the dietary patterns (Chen, 2015).
Principal component factor analysis was used to identify dietary patterns. Pearson and Spearman correlation coefficients examined the correlation of factor scores for each dietary pattern with other participant characteristics. Unconditional logistic regression models were used to calculate the odds ratios (OR) and the corresponding 95% confidence intervals (CI) that were used to interpret the associations between dietary patterns and participant characteristics. All statistical analyses were performed using SPSS™ Version 21.
Demographic characteristics
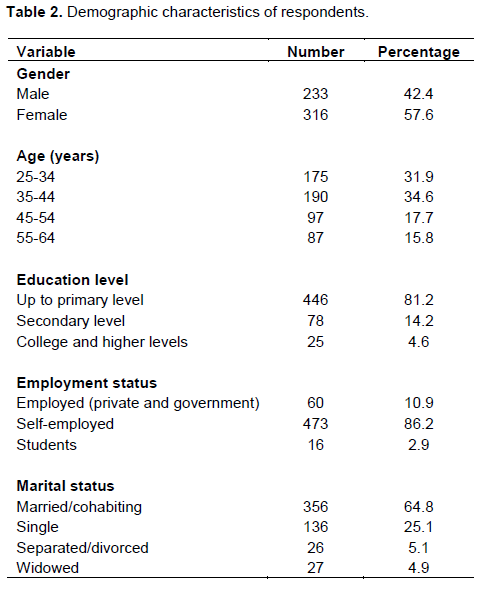
Demographic characteristics of the study population are presented in Table 2. Two hundred and thirty-three men (42.4%) and three hundred and sixteen women (57.6%), with a mean age (standard deviation) of 40.7 (12.07) years participated in this study. The majority of respondents were between 35 and 44 years (34.6%), while people between 55 and 64 years only represented 15.8% of this study population. With respect to marital status background, 356(64.8%) were married or cohabiting and 27 (4.9%) were widowed. Of the 549 participants, more than three quarters (81.2%) had less than or up to primary education level, 78 (14.2%) had secondary education, level while only 16 (2.9%) attained college or higher. Eighty-six percent were self-employed when compared with only 10% employed by either government or private organizations.
Dietary pattern analysis
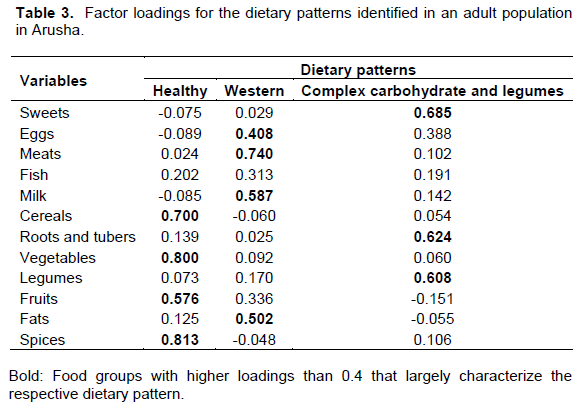
The factor analysis of the consumption of 12 predefined food groups yielded two major patterns and one minor pattern. Factor-loading matrixes for the three patterns are listed in Table 3. The larger the loading of a given food item or group, the greater the contribution of that food item or group to a specific factor. The first factor, referred to as ‘healthy’ pattern, was loaded heavily with cereals, vegetables, sweets, fruit and spices, explaining 22.9% of the variance.
The second factor, labeled as ‘Western’ pattern, was loaded heavily with meat, fish, milk and fat. The second factor explained 13.7% of the total variance. The third pattern, referred to as ‘complex carbohydrate and legume’ pattern, explained only 4.4% of the total variance, with a positive loading for alcohol, roots and
tubers and legumes.
Univariate analysis between dietary patterns and respondents characteristics
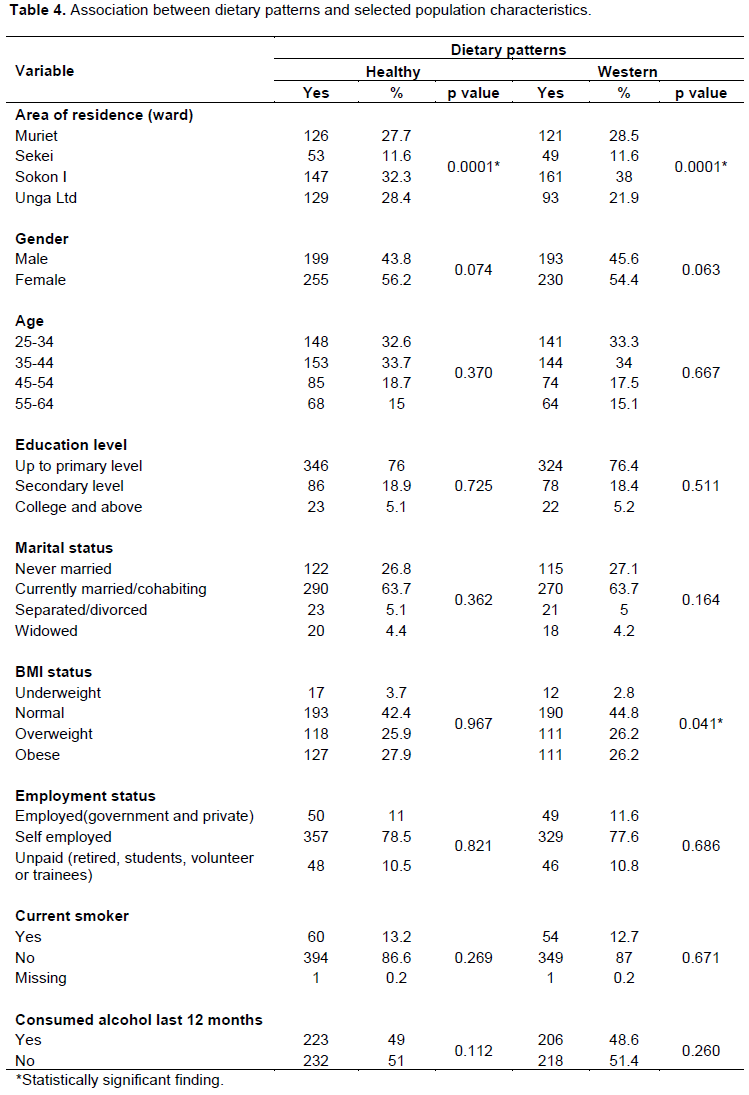
Dietary patterns by different subject characteristics are presented in Table 4. Two major dietary patterns derived by principal component analysis were significantly associated with area of residence.
The healthy pattern was characterized by more females than males (56.2%), although the difference was not statistically significant (p=0.074). The majority of subjects in this pattern completed primary level of education (62.7%, p = 0.667) and were in the age category of 25 to 44 (66.3%, p= 0.370). The majority of people with normal body weight followed the healthy dietary pattern (42.4%, p=0.967). With respect to employment status, current smoking and alcohol consumption in the 12 months prior to the survey, the majority of respondents reported as self- employed (78.5%), non-smokers (86.6%) and non-alcohol drinkers (51%). All these variables were not statistically significant (p=0.821, p=0.269, and p=0.112, respectively).
The western pattern was consumed by a higher proportion of women (54.4%), people aged 25 to 44 (67.3%), and residents of Sokon I ward (38%). Subjects in this pattern had a lower or up to primary level of education (76.4%), were currently married or cohabiting (63.7%), overweight or obese [as reflected in body mass index (BMI) calculations] (52.4%), but did not report currently smoking cigarette (87%) or consuming alcohol in 12 months prior to the survey (51.4%). The analyses showed a statistically significant association between this dietary pattern and area of residence (p=0.0001) and BMI status (p=0.04), but did not suggest a significant association with other demographic characteristics of respondents.
Multivariate analysis for western dietary pattern
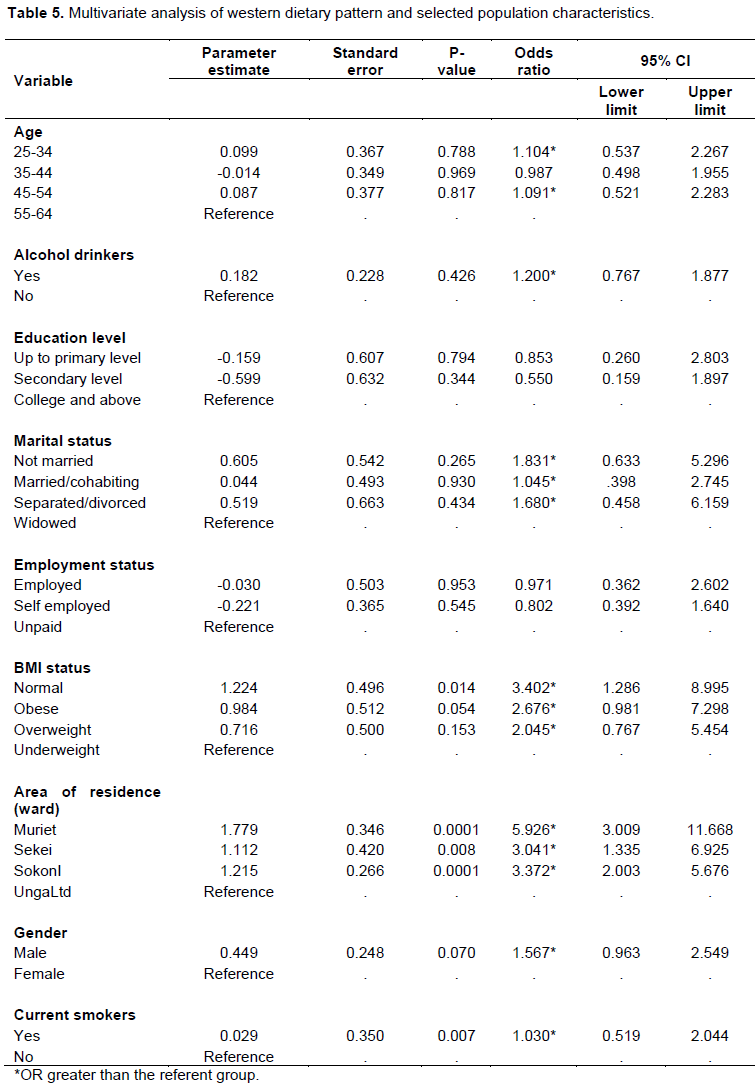
The results of univariate analysis showed that area of residence, gender and BMI status of respondent were significantly associated with western dietary pattern. In multivariate analysis, individuals of age 25 to 34 (OR=1.104, CI: 0.537-2.2267) and 45 to 54 (OR=1.091, CI: 0.521-2.283) were more likely to follow this dietary pattern than individuals aged 55-64 years. For an individual who consumed alcohol at least once in the previous 12 months, the chance of following this dietary pattern was 1.2 times higher than those that did not drink alcohol in the specified period (OR=1.2, CI: 0..767-1.877). Comparing people with different levels of education, people with college or higher levels of education had a greater likelihood of following the western dietary pattern than people with low levels of education (OR=0. 853, CI: 0. 260-2.803and OR=0.550, CI: 0. 159-1.897). The odds of adhering to this dietary pattern was 1.831 (OR=1.831, CI: 0.633-5.296), 1.045 (OR=1.045, CI: 0. 398-2.745) and 1.680 (OR=1.680, CI: 0.458- 6.159) higher among not married, married/cohabiting, and separated/divorced individuals respectively than their widowed counterparts.
When people with BMIs of less than 18 were compared to people with BMIs above 25, those in the latter group were more likely to follow this dietary pattern (OR=2.676, CI: 0.981- 7.298 and OR=2.045, CI: 0.767-5.454). A similar observation was noted among smokers when compared with non-smokers (OR=1.030, CI: 0.519-2.044). Detailed results are shown in Table 5.
In this study, an emerging and under-reflected topic linking dietary patterns to non-communicable diseases in developing contexts was considered. To the authors’ knowledge, this study is unique in Tanzania considering the link between CRC and dietary patterns. Previous aligned works have included a study linking dietary pattern and breast cancer (Jordan et al., 2013) and one demonstrating a relationship between dietary pattern and nutrition transition among women in Tanzania (Keding et al., 2011).
The dietary pattern gives an overall picture of the food consumption trends segueing to the linkage between diet and disease occurrence; in this case, dietary consumption pattern to CRC occurrence. Many ecologic studies implicate diet in CRC etiology with different studies highlighting the high loadings for red and/or processed meats, refined grains, high-fat diets, sweets and dairy products (Randi, 2010; Yusof et al., 2012). Different names have been used by different authors and these include but not limited to ‘western,’ ‘pork and processed meat,’ ‘pork and processed meat, and potatoes,’ ‘meat, potatoes and refined grains’, ‘high fat, meat and potatoes’ and others. On the other hand, ‘prudent,’ ‘healthy,’ ‘vegetables,’ and ‘fruit and vegetables’ dietary patterns, which tend to have high loadings for fruit, vegetables, poultry, fish, low-fat dairy, and whole grains, have shown negative association with colorectal cancer, although some studies have yielded inconsistent findings (Magalhaes et al., 2012; Randi, 2010). The differences may be due to methodological limitations, differences in population characteristics and/or study designs.
In this study, two major and one minor dietary pattern were identified as having significance. The dietary patterns derived from this data resembled those from previous studies which used similar factor analytic approach (Chen et al., 2015; Keding et al., 2011). What we labeled as a western dietary pattern was similar to two dietary patterns found in the breast cancer study in the northern Tanzania. The ‘chapatti’ and the ‘fatty’ pattern includes rice, nuts, eggs, chapatti (unleavened East African flat wheat bread), legumes, bread, soda and red meat, high consumption of milk, butter, lard, vegetable oils and fats, and a low consumption of sunflower oil and tea (Jordan et al., 2013). This second pattern was the ‘purchase’ pattern characterized by bread or cakes, sugar and tea. It is called the ‘purchase pattern’ because bread and cakes, such as doughnuts, chapati,
mandazi, or halfcake, are usually deep-fried or baked in oil and often bought (hence, purchased) from small shops (Keding et al., 2011).
The Western pattern in this study aligns with Keding et al. (2011) description of the nutrition transition in Tanzania (Keding et al., 2011). This pattern may be related to a 2% increase in rate of colon cancer and 1.5% decrease in rate of rectal cancer found in the pattern and distribution of CRC in Tanzania study (Katalambula et al., 2016). Evidence has linked colon cancer with lifestyle factors more than rectal cancer (Pischon et al., 2006). Consumption of meat and milk, increased access to junk food and soft drinks, and rising food consumption away from home have increased prevalence in Tanzanian current dietary patterns. In a case control study by Tayyem et al. (1998), which collected dietary data from 220 subjects previously diagnosed with CRC, and 281 control subjects, factor analysis revealed three major dietary patterns, namely “healthy pattern”, “high sugar/high tea pattern” and “western pattern”. After adjusting for confounding factors, the Western pattern was found to be significantly associated with an increased risk of developing CRC (OR = 1.88; 95% CI = 1.12 to 3.16). Slattery et al. (1998) established six different dietary patterns, where two of them ‘Western’ and ‘prudent’ patterns were the most important in relation to CRC. The Western pattern was rich in red and processed meats, fast food, eggs, margarine, potatoes and refined grains. This pattern was associated with a higher risk of colon cancer (Slattery et al., 1998). Other studies which associated Western dietary pattern and CRC showed similar findings (Magalhaes et al., 2012; Yusof et al., 2012).
The higher a participant’s affiliation with the Western dietary pattern, the higher his/her BMI. Upon further analyses, however, adjusting for BMI did not attenuate associations for the Western pattern, suggesting that BMI was not in fact a mediator due to methodological limitations in previous studies. This finding is consistent with a previous report on the linkage to red meat intake (Vergnaud et al., 2010). We also found that our participants differed in following the Western dietary pattern according to demographic and lifestyles characteristics.
Participants aged 25-34 and 45-54 were more likely to follow the Western dietary pattern as compared to the old one. Similarly, single, married/cohabiting, and divorced individuals tended to choose this type of food item more frequently than widowed ones. Also, lower adherence to the western dietary pattern seemed to be more among educated participants, as seen by Olinto et al. (2011) who indicated these individuals were generally more likely to have good incomes and access to information which potentially changed their diet as well as other behaviors. However, there are contradictory findings offered by Rezazadeh et al. (2010). New access to technologies (e.g., cheap edible oils, foods with excessive ‘empty calories’, modern supermarkets, food distribution and marketing) and regulatory environments (e.g., free flow of goods, services and technologies) are changing diets in low and middle-income countries.
There are inherent problems with FFQ, such as self-report bias, and limiting of the food reporting to serving frequencies rather than serving size.
In addition, added components, such as oil to prepare the foods, are not reflected through the FFQ. Despite these short comings, FFQ remains a powerful tool for assessing habitual food intake (Thompson et al., 2010). Furthermore, principal component analysis assists with identifying patterns (in this case of diet) through statistical modeling (Wang et al., 2014). In factor analysis, several subjective decisions such as categorizing of foods, define the factor loading cut-off, number of factors and labeling of the identified dietary patterns (Newby and Tucker, 2004) hence, some misclassification of foods may arise which in turn, alter dietary pattern scores (Martinez et al., 1998). However, use of this method is supported by scientific evidence (Smith et al., 2011) as it can capture overall effects of the diet as compared to individual components, and can test the validity of dietary recommendations (Van Dam, 2005). Factor analysis can overcome multicollinearity of various dietary variables, because it is a statistical dimension reduction technique that exploits the correlation of each variable (Olinto et al., 2011).
Two major dietary patterns, namely healthy and western patterns, exist among the study populations. Consumption of alcohol at least once in the previous 12 months, current smoking and high levels of education puts people at higher likelihood of partaking in a dietary pattern with an elevated risk for CRC. Findings from this study shed light on the possible linkage between diet and colorectal cancer in Tanzania. A large study with robust methodology which can establish linkage is recommended.
The authors have not declared any conflict of interests.
REFERENCES
|
Chan AT, Giovannucci EL (2010). Primary prevention of colorectal cancer. Gastroenterology 138(6):2029-2043.
Crossref
|
|
|
|
Chen Z, Wang PP, Woodrow J, Zhu Y, Roebothan B, Mclaughlin JR, Parfrey PS (2015). Dietary patterns and colorectal cancer: results from a Canadian population-basedstudy. Nutr. J. 14(1):8.
Crossref
|
|
|
|
|
Chiuve SE, Fung TT, Rimm EB, Hu FB, McCullough ML, Wang M, Willett WC (2012). Alternative dietary indices both strongly predict risk of chronic disease. J. Nutr. 142(6):1009-1018.
Crossref
|
|
|
|
|
Cross AJ, Ferrucci LM, Risch A, Graubard BI, Ward MH, Park Y, Sinha R (2010). A large prospective study of meat consumption and colorectal cancer risk: an investigation of potential mechanisms underlying this association. Cancer Res. 70(6):2406-2414.
Crossref
|
|
|
|
|
Fedirko V, Tramacere I, Bagnardi V, Rota M, Scotti L, Islami F, Boffetta P (2011). Alcohol drinking and colorectal cancer risk: an overall and dose-response meta-analysis of published studies. Ann.Oncol. 22(9):1958-1972.
Crossref
|
|
|
|
|
Flood A, Rastogi T, Wirfält E, Mitrou PN, Reedy J, Subar AF, Schatzkin A (2008). Dietary patterns as identified by factor analysis and colorectal cancer among middle-aged Americans. Am. J. Clin. Nutr. 88(1):176-184.
|
|
|
|
|
Hu FB (2002). Dietary pattern analysis: a new direction in nutritional epidemiology. Curr. Opin. Lipidol. 13(1):3-9.
Crossref
|
|
|
|
|
Johnson CM, Wei C, Ensor JE, Smolenski DJ, Amos CI, Levin B, Berry DA (2013). Meta-analyses of colorectal cancer risk factors. Cancer Causes Contr. 24(6):1207-1222.
Crossref
|
|
|
|
|
Jordan I, Hebestreit A, Swai B, Krawinkel MB (2013). Dietary patterns and breast cancer risk among women in northern Tanzania: a case–control study. Eur. J. Nutr. 52(3):905-915.
Crossref
|
|
|
|
|
Kant AK (2010). Dietary patterns: biomarkers and chronic disease risk. This paper is one of a selection of papers published in the CSCN-CSNS 2009 Conference, entitled Are dietary patterns the best way to make nutrition recommendations for chronic disease prevention? Appl. Physiol. Nutr. Metab. 35(2):199-206.
Crossref
|
|
|
|
|
Katalambula LK, Ntwenya JE, Ngoma T, Buza J, Mpolya E, Mtumwa AH, Petrucka P (2016). Pattern and Distribution of Colorectal Cancer in Tanzania: A Retrospective Chart Audit at Two National Hospitals. J. Cancer Epidemiol. 2016:3769829.
Crossref
|
|
|
|
|
Keding GB, Msuya JM, Maass BL, Krawinkel MB (2011). Dietary patterns and nutritional health of women: the nutrition transition in rural Tanzania. Food Nutr. Bull. 32(3):218-226.
Crossref
|
|
|
|
|
Kennedy G, Ballard T, Dop MC (2011).Guidelines for measuring household and individual dietary diversity. Food and Agriculture Organization of the United Nations.
|
|
|
|
|
Kesse E, Clavel-Chapelon F Boutron-Ruault MC (2006). Dietary patterns and risk of colorectal tumors: a cohort of French women of the National Education System (E3N). Am. J. Epidemiol. 164(11):1085-1093.
Crossref
|
|
|
|
|
Kirkegaard H, Johnsen NF, Christensen J, Frederiksen, K, Overvad, K, Tjønneland A (2010). Association of adherence to lifestyle recommendations and risk of colorectal cancer: a prospective Danish cohort study. BMJ 341:c5504.
Crossref
|
|
|
|
|
Limsui D, Vierkant RA, Tillmans LS, Wang AH, Weisenberger DJ, Laird PW, Harnack LJ (2010). Cigarette smoking and colorectal cancer risk
|
|
|
|
|
Magalhaes B, Peleteiro B, Lunet N (2012). Dietary patterns and colorectal cancer: systematic review and meta-analysis. Eur. J.
Crossref
|
|
|
|
|
Marmot M, Atinmo T, Byers T, Chen J, Hirohata T, Jackson A, Mann J (2007). Food, nutrition, physical activity, and the prevention of cancer: a global perspective. Available at:
View
|
|
|
|
|
Martinez ME, Marshall JR, Sechrest L (1998). The arbitrary nature of the factor analytical process. Am. J. Epidemiol. 148(1):17-19.
|
|
|
|
|
Miller PE, Lesko SM, Muscat JE, Lazarus P, Hartman TJ (2010). Dietary patterns and colorectal adenoma and cancer risk: a review of the epidemiological evidence. Nutr. Cancer 62(4):413-424.
Crossref
|
|
|
|
|
Newby P, Tucker KL (2004). Empirically derived eating patterns using factor or cluster analysis: A review. Nutr. Rev. 62(5):177-203.
Crossref
|
|
|
|
|
Olinto MTA, Willett WC, Gigante DP,Victora CG (2011). Sociodemographic and lifestyle characteristics in relation to dietary patterns among young Brazilian adults. Public Health Nutr. 14(01):150-159.
Crossref
|
|
|
|
|
Pischon T, Lahmann PH, Boeing H, Friedenreich C, Norat T, Tjønneland A, Halkjaer J, Overvad K, Clavel-Chapelon F, Boutron-Ruault MC, Guernec G (2006). Body size and risk of colon and rectal cancer in the European Prospective Investigation into Cancer and Nutrition (EPIC). J. Natl. Cancer Inst. 98(13): 920-931.
Crossref
|
|
|
|
|
Randi G, Edefonti V, Ferraroni M, La Vecchia C, Decarli A (2010). Dietary patterns and the risk of colorectal cancer and adenomas. Nutr. Rev. 68(7):389-408.
Crossref
|
|
|
|
|
Rezazadeh A, Rashidkhani B, Omidvar N (2010). Association of major dietary patterns with socioeconomic and lifestyle factors of adult women living in Tehran, Iran. Nutrition 26(3):337-341.
Crossref
|
|
|
|
|
Slattery ML, Boucher KM, Caan BJ, Potter JD, Ma KN (1998). Eating patterns and risk of colon cancer. Am. J. Epidemiol. 148(1):4-16.
Crossref
|
|
|
|
|
Smith AD, Emmett PM, Newby PK, Northstone K (2011). A comparison of dietary patterns derived by cluster and principal components analysis in a UK cohort of children. Eur. J. Clin. Nutr. 65(10):1102-1109.
Crossref
|
|
|
|
|
Tayyem RF, Bawadi HA, Shehadah I, Agraib LM, AbuMweis SS, Al-Jaberi T, Heath DD. (2016). Dietary patterns and colorectal cancer. Clin. Nutr. S0261-5614(16)30086-3.
Crossref
|
|
|
|
|
The United Republic of Tanzania. [Internet] Arusha, Tanzania: National Bureau of Statistics; 2016 8-28 [cited 2016 August 31, 2016].Basic demographic and socio-economic profile. Available at: www.tanzania.go.tz/egov_uploads/.../Descriptive_tables_Tanzania_Mainland_sw.pdf.
|
|
|
|
|
Thompson FE, Subar AF, Loria CM, Reedy JL, Baranowski T (2010). Need for technological innovation in dietary assessment. J. Am. Diet. Assoc. 110(1):48.
Crossref
|
|
|
|
|
Trichopoulos D, Lagiou P (2001). Dietary patterns and mortality. British J. Nutr. 85(02):133-134.
Crossref
|
|
|
|
|
Van Dam RM (2005). New approaches to the study of dietary patterns. British J. Nutr. 93(05):573-574.
Crossref
|
|
|
|
|
Vargas AJ, Thompson PA (2012). Diet and nutrient factors in colorectal cancer risk. Nutr. Clin. Pract. 27(5):613-623.
Crossref
|
|
|
|
|
Vergnaud AC, Norat T, Romaguera D, Mouw T, May AM, Travier N, Couto E (2010). Meat consumption and prospective weight change in participants of the EPIC-PANACEA study. Am. J. Clin. Nutr. 92(2):398-407.
Crossref
|
|
|
|
|
Wang H, Deng F, Qu M, Yang P, Yang B (2014). Association between dietary patterns and chronic diseases among Chinese adults in Baoji. Int. J. Chr Dis.
Crossref
|
|
|
|
|
World Cancer Research Fund (WCF), American Institute for Cancer Research (AICR) (2011).Colorectal cancer report, in Food, Nutrition, Physical Activity, and the Prevention of Cancer., AICR: Washington DC.
|
|
|
|
|
World Health Organization (WHO) (2008). Global Report, in WHO STEPS Surveillance Manual, World Health Organization. Geneva.
|
|
|
|
|
Yusof AS, Isa ZM. Shah SA (2012). Dietary patterns and risk of colorectal cancer: a systematic review of cohort studies (2000-2011). Asian Pac. J. Cancer Prev. 13(9):4713-4717.
Crossref
|
|