Full Length Research Paper
ABSTRACT
Total nutrient needs of adolescents are higher than any other time in the Lifecycle making susceptible to malnutrition. Any nutritional deficiency experienced during this critical period of life can have long lasting effect on the future health of the individual and also her offspring. Hence this study was to assess nutritional status and predictors of malnutrition among adolescent school girls, in south west Ethiopia. A cross sectional study was conducted using a multistage sampling technique and eight hundred and twenty school going adolescent girls were selected from southwest zones of Ethiopia, Southern Nation Nationality People Region (SNNPR). Twelve schools were randomly selected and allocation of study participant was made proportional to number of student in the classes. The selected subjects were classified into three groups based on the grades such as primary (grades 5 and 6), junior (grades 7 and 8) and high school (grades 9 and 10) according to educational system of Ethiopia. Using sampling frame schools roster, girls between the age of 10 and 19 were selected. Interviewer administered pre-tested structured questionnaire was used to collect the data. An UNICEF Seca Electronic weight Scale and portable plastic height measuring instrument was used for obtaining anthropometric data immediately after face-to-face interview. The data were analyzed using SPSS version 20. An anthropometric measure was converted to the indices of nutritional status, Z-scores of height for age and BMI for age using WHO AnthroPlus version 1.0.3 software. All statistical significances were declared at p-value less than 0.05. The mean (±SD) of height-for-age z scores (HAZ) and body mass index for age z-score (BAZ) of the participants were -0.62 (±0.88), and -0.41(±0.99) respectively. Residence, regularity of breakfast, no episode of illness in the preceding one month to interview, fuels used for cooking in the household, hand-washing habit after toilet use, time spent on sedentary activities, consumption of sweet food items, consumption of cereal, mothers’ occupation were significant predictors (p<0.05). From the study it was obvious that over nutrition and obesity is not the major problem of female adolescent student .It is therefore relevant to focus on enhancement of the eating practices of adolescents. Strengthened Health education focusing on regular consumption of breakfast, washing hand after toilet use and preparing separate kitchen for cooking should be there. Though sweet foods and drinks consumption may be discouraged; in this community it is necessary to maintain healthy eating practices to achieve desired nutritional status of the adolescents by increasing their sweet food consumption.
Key words: School going adolescent girls, nutritional status.
INTRODUCTION
Adolescence is the period of transition between childhood and adulthood (WHO, 1993), which is characterised by the growth spurt (Stang and Story, 2005). This is about the same period puberty sets in, is a typical window of opportunity for the improvement of nutritional status ((Stang and Story, 2005; WHO, 1993). During this time, the major physical changes affect the body’s nutritional needs, while behavioral changes in one’s lifestyle may affect eating habits and food choices. Because of the major physical and psychosocial development, the total nutrient needs are higher during adolescence than any other time in the Lifecycle (WHO, 1993; Stang and Story,2005; WHO, 2002).
Besides; puberty is a time when the role of gender is explored, despite constraints in the physical and social environment. It is obvious that boy’s freedoms and opportunities are continuously expanding; conversely girls often face restriction and marginalization in most settings for social cultural factors (Ahmad et al., 2009; ENARI, 2009; Bertini, 2011). Girls suffer disadvantages from food taboos and restrictions because of their gender (WHO, 2002).Boys are often coveted because of their expected roles as household heads; whereas girls are seen as temporary family members because they supposed to join another household when they marry. Whenever family resources are strained, boys are often seen as more valuable and worthy of investment (Bertini, 2011). It is noted that work burdens for girls are especially heavy (Hadley et al., 2011). As result, adolescent girls are more prone to nutritional problems rather than adolescent males (Anthony, 2011). Since it is a time to prepare for the nutritional demands of pregnancy and lactation that adolescent girls will experience in their later life (WHO, 2010, 2005),any nutritional deficiency experienced during this critical period of life can have an effect on the future health of the individual and also her offspring (WHO, 2005).
There is established evidence that children born to short and thin women are more likely to be stunted and underweight (WHO, 2005). Therefore, it is worrisome that, the nutritional problem in adolescent girls persists throughout their reproductive life and passes to the offspring, having long lasting effect across generation (Anthony, 2011). Therefore, investing in adolescent girl’s opportunities can have a positive development impact on their families and can help to create a long-term improvement in poverty reduction (Anthony, 2011). Studies proved that malnutrition is caused by combination of factors like low income illiteracy, an unhealthy environment, inadequate health services, unhealthy food habits, low agricultural productivity and others (WHO, 2002, 2006; Abalo, 2009). Gender discrimination, poverty, lack of education, inappropriate feeding practices, irrational beliefs, food taboos that prevented consumption of certain foods, and faulty interfamilial distribution of food are reported reasons for potential poor nutritional status of adolescent girls (WHO, 2002).
The nutritional status of adolescent girls, however, has been little explored in Ethiopia. This study, therefore, is aimed at assessing the level of adolescent girl’s nutritional status and identifying the potential predictors of girls ‘malnutrition in south west Ethiopia. Thus, the study provided substantial data on the level of adolescent girl’s nutritional status in southwest Ethiopia.
METHODS AND MATERIALS
A cross-sectional survey was carried out in southwest zones, of the Ethiopian Southern Nations, Nationalities and Peoples Region (SNNPR). The area covered were Bench Maji, Sheka and Keffa Zones having a total of 23 administrative districts which were located at a distance of 556 km south west Addis Ababa. Based on the 2007 housing and census, population projection, the Zones has an estimated total population of 1.8 million (CSA, 2008). The people in the Zones economically depend on agricultural products including coffee, vegetables, fruits and cereal crops (SNNPR and USAID, 2006). The Zones education office reported that averages of 97% of adolescent girls were registered to attend school in the 2013. According to the Zonal Planning and Development office, there were 35 schools having all grades of five to ten.
Source population
All adolescent school girls age of 10 to 19 years in the selected twelve schools.
Study population
Randomly selected school girls’ adolescents age of 10 to 19 from the selected twelve schools.
Sample size determination and sampling procedure:
The sample size was calculated using Epi Info epidemiological software version 7 using sample size for the population survey. The parameters used for the sample size determination were based on the prevalence of thinness, from the study done in north Ethiopia was 58% (Mulugeta et al., 2009), 95% level of confidence, 5% confidence limit. The calculated sample after multiplying by design effect of 2 and adding 10% possible non-response rate and hence the final sample was 822. A two-stage sampling technique was employed to draw a representative sample of adolescent female students from randomly selected 12 schools of the three Zones. In each of the selected school, the grades were classified into three strata such as primary grade 5 and 6, junior grade 7 and 8 and high school grade 9 and 10 according to educational system of Ethiopia. The allocation of the target study subjects was made based on proportional to size of the classes. Then subjects were randomly selected from the frame which was made from the schools roster according to the definitions of adolescent by WHO, women between the age of 10 and 19 years (WHO, 1993).
Data collection tools
The data was collected using interviewer administered pre-tested structured questionnaire which was developed based on the relevant literature and modified to local setting (ENARI, 2009). UNICEF Seca Electronic weight Scale and portable plastic height measuring instrument was used for obtaining anthropometric data immediately after face-to-face interview of the subject.
Measurement
One of the investigators recorded height and weight. Ten trained diploma nurses who were bilingual of Amharic and local language conducted the face-to-face interview. Supervisors were assigned to check the accuracy, completeness and the consistency of information obtained. The dietary habit and the food consumption of adolescent girls were assessed using FFQ (foods frequency questionnaire) for adolescents consisting of eight food item groups adopted from FANTA 2006 (Swindale and Bilinsky, 2006). The frequency weighted diet diversity score or “Food consumption score” is a score calculated using the frequency of consumption of different food groups consumed by the participant during the 7 days before the survey. A recall of 7 days is recommended to ensure both good time coverage and “reliability” of respondent’s memory (UNFP, 2008). The food items were classified into seven categories based on consumption. which includes 1 never; 2 less than once a month; 3 one to three times a month; 4 once a week; 5 two to four times a week; 6 once a day and 7 two or more than twice a day. The food commodities were distributed into eight groups such as cereals, greens and vegetables, fruits, milk and milk products, meat and eggs, legumes, oil and fat, sugar and sweets. Meal frequency was assessed by the questions raised on how often atypical meals, that is, breakfast, lunch, dinner and in between meals is taken per day. Household chores and school based physical exercise and games were measured by responses given on how many days in a typical week they were engaged in a list of activities. Adolescent girl’s food insecurity was measured using adapted and validated food insecurity scales for developing countries (Belachew et al., 2011) as one and responses on “No” were coded as zero and the responses were analyzed and interpreted to produce a score of food insecurity, and was further dichotomized, as “food secure” for a score equal to zero “food in secure” for a score is greater than zero.
Data analysis
The data was cleaned and analyzed using SPSS version 20. An anthropometric measure was converted to the indices of nutritional status (the Z-scores of height for age and BMI for age) using WHO AnthroPlus version 1.0.3 software. Stepwise multivariable linear regression analysis was used to identify potential predictors of nutritional status (BMI- for- age and height for age Z score). P-P plot was used to assess the normality of the data. All variables were normally distributed. Means and proportions were computed. All statistical significance was declared at p-value less than 0.05.
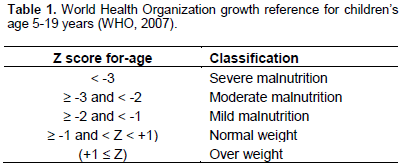
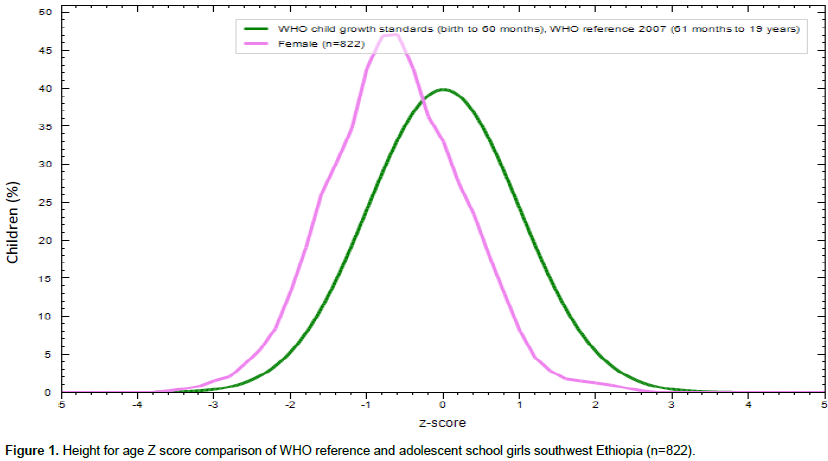
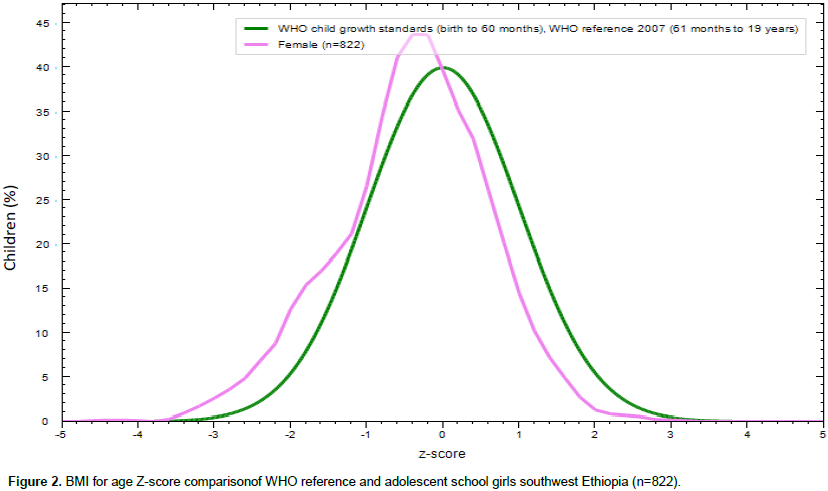
The WHO 2007 child and adolescent growth reference data was used as a standard reference during analysis and comparison of anthropometric data. The severity of under nutrition was assessed by Z-score according to the classiï¬cation of WHO 2007 growth reference data for adolescent girls (WHO, 2007) (Table 1).
Ethical considerations
Ethical approval of the study protocol was obtained from Wolaita Sodo University, College of Health Sciences and Medicine, Research Ethical Review Committee. In addition verbal assent from the selected adolescents were obtained throughout the data collection process and time was given to receive any concern that they have related with the survey.
RESULTS
Eight hundred and twenty-two (822) adolescent girls were studied, from which 519(63.1%) were from rural schools. Most of the respondents were orthodox in religion 487(59.3%) followed by protestant. The mean (SD) ages, of the participants were 14.29 (±2.0) years. Most of respondents 390 (47.4%) were in the middle age, followed by early age category 315 (38.3%). The mean (SD) of Age at menarche was 13.52(±1.1) years and 484(58.9%) of the girls had started menses (Table 2).
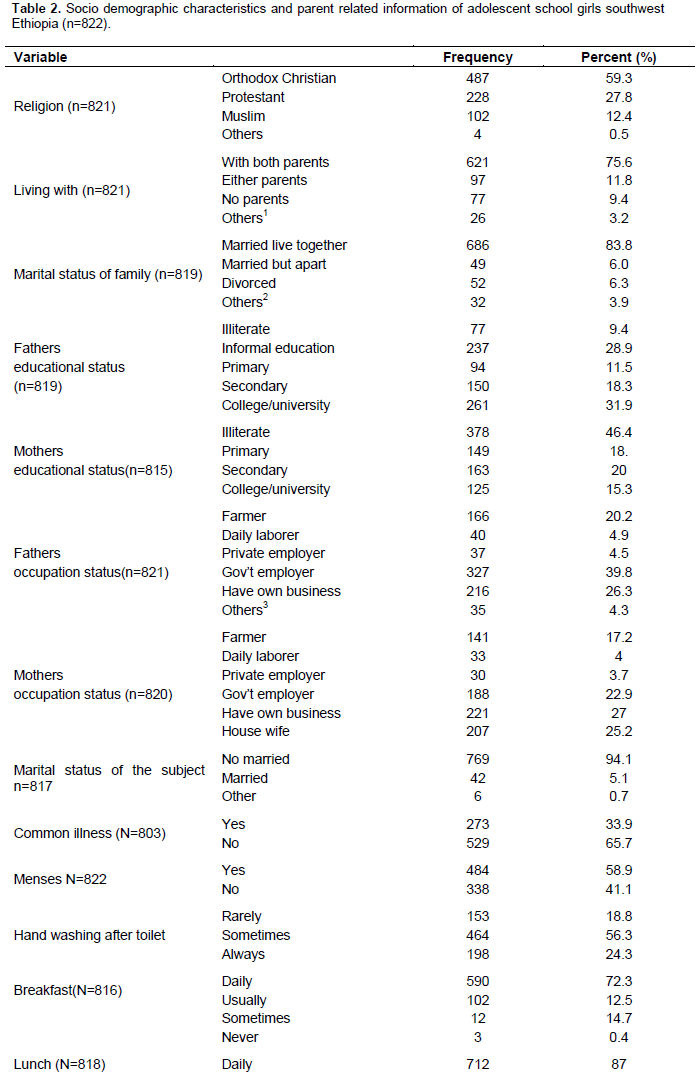
Dietary habits of girls
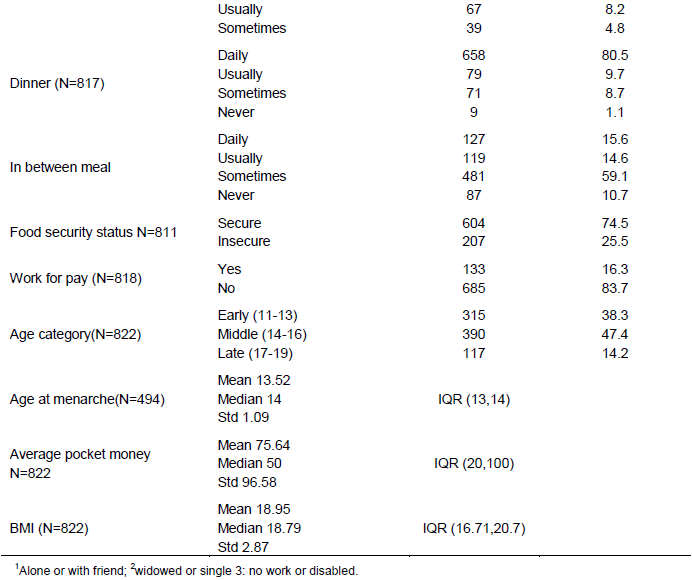
Regarding the meal pattern about 743(91%) the participants reported three or more meals a day that is to say, breakfast, lunch and dinner, which is typical. In-between meals were also common features, 727(89.3%) of the participant took snacks at least some days of the week. Out of the girls 590(72.3%), 712(87 %) and 658(80.5%) took breakfast, lunch and dinner respectively regularly in all days of the week. A considerable proportion, 207(25.5%) of the participants reported that they are food insecure (Table 2).
Nutritional status of adolescent girls
Height-for-age z scores (HAZ) and body mass index for age z-score (BAZ) of the participants were -0.62(±0.88) z score, and -0.41(±0.99) respectively (Figures 1 and 2).
Factors affecting adolescent girls’ nutritional status
Time spent on sedentary life, gynecological age, monthly pocket money, mother’s occupation, work load, age at menarche and absence of menses and illness in the last month preceding the interview were found to be a significantly associated factors with BMI for age z scores of adolescent girls (p<0.05). Similarly, time spent on sedentary life, average monthly pocket money, mothers’ educational level, perceived heavy bleeding during menstruation, workloads, distance from health facility in kilometer, means of transport and residence were significantly associated with height for age z scores of adolescent girls during bivariate (P<0.05). And those variables are further analyzed to identify independent predictors using multiple linear regressions.
Independent predictors of adolescent girls’ nutritional status
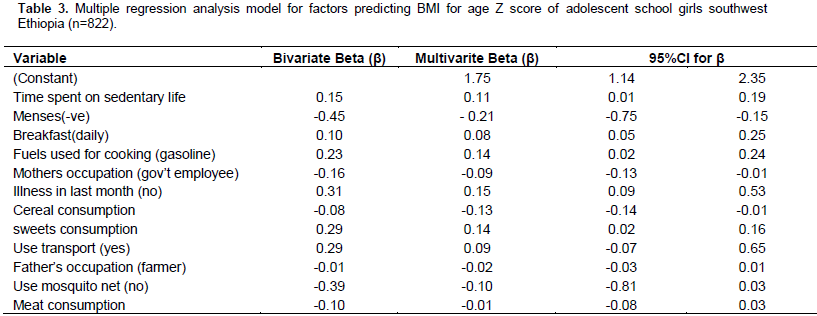
Tables 3 and 4 show the regression estimates and the relative effect of each predictor variable for adolescent nutritional status. As depicted in Table 3, time spent on sedentary life, no episode of illness in the preceding one month to interview, fuels used for cooking in the household, consumption of sweet food items, consumption of cereal and mothers’ occupation were significant predictors of BMI for age Z score of adolescent girls. In line with these findings, non-menstruating girls were on average β = -0.21 (95% CI:-0.75, -0.15) units lower BMI for age Z score than menstruating girls. Moreover, respondents who do not suffer any illness in the preceding one month from the time of interview were on average β = 0.15(95%CI: 0.09, 0.53) units higher scores than respondents reported illness. Respondents who were engaged for one more hours longer per day on sedentary life had on average β = 0.11(95%CI: 0.01, 0.09) units increase in BMI for age Z score. Fuels used in household for cooking has a significant effect on the BMI for age Z score of the respondent. Respondents from the household where gasoline was the main fuels for cooking, were on average β = 0.14(95%CI: 0.02, 0.24) units increase in their BMI for age Z scores than those from households used firewood. More over subjects who consume more meals with cereals on average drop their BMI for age Z score by 0.13 units β = 0.13 (95% CI:-0.14,-0.01), while consuming more sweet food items raise the Z scores on average by 0.145 units β = 0.145 (95%CI: 0.016, 0.160). Likewise the final model revealed that residence, regularity of breakfast, with whom currently the participants live with, hand-washing habit after toilet use and place of cooking were significant predictors of height for age z scores in adolescent girls (P<0.05) (Table 4).
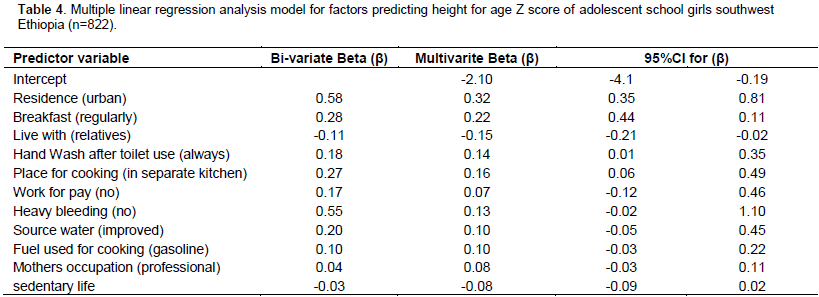
Girls from urban settings were on average β = 0.32(95%CI: 0.35, 0.81) units higher height for age z scores than girls from rural settings. Those girls who always washed their hands after toilet use were β = 0.14(95%CI: 0.014, 0.351) units higher height for age z scores than subjects who washed their hands some times. Concerning the meal frequency, respondents who took breakfast daily had on average β = 0.22(95%CI: 0.44, 0.11) units higher height for age z scores than respondents who took breakfast some times. Adolescent girls from households with separate kitchen were on average β = 0.16(95%CI:-0.06, 0.49) higher units of height for age z scores than those who come from households which cook in living house. Accordingly, marital status, education and occupational status of parents did not appear to be statistically significant predictors of height for age Z score of adolescent girls in multivariable regression analysis. Those subjects who live with their relatives had on average -0.14 units lower height for age z score than those respondents who live with their both biological parents β = -0.14 (95%CI:-0.21,-0.02).
DISCUSSION
Apart from the scientific reports of high rates of adolescent under nutrition from the developing world (ENARI, 2009; Mulugeta et al., 2009; UNFP, 2008; Belachew et al., 2011; WHO, 2009; Mulugeta et al., 2010) adolescents have been considered as low risk groups for health and nutrition. In our study mean values for BMI among adolescent girls is 18.95 which is lower than results from Minneapolis/St. Paul area, a school-based population study and Kuwaiti intermediate school adolescents aged 10 to 14 years, BMI mean of 23.3 and 20.7, respectively (Neumark-Sztainer et al., 2002; Al-Isa, 2004). The reason might be the food consume in the area has high fiber and low fat content, because the area is highly rich in vegetables and fruits. In addition those foods are relatively cheap as compared with the cost of meat products in the area.
Significant association was observed between non-menstruating girls and BMI for age Z score β = 0.21 (95%CI:-0.75, -0.15). But, in contrast, no significant association was found between BMI for age Z score and meat consumption β = -0.08(95%CI: -0.01, 0.03).
Concerning the practice of physical activity, respondents who were engaged one more hours longer per day on sedentary life had on average β = 0.11(95% CI: 0.01, 0.09) units increase in BMI for age Z score. These results can be explained by the busy routine of the students for exam (Vieira et al., 2002).Thus, less physical activity and more time spent participating in activities such as reading, results in less energy expenditure. Similarly respondents who did not suffer any illness in the preceding one month from the time of interview were on average 0.15 units higher scores than respondents who reported illness β = 0.15(95% CI 0.09, 0.53). It is known that infection could affect nutritional status, either through loss of appetite, difficulty to swallow due to GIT problems or high body metabolism as a result of the infectious process.
Washing hands always after toilet use significantly associated with height for age z scores than subjects who washed their hands sometimes. The reason might be under unhygienic conditions, during toilet use the hand can be contaminated very easily and serve as a vehicle for intestinal parasites transition which will have a dramatic impact on the nutritional status of the girls. Concerning the meal frequency, respondents who took breakfast daily had on average β = 0.22(95%CI: 0.44, 0.11) units higher height for age z scores and β = 0.08(95%CI: 0.05, 0.25) unit higher BMI for age Z score than respondents who took breakfast some times. This is a fact that, skipping breakfast metabolically implies increasing a period of fasting for more than twelve hours, in general, during which the body does not receive nutrients. Thus, breakfast is recognized as the most important meal of the day due to its role in the health context and in the understanding of human physiology (Barbosa, 2007). Some studies have investigated the omission of this meal among adolescents and young adults, was observed in 35.4% of schoolchildren in Florianopolis (da Silveira Araújo et al., 2009).
Place of residence predicted growth in under-five children (24) similarly in our study on adolescent, Girls from urban settings were on average β =0.32(95%CI: 0.35, 0.81) units higher height for age z scores than girls from rural settings. More over subjects who consume more meals with cereals on average drop their BMI for age Z score by 0.13 units β = 0.13 (95% CI:-0.14,-0.01), while consuming more sweet food items raise the Z scores on average by 0.145 units β = 0.145 (95%CI: 0.016, 0.160). This is due to the fact that diets higher in calories (including fat and simple sugars) and leaser in fruits and vegetables are linked with overweight (Connecticut Centre for Health, n.d.;postnote, 2003).
CONCLUSIONS
Under nutrition is common in the area, when we compare it with WHO growth reference data for 5 to 19 years (WHO, 2007). The independent predictors of nutritional status in this study were residence, regularity of breakfast, with whom currently the participants live with, hand-washing habit after toilet use, place of cooking, time spent on sedentary life, episode of illness in the preceding one month to interview, fuels used for cooking in the household, consumption of sweet food items, consumption of cereal and mothers’ occupation.
RECOMMENDATION
It is relevant to focus on enhancement of the eating practices of rural adolescents in order to prepare a future healthy society. More attention needs to be given to the regular consumption of breakfast, hand washing all the time after toilet use and preparing separate kitchen for cooking. Though sweet foods and drinks consumption may be discouraged, in this community it is necessary maintaining healthy eating practices for achieving desired nutritional status of the adolescents by increasing their sweet food consumption. Students should be adopted by their parents. Strategies should be designed in order to address the nutritional status of girls in addition to the usual approach of providing services to pregnant and lactating women through the established maternal and child health care programs.
CONFLICTS OF INTERESTS
The authors have not declared any conflict of interests.
ACKNOWLEDGEMENTS
The authors are thankful to all study participants, supervisors and data collectors for their unreserved efforts and willingness to take part in this study.
REFERENCES
|
Abalo K (2009). Poverty and the Anthropometric Status of Children: A Comparative Analysis of Rural and Urban Households in Togo (No. RP_191). African Economic Research Consortium. |
|
|
Ahmad H, Liaqat P, Paracha PI, Qayyum A, Uppal MA (2009). Assessment of nutritional status of adolescents versus eating practices in Islamabad City. Pak. J. Nutr. 8(8):1304-1308. |
|
|
Al-Isa AN (2004). Body mass index, overweight and obesity among Kuwaiti intermediate school adolescents aged 10-14 years. Eur. J. Clin. Nutr. 58(9):1273-1277. |
|
|
Anthony D (2011). The state of the world's children 2011-adolescence: an age of opportunity. United Nations Children's Fund (UNICEF). Barbosa L (2007). Feijão com arroz e arroz com feijão: o Brasil no prato dos brasileiros. Horizontes Antropológicos 13(28):87-116. |
|
|
Belachew T, Hadley C, Lindstrom D, Gebremariam A, Lachat C, Kolsteren P (2011). Food insecurity, school absenteeism and educational attainment of adolescents in Jimma Zone Southwest Ethiopia: a longitudinal study. Nutr. J. 10:29. |
|
|
Bertini C (2011). Girls grow: a vital force in rural economies. The Chicago Council on Global Affairs. |
|
|
da Silveira Araujo ED, Blank N, de Oliveira WF (2009). Physical activity and nutritional habits of teenagers from three public schools in Florianópolis/SC. |
|
|
Ethiopia CSA (2008). Summary and statistical report of the 2007 population and housing census. Federal Democratic Republic of Ethiopia Population Census Commission, Addis Ababa, Ethiopia. pp. 1-10. |
|
|
Hadley C, Belachew T, Lindstrom D, Tessema F (2011). The shape of things to come? Household dependency ratio and adolescent nutritional status in rural and urban Ethiopia. Am. J. Phys. Anthropol. 144(4):643-652. |
|
|
Ethiopian Health and Nutrition Research Institute (ENARI) (2009). Nutrition baseline survey report for the national nutrition program of Ethiopia. |
|
|
Mulugeta A, Hagos F, Kruseman G, Linderhof V, Stoecker B, Abraha Z, Yohannes M, Samuel GG (2010). Child malnutrition in Tigray, northern Ethiopia. East Afr. Med. J. 87(6):248-254. |
|
|
Mulugeta A, Hagos F, Stoecker B, Kruseman G, Linderhof V, Abraha Z, Yohannes M, Samuel GG (2009). Nutritional status of adolescent girls from rural communities of Tigray, Northern Ethiopia. Ethiop. J. Health Dev. 23(1):5-11. |
|
|
Neumark-Sztainer D, Story M, Hannan PJ, Croll J (2002). Overweight status and eating patterns among adolescents: where do youths stand in comparison with the healthy people 2010 objectives? Am. J. Public Health 92(5):844-851. |
|
|
Post note (2003). CHILDHOOD OBESITY. London. |
|
|
Southern Nation, Nationalities and People's Region, Ethiopia Livelihood Profiles January 2006 USAID FEWS NET. (2006). |
|
|
Stang J, Story M (2005). Guidelines for Adolescent Nutrition Services Center for Leadership, Education and Training in Maternal and Child Nutrition, Division of Epidemiology and Community Health, School of Public Health, University of Minnesota: Minneapolis. |
|
|
Swindale A, Bilinsky P (2006). Household dietary diversity score (HDDS) for measurement of household food access: indicator guide. Washington, DC: Food and Nutrition Technical Assistance Project, Academy for Educational Development. |
|
|
The Connecticut centre for Health (2008). United Nations World Food Programme - Food Consumption Analysis: Calculation and Use of the Food Consumption Score in Food Security Analysis. |
|
|
Vieira VC, Priore SE, Ribeiro SM, Franceschini SD, Almeida LP (2002). Socioeconomic, nutritional and health profile of adolescents recently admitted to a Brazilian public university. Revista de Nutrição, 15(3):273-282. |
|
|
World Health Organization (WHO) (2005). Nutrition in adolescence–issues and challenges for the health sector. |
|
|
World Health Organization (WHO) (1993). The health of young people: A challenge and a promise. World Health Organization. |
|
|
World Health Organization (WHO) (2001). Broadening the horizon: Balancing protection and risk for adolescents. |
|
|
World Health Organization (WHO) (2002). Improvement of nutritional status of adolescents. In Report of the Regional Meeting Chandigarh, India pp.17-19. |
|
|
World Health Organization (WHO) (2006). Adolescent nutrition: a review of the situation in selected South-East Asian countries. |
|
|
World Health Organization (WHO) (2007).Growth Reference Data for 5-19 Years. Available at: |
|
|
World Health Organization (WHO) (2009). Software for assessing growth of the world's children and adolescents. Who Antro Plus for Personal Computers Manual. |
|
Copyright © 2024 Author(s) retain the copyright of this article.
This article is published under the terms of the Creative Commons Attribution License 4.0


