Full Length Research Paper
ABSTRACT
Inadequate nutritional intake prior to pregnancy, during pregnancy and lactation process increases postnatal nutritional stresses and health risk of the mother resulting in a high maternal mortality. The aim of this study was to compare nutritional status and associated factors of urban and rural lactating women from Shashemene Woreda, West Arsi Zone of Oromia, Ethiopia. A community based comparative cross-sectional study was conducted among 484 randomly selected lactating mothers from six kebeles. Anthropometric measurements were taken from each mother using calibrated equipment and standardized techniques. A 24 hr dietary intake was also collected from randomly selected sub sample (n=48) of mothers. The energy and nutrient content of foods consumed by the mothers was calculated using Ethiopian food composition and world food tables. Logistic regression model, independent t-test analyses and chi-square test were used to see the mean difference in nutrient intake and nutritional status among lactating mothers. Variables with a p-value less than 0.05 on multiple variable logistic regressions were taken as significant variables. The prevalence of under-nutrition (MUAC<23 cm) among lactating mothers was higher in rural than urban communities with observed statistical significant difference (X2=12.5, p ≤ 0.001), but they are comparable in other indices. Residence of lactating women [AOR=2.54, 95% CI (1.5, 4.31)] and age of breast fed child [AOR=0.46, 95% CI (0.28, 0.78)] were significantly associated with nutritional status of lactating mothers. Having breast feeding child was significantly associated with nutritional status (BMI) of lactating mothers [AOR=0.37, 95% CI (0.17, 0.81)]. Feeding practices in urban study subjects had better feeding practices than that of rural areas (X2 = 25.0, p-value ≤ 0.001). It was not sufficient to attain their increased energy and nutrient requirements, which is worse among rural than urban study subject. Therefore, improvements of health and nutrition are recommended to lactating mother on increased food intake, proper dietary practices, and dietary diversity during lactation.
Key words: Lactating women, nutritional status, dietary diversity, feeding practice.
INTRODUCTION
Lactation period is a major source of concern in developing countries because of its positive impact women from developing countries are considered nutritionally vulnerable groups because of high nutritional on health and nutritional status of infants. Lactating demand during this period. Inadequate maternal diet during this period will also lead to poor secretion of nutrients in breast milk and this can have long term impact on the child’s health (Ukegbu, 2014).
Under-nutrition and poor health from preventable causes disproportionately affect the well-being of millions of people in the developing world. Factors at individual, household and community level, or a combination of these factors, may contribute to poor nutrition and health status. In particular, malnutrition among women is likely to have a major impact on their own health as well as their children’s health. More than 3.5 million women and children under age five in developing countries die each year due to the underlying cause of under-nutrition (Bitew et al., 2010).
Women are more likely to suffer from nutritional deficiency than men for several reasons, including their reproductive biology, low social status, poverty and lack of education. In addition, socio-cultural traditions and disparities in household related to work patterns can also increase women’s chance of being malnourished (Haileslassie et al., 2013). Between 5 to 20% of women in various African countries are underweight. Many African women display low weight-for-height as measured by body mass index of less than 18.5 kg/m2 (Linkage-Publication, 2001).
Maternal and child under-nutrition is highly prevalent in low-income and middle-income countries, resulting insubstantial increases in mortality and overall disease burden. In Ethiopia, the current prevalence of chronic under-nutrition among women in reproductive age group ranges from 20-27% (Berihun et al., 2017; Abeya et al., 2018; Temesgen et al., 2015). Reducing the prevalence of chronic under nutrition from 27 to 19 % was one of a target strategic plan under National Nutrition Program (NNP) by the year of 2015, but not yet achieved. Women’s nutrition affects a wide range of health and social issues, including family care and household food security. Food insecurity and malnutrition in adolescents and pregnant women’s compounded by gender discrimination, leads to an inter-generational cycle of nutrition problems.
The total energy requirements during lactation are equal to those of the pre-pregnancy period, plus the additional demands imposed by the need for adequate milk production and secretion. In the first 4–6 month of the postpartum period, infants double their birth weight accumulated during the 9 months of pregnancy. The milk secreted in 4 month represents an amount of energy roughly equivalent to the total energy cost of pregnancy (FAO/WHO/UNU, 2001; Kawatra and Sehgal, 1998).
Micronutrient status of pregnant and lactating women affects infant survival, growth, and development. For example, vitamin A deficiency results in reduced fetal stores and lower levels of vitamin A in breast milk. Infants and young children who are vitamin A deficient are at an increased risk of appetite loss, eye problems, lower resistance to infections, more frequent and severe episodes of diarrhea and measles, iron deficiency anemia, and growth failure. Increased risk of illness leads to an increased risk of death (Linkage-Publication, 2001; Assefa et al., 2015).
The proportion of women suffering from Chronic Energy Deficiency (CED) malnutrition was significantly higher in rural areas than in urban areas. The highest prevalence of chronic energy deficiency in women was observed in Somali (48%), followed by Afar (42%), Gambella (39%) and Benishangul-Gumuz (38%); it was lowest in Addis Ababa (18%) and Harari (25%), the two most urban areas of the country (Berihun et al., 2017; Temesgen et al., 2015; Amare et al., 2012).
Despite women’s increased risk of malnutrition, studies that assessed feeding practice and nutritional status of lactating mothers are limited in Ethiopia. Therefore, this study is aimed at assessing the nutritional status and associated factors contributing to nutritional deficiency in lactating women in West Arsi Zone, Oromia region of Ethiopia.
METHODOLOGY
Study setting and design
The study was carried out in six kebeles of Shashemene Woreda, West Arsi Zone of Oromia region, Ethiopia, which were randomly selected from 45 kebeles of the Woreda (that is 3 out of 8 urban and 3 out of 37 rural kebele) from July to September, 2015. Shashemene town is the largest town of the Woreda and as well one of the old towns of Oromia Region. It is located 253 km, south east of Addis Ababa, the capital city of Ethiopia and it serves as the capital town of West Arsi Zone. The town has a mean annual rain fall of 87.8 millimeters, and altitude of 1800 above sea level with 26.8 and 11°C maximum and minimum annual temperature respectively. The study area has a total population of 405,165 of which 198,531 (49%) were male, and 206,634 (51%) are female. Among these, 13,776 (3.4%) were lactating mothers of the Shashamane woreda, of which 5218 were from Urban and 8558 were from rural (CSA, 2011). A community based comparative cross-sectional study was conducted among lactating women who were living in urban and rural areas.
Sampling
A sample size was calculated by using a double population proportions formula with 95 percent level of significance (α=0.05), 80 percent power (β=0.20), 25 % estimated prevalence’s of chronic
energy deficiency in the study area of which 12% were urban prevalence (P1) (Gibson, 2005). With the assumption of significant difference between the previous study area and this study area, we considered the prevalence of chronic energy deficiency of rural increased by 10 % from urban, which is 22% (P2). Therefore, the proportion difference between the two strata (P2- P1) is 0.1. The minimum number of the subjects ‘n’ required for the study for each stratum was estimated from the formula:
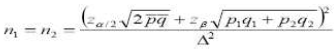
and taking into consideration a possible Non-response rate of 10%.
Therefore, that, the total sample size for this research was 242 for each stratum (that is 484 total sample sizes). Then, the total number of kebele in the Woreda was initially stratified into rural and urban areas with the assumption of homogeneity within each stratum of residence.
Six (three from each stratum) were selected from the list of kebele by simple random sampling technique. The households with lactating mothers were identified in each selected kebele through house-to-house visits by the research assistants. A sampling frame was prepared by registering all the identified eligible lactating women in each kebele and provided study code. After that, number of mothers to be selected was proportionally allocated to each kebele based on the size. Finally, simple random sampling technique was used to select the required number of lactating mothers per each kebele among those who fulfill inclusion criteria.
Data collection
Six research assistants and 2 supervisors consist of nursing and nutrition professionals who were fluent in the local language (Afan Oromo and Amharic) were recruited and trained for data collection process. A structured questionnaire was used to obtain information on socio-demographic characteristics of the subjects such as age, religion, marital status, length of marriage, occupation, level of education, and household size. Data on maternal characteristics and household factors (that is wealth quintiles and access to safe water) were also assessed using the questionnaire. A pre-test was carried out using randomly selected lactating mothers of Arsi- Negele Woreda of both rural and urban residence. Data on frequency of foods taken and dietary diversity were assessed by using structured questionnaire adapted from FAO guideline of measuring household and individual dietary diversity. Dietary diversity score (DDS) was collected and calculated as the sum of the number of different food groups consumed by the mother in the 24 hours prior to the assessment. A total of 17 food items were considered (that is cereals, vitamin A rich vegetables and tubers, white tubers and roots, dark green leafy vegetables, other vegetables, vitamin A rich fruits, any meat, egg, fish, legumes and nuts, milk and milk products, oils and fats, condiments and beverages, sweets) (Gibson, 2005). However, the dietary intake assessment were conducted through single day 24 h dietary recall assessment from randomly selected sub-sampled study participant (10 % of all sample size = 48) to show some information about the energy and nutrient intake discrepancy between urban and rural sub-sampled population but not for generalization of the study. During the data collection time, the data collectors in each kebele went to participant's household and weighed foods consumed by the mother. To get the weight eaten food by the mother, primarily the original serving/portion size were weighed prior to eaten and then any left-over were weighed at each meal after eaten and lastly the left over foods were deducted from the weighed original serving. Foods and beverages consumed by lactating mothers were weighed using digital scales (2 kg maximum weight: Model CS 2000, Ohaus Corporation, USA) accurate to ± 1 g. While weighing the foods and drinks, a detailed description of the foods and their cooking methods were recorded or documented by the research assistance. To account for any day of the week effects on food and/or nutrient intake, weekends, week days and market days were proportionately represented in the survey. Study subjects were well informed not to change their normal dietary pattern over the food record day. They were asked to eat separately and not to share their meals during the day of data collection. The amount of the mixed dish consumed by the respondents were recorded on the mixed dish recipe form and on the 24-h recall form under “amount eaten.” and then the weight of each ingredient in the mixed dish in the recipe were calculated and then we were calculated the weight of each ingredient actually consumed by the respondent (Black, 2008). Finally, the average nutrient intakes were compared to FAO/WHO reference values for lactating women and the percentages of recommended intake met by the mothers were estimated (Black, 2008; Institute of Medicine, IOM, 2001; FAO and WHO, 2002; Anthropometric Indicators Measurement Guide, 2001). Weights of the lactating women were measured to the nearest 0.1 kg on a battery powered digital scale (Seca 770, Hanover Germany) and heights were measured to the nearest 0.1 cm using a wooden height-measuring board with a sliding head bar or microtoise tape following standard anthropometric techniques based on USA anthropometric indicators measurement guide. Mid upper arm circumference (MUAC) was also measured using a Non stretchable MUAC measuring tape and Lange, harpenden or holtain calliper respectively. For weight and height measurements, study subjects were removed their shoes, remove their jackets and dress light clothing. Triplicate measurements of weight, height, and mid upper arm circumference; and skin fold measurement were taken at the same day from each study subject using calibrated equipment’s and standardized techniques (WHO and UNICEF, 2009). Body mass index (BMI) of the study subjects were calculated by dividing the weight in kilogram to the height in meter squared (kg/m2). The percentage body fat was determined by the second methods of Seri equation through estimation of total body water volume of lean tissue and body fluid (Black, 2008). Thus, the total body water was calculated by using proceeded equation based on maternal height and body weight [that is total body water = -2.097 + [0.1069 × height (cm)] + [0.2466 × weight (kg)]. The FFM was calculated as Total Body Water (TBW) / 0.73 with the assumption of 73% constant body water content. Maternal % FFM was calculated from body weight, thus % FFM = [(FFM / body weight (kg)) x 100] and finally % BF was calculated by subtracting % FFM from 100%. Thus, % BF = 100% - %FFM.
Data analysis
Statistical analysis was carried out using SPSS version 20.0. Logistic regression was used to determine the socio-economic, demographic and maternal factors affecting the nutritional status of the women. Average nutrient intakes were compared to FAO/WHO reference values for lactating women and the percentages of recommended intake met by the mothers was estimated. P-values less than 0.05 were considered as significant. In addition, chi-square test and independent sampled t-test were used to compare lactating mothers of urban and rural areas.
RESULTS
A total of 484 lactating mothers aged 15-49 years were interviewed, with a response rate of 100%. The study participants included 242 lactating mothers from rural and 242 from urban area.
Socio-demographic characteristics of the study participants
The age distribution of urban and rural residents showed a similar pattern, with mean age of 26.60± 3.98 and 27.38± 4.79 years, respectively. Majority of the study subjects were Muslim, constituting 99 (40.9%) and 209 (86.4%) in urban and rural areas, respectively. Most of the lactating mother (52.9% in Urban and 70.6% in Rural) had no education, while more than one fourth of others (31.8 and 25.2%) had completed primary education. The rest (15.3 and 4.1%) had secondary and higher education, respectively. Lactating mothers who engaged in agricultural activity were 14.5% of the sample from urban and 65.3% from Rural. The two groups had statistical significant differences in majority of socio-demographic characteristics, such as: religion, educational status, occupation, family size and length of marriage, whereas, on the rest variables (that is age, household head, marital status), both groups had comparable figure statistically (Table 1).
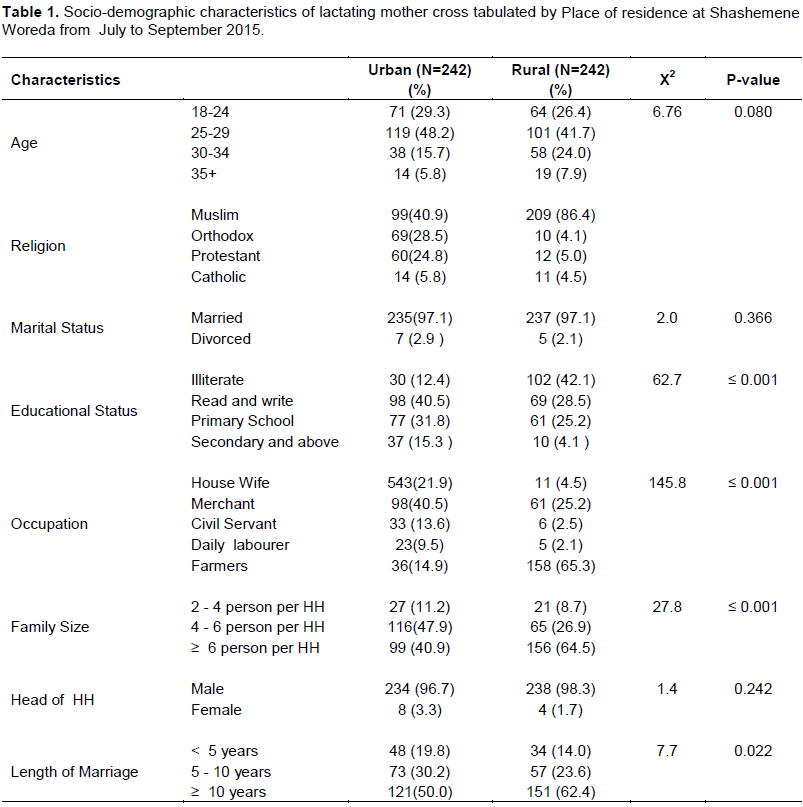
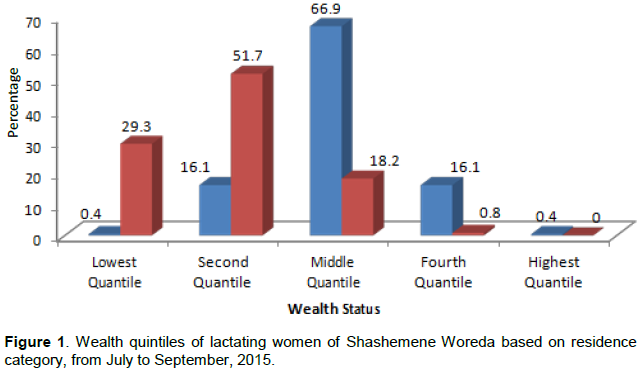
More than half (66.9% in Urban and 51.7% in Rural) of lactating mother were in the middle wealth quintile and second wealth quintile category, respectively. The statistical analysis of wealth quintile’s had shown highly significant difference between urban and rural study subjects (X2 = 223.3, p-value ≤0.001) (Figure 1).
Anthropometric characteristics of the study participants
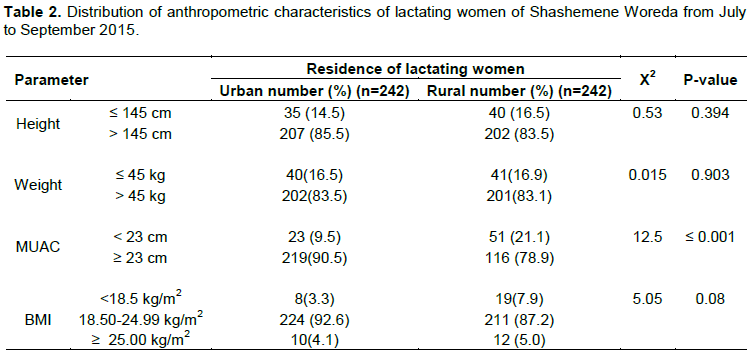
The prevalence of acute malnutrition as measured by MUAC of less than 23 cm was two times higher in rural 51(21.1%) than that of urban 23 (9.5%). On this variable, highly statistical significant difference was revealed between urban and rural (X2 = 12.5, p-value ≤ 0.001). On the other hand, the urban and rural mothers were comparable in anthropometric indices of height, weight, and BMI (p-value > 0.05) (Table 2).
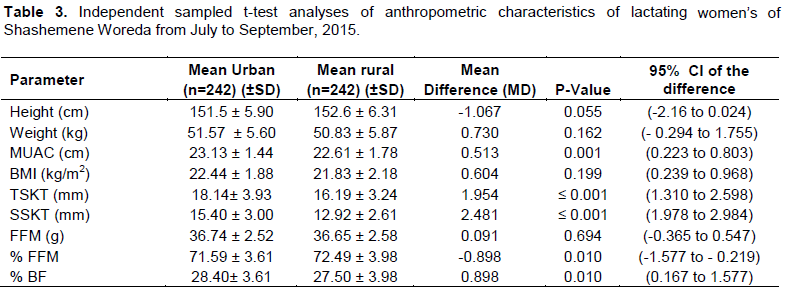
The independent t-test analysis of mean difference of MUAC, TSKT, SSKT, % BF and % FFM of study participants were revealed significance differences between urban and rural residence with p- value of < 0.05. On the other hand, urban and rural mothers were comparable on fat free mass (FFM) (Table 3).
Dietary intake and feeding practices of the study participants
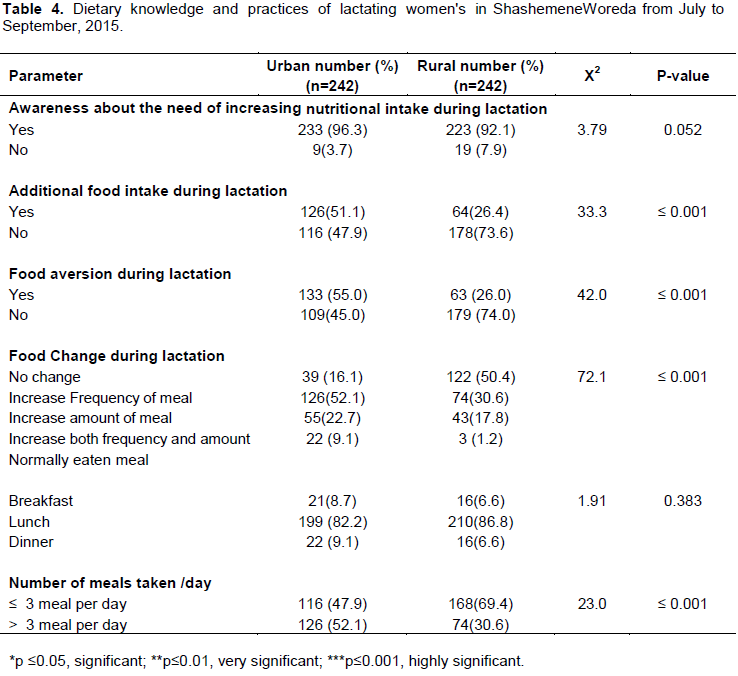
Lactating mothers were statistically comparable in level of awareness about the need for increased nutritional intake during lactation period (X2=3.78, P=0.052). The practices of additional food intake during lactation of urban lactating women (51.1%) were about twice of the practice of rural (26.4%) lactating women (P ≤ 0.001). In addition, the two groups had statistically significant differences on other feeding practice parameters such as food aversion, food change and frequency of daily meal intake during lactation (Table 4).
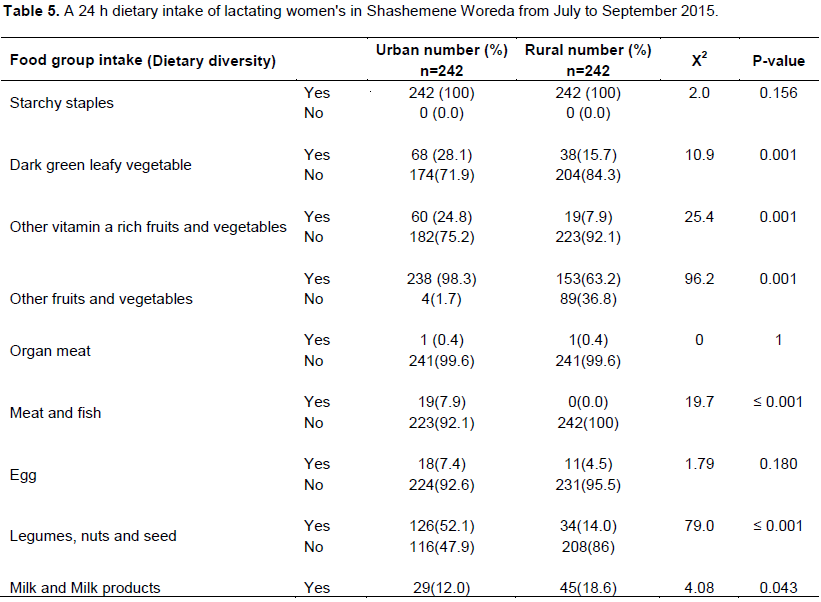
Starchy staples, fruits and vegetables are the main diets consumed both by urban and rural lactating mothers with exception of legumes which were more consumed in urban. On the other hand, only few urban and rural study participants consumed animal based food product, such as milk and milk products. Dark green leafy vegetable, other vitamin A rich fruits and vegetables, other fruit and vegetables, meat and fish, and legumes, nuts and seeds were consumed significantly in higher amount by urban lactating women than that of rural lactating mother (P < 0.05) (Table 5).
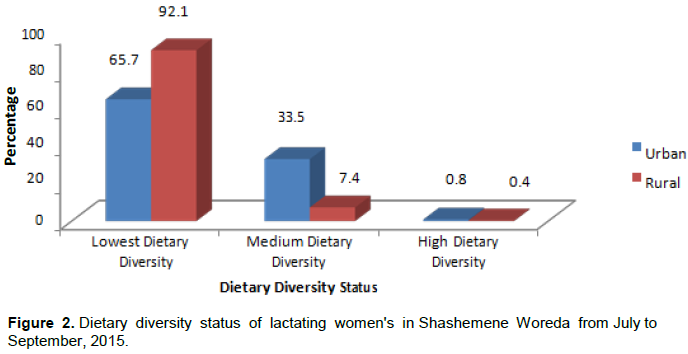
Dietary diversity status of study participants
Majority of the study participants of both groups had low dietary diversity. The median dietary diversity score of both urban and rural groups was 3, which is lower than the food diversity scores FAO recommended for lactating women,that is 9 food groups (FAO/WHO/UNU, 2004). The difference between urban and rural study subjects on dietary diversity was shown highly statistically significant difference (X2 = 50.8, p-value ≤ 0.001) (Figure 2).
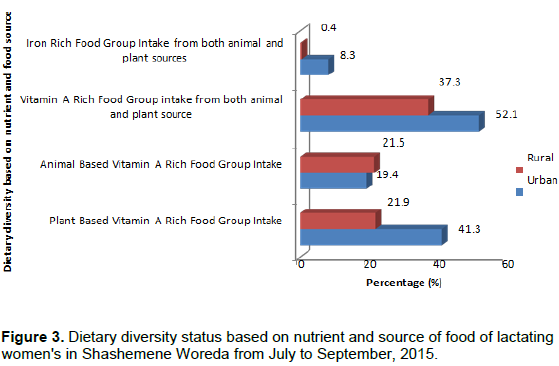
The urban and rural lactating mothers were comparable in consumptions of animal based vitamin A rich foods (X2 = 0.31, P-value = 0.573). On the other hand, urban and rural groups were significantly different on consumptions of both animal and plant sources of vitamin A food groups (X2=10.8, p-value= 0.001), plant based Vitamin A rich foods (X2=21.00, P-value ≤ 0.001), and both animal and plant sources of iron foods (X2 =17.90, P-value ≤ 0.001) (Figure 3).
Comparison of the mean energy and other selected nutrients intake of the study participants
This study showed that urban and rural lactating mothers were significantly different in the mean intake of carbohydrate [mean difference (MD) = -118.9 gm, P-value = 0.003] and fat [mean difference (MD) = 76.4 g, p-value ≤ 0.001]. Similarly, the mean intake of vitamin C in urban areas was very significantly different as compared to rural (MD = -55.12 mg, p-value = 0.016). In addition, the mean calcium intake of urban and rural was significantly different (MD=292.8 mg, p-value = 0.033).
Maternal health characteristics of the study participants
More than half of the study participants (69.4% in urban and 64.9% in rural) received antenatal care (ANC) service at least four times for the last pregnancy as WHO recommended with slight difference based on residence, but only small number of lactating women (11.1% in urban and 17.8% in rural) were received antenatal care (ANC) follow-up at most less than 2 times in the last pregnancy. Majority of lactating women’s (71.1% in urban and 80.6% in rural) had greater than or equal to 3 previous pregnancies. The two groups had statistically significant difference on number of children and age of breast feeding child (p-value Ë‚ 0.05), but both groups were comparable to exclusive breast feeding practice and age difference between the last two children (P – value >0.05).
Ethical approval and consent to participate
Ethical clearance was obtained from the Review Board of the College of Medicine and Health Sciences at Hawassa University; Permissions to undertake the study were also obtained from relevant authority of the woreda and the study subjects that were involved. The nature of the study was explained to the study participants about the research objective and informed oral consent was obtained from the respondents prior to data collection. In addition, confidentiality of all information's was ensured. No resistance was made if a woman wants to withdraw from the research at any time.
DISCUSSION
The prevalence of under-nutrition of rural participants was higher than urban areas of in the study area. In addition, the mean TSKT, SSKT, and % BF of urban participants were better than that of rural. These variables had statistically significant (p-value˂0.05) discrepancies between urban and rural. This might be due to access to diversified food group at market area, maternal preparedness prior and during pregnancy, access to nutrition information regarding intergenerational effect of nutrition inadequacy and prior pregnancy weight and fat store; whereas the prevalence of underweight, stunting, and overweight of urban and rural lactating mothers were not statistically different (p- value > 0.05).
This might be related to Socio cultural dietary habit, low nutrition education at facility, family and community level and also weak AMIYCN intervention in the area.
In this study, the prevalence of under-nutrition (MUAC < 23 cm) among lactating mother of both urban and rural areas was 15.3%. However, the prevalence of under- nutrition among women in rural areas was twice as high as that of those who live in urban (i.e. 9.5% vs. 21.1% in urban and rural areas, respectively). This figure was higher than that of the study findings of South Eastern Zone of Tigre, Ethiopia (Haileslassie et al., 2013) and Legos, Nigeria (WHO and UNICEF, 2009). On the other hand, the finding was lower than the study finding of (Berihun et al., 2017; Abeya et al., 2018; Temesgen et al., 2015). The variation might be related to limited interventions on maintenance of maternal health/ nutrition and women empowerment by government / NGO, cultural difference in feeding practice during pregnancy and lactation, and using high cut-off point (MUAC < 23 cm) as compared to the previous studies used.
The urban and rural lactating mothers were significantly different in their mean. This finding was lower than study done in bale Ginnir Woreda. The mean (± SD) of triceps skin fold thickness (TSkT) of urban study participants higher than rural residence. This is in line with other studies (Berihun et al., 2017; Abeya et al., 2018; Yasmeen, 2012). In contrary, this finding was higher than the study done by Kenya (Central Statistical Agency, CSA, 2012).
Among determinant factors of nutritional status (using MUAC), those lactating mother who breast fed to greater than or equal to 6 months aged child were 54% less likely to be malnourished than those who breast fed less than 6 months aged child. This could be revealed that those mothers who breast fed less than 6 months aged child might be more at risk of being malnutrition than nursing for greater than or equal to 6 month. The reason might be because of increased nutritional requirement and rate of consumption of the child, no additional food intake more than the usual during lactation, low pre-conception and pregnancy BMI or fat storage, limited intervention on nutrition and low women empowerment by government and NGO. In addition, those lactating women's who were living in rural area 2.54 times more likely to be malnourished than those who were living in urban. This finding was comparable with other study (Haileslassie et al., 2013).
Similarly, the prevalence of chronic energy deficiency (BMI < 18.5 kg/m2) of nursing mothers as a whole was 5.6% (3.3% vs. 7.9% in urban and rural areas, respectively). This finding was lower than that of the Oromia Region finding in 2012 CSA- EDHS report (26.9%), the study conducted in south eastern zone of Tigray (25%), the study done in India in 2012 (16.9%) and a comparative study done in Ginnir Woreda of Bale (23.9%) (Haileslassie et al., 2013; Linkage-Publication, 2001; Assefa et al., 2015; (Nakamori et al, 2009). Central Statistical Agency, CSA, 2012).
Of the 3.3% of women with a BMI ≤ 18.5 kg/m² in urban area, 37.5% were mildly malnourished, 50.0% moderately malnourished and 12.5% severely malnourished. Similarly, out of 7.9% of women whose BMI ≤ 18.5 kg/m² in rural area, 68.4% were mildly malnourished, 26.3% moderately malnourished, and 5.2% severely mal-nourished. This finding was also lower than that of the Oromia region finding in the 2012 CSA-EDHS report [i.e. 7.5% were moderately and severely malnourished/ thin (BMI < 17 kg/m2) and 19.4% were mildly malnourished (BMI = 17 - 18.5 kg/ m2) and 2008 lancet series reports (Abeya et al., 2018; Institute of Medicine, IOM, 2001). These discrepancies might indicate that there is better nutritional / maternal health intervention program given by the government / NGO in the study area.
Among determinant factors of CED, those women's who breast fed to greater than or equal 6 month aged child were 63% less likely to be malnourished than those who breast fed to less than 6 months aged child. This finding is incomparable with the study findings (Haileslassie et al., 2013).
Concerning maternal feeding practice, the general feeding practices of urban study subjects (60.1%) were better than the feeding practices of rural (39.1%). Among the parameter of feeding practices, the current finding was quite different from the recommendation of essential nutrition action (ENA) for nursing mother (i.e. increased energy intake through two additional meals a day) (FAO/WHO, 2004). As compared to previous similar studies, the additional food intake and number of meal taken per day were lower and higher than other studies (Haileslassie et al., 2013; Berihun et al., 2017; Abeya et al., 2018).
According to the recommended nutrient intake of FAO/WHO/UNU, the 24 h dietary assessment among sub-sampled (N=48) showed that the lactating women mean intake exceeded the requirements (RNI) of energy and some of macro and micro nutrients. In urban areas more than 50% of the study participants were met only the recommended nutrient intake of energy, carbohydrate, protein and thiamine, but the calcium, vitamin C and zinc intakes were met by small number of the participants. Similarly, in rural areas more than 50% of the study subjects were met only the RNI of carbohydrate, vitamin C and thiamine, but energy, protein, calcium and zinc intakes were met by small number of the study subjects.
On the other hand, the mean intake of fat, zinc and riboflavin were not met the recommended nutrient intake (RNI) in both urban and rural areas and also the mean calcium intake was below the level of RNI in rural study subjects (FAO/WHO/UNU, 2004). This might be related to lower intake of animal source foods that are highly bio-available than that of plant foods and also significant level of phytate from starchy staple foods and legumes consumption that reduce the absorption/ bioavailability of zinc and calcium. This finding is in agreement with other studies (Berihun et al., 2017; Temesgen et al., 2015; (Nakamori et al, 2009).
The mean intake of carbohydrate and fat in urban study subjects had very significant difference as compared to mean intake of rural participants, p ≤ 0.01.
Similarly, mean intake of vitamin C and calcium of urban study subject had significant difference as compared to rural study participants with p ≤ 0.05.
CONCLUSION
The prevalence of under-nutrition in rural areas (21.1%) was two times higher than that of urban (9.5%). The proportions of stunting and underweight were also high in both urban and rural without statistical significant difference. The prevalence of chronic energy deficiency in rural areas was also two times higher than urban areas. Among the factor affecting nutritional status, residence and age of breast feeding child were the predictor of acute under-nutrition. On the other hand, only age of breast feeding child was the determinant factors of CED by BMI. The median dietary diversity statuses of both study subjects were lower than half of FAO recommendation. Mean intake of some macro and micro nutrients of both groups were also lower than RNI of FAO; such as, mean intake of fat, iron, zinc, and riboflavin in both residences were not met the requirement. In addition, the major source of energy need to meet the RNI was much of plant based food than animal based food, since only 10% of the women were taken animal based food in both residences. Strengthening maternal health service integrating with nutrition intervention program like CBN, multiple micronutrient supple-mentations for adolescent women, pregnant and lactating women and engaging partners who are working in these areas for improving pre and post pregnancy BMI was recommended. Further interventional research was recommended.
CONFLICT OF INTERESTS
The authors have not declared any conflict of interests.
ACKNOWLEDGEMENTS
The authors like to acknowledge the School of Nutrition, Food Science and Technology of Hawassa University and Micronutrient Initiative project for funding the research project and also extend their special thanks to Oromia Regional State Health Bureau, West Arsi zone Health Department, Shashemene Town Health office, Shashemene Woreda health office and the people of the study area for their cooperation and unreserved support in this study. Finally, we would like to thank the data collectors and study participants who devoted their time to participate in this study. The study was funded by School of Nutrition, Food Science and Technology of Hawassa University and Micronutrient Initiative project.
REFERENCES
|
Abeya SG, Biru KM, Jima A, Factors associated with underweight among lactating mothers in Adama district, Oromia Region, Journal of Orthopaedic Research (2018):1-101 |
|
|
Amare B, Beyene M, Feleke M, Bereket F, Mengesha A, Andargachew M, Afework K (2012). Nutritional status and dietary intake of urban residents in Gondar, Northwest Ethiopia. BMC Public Health 12:752 |
|
|
Anthropometric Indicators (2001). Measurement Guide. Washington DC: Food and Nutrition Technical Assistance Project, Academy for Educational Development, 2001. |
|
|
Assefa H, Belachew T, Negash L (2015). Socio-demographic factors associated with underweight and stunting among adolescents in Ethiopia. Pan African Medical Journal 20:252. |
|
|
Berihun S, Kassa GM, Teshome M (2017). Factors associated with underweight among lactating women in Womberma woreda, Northwest Ethiopia; a cross-sectional study. BMC Nutrition 3(1):46. |
|
|
Bitew FH, Daniel ST (2010). Undernutrition among Women in Ethiopia:Rural- Urban Disparity. DHS Working Paper No 77. Calverton, Maryland, USA: ICF Macro: United States Agency for International Development (USAID). |
|
|
Central Statistical Agency (CSA) (2012). Ethiopian Demographic and Health Survey 2011. Addis Ababa, Ethiopia and Calverton, Maryland, USA: Central Statistical Agency and ICF International. |
|
|
Food and Agriculture Organization (FAO) (2006). Guidelines for Measuring Household and Individual Dietary Diversity, |
|
|
FAO and WHO (2002). Human and mineral requirements: Report of a Joint FAO/ WHO Expert Consultation; FAO, Rome pp. 251-270. |
|
|
FAO/WHO (2004). Human Energy Requirements: FAO Food and Nutrition Technical Report Series a Rome: United Nations University, World Health Organization, Food and Agriculture Organization of the United Nations. |
|
|
FAO/WHO/UNU. (2001). Food Energy Requirement: Report of a Joint FAO/WHO/UNU Expert Consultation Rome pp. 17-24. |
|
|
Gibson RS (2005). Principles of nutritional assessment. Second edition, 233-250. University of Otago, Dunedin, New Zealand. |
|
|
Haileslassie KA, Mulugeta M (2013). Girma Feeding practices, nutritional status and associated factors of lactating women in Samre Woreda, South Eastern Zone of Tigray, Ethiopia. Nutrition Journal 12(28):1475-2891. |
|
|
Institute of Medicine (IOM) (2001). Dietary Re ference intakes (DRI) for Vitamin A, Vitamin K, Arsenic, Boron, Chromium, Copper, Iodine, Iron, Manganese, Molybdenum, Nickel, Silicon, Vanadium, and Zinc. |
|
|
Kawatra A, Sehgal S (1998). Nutrient Intake of Lactating Mothers from Rural and Urban Areas. Indian Journal of Social Research 39(2):91-99. |
|
|
Khan YM, Khan A (2012). A Study on factors influencing the Nutritional Status of Lactating Women in Jammu, Kashmir and Ladakh Regions. 1(4):2278-7763. |
|
|
Linkage-Publication (2001). Essential Health Sector Actions to Improve Maternal Nutrition in Africa. s.l.: USAID Regional Economic Development Support Office for East and Southern Africa:www.linkagesproject.org and the Regional Centre for Quality of Health Care at www.RCQHC.org. pp. 3-7. |
|
|
Nakamori M, Ninh NX Isomura H (2009). Nutritional status of lactating mothers and their breast milk concentration of iron, zinc and copper in rural Vietnam. 55(4):338-45 . |
|
|
Robert EB Lindsay HA, Zulfiqar AB, Laura EC, Mercedes de O, Majid E, Colin M, Juan R (2008). Maternal and Child Under nutrition: global and regional exposures and health consequences; Lancet 371:243-260. www.thelancet.com, 2008. |
|
|
Temesgen DH, Habtamu FG, Dessalegn W, Dunkana NK (2015). Nutritional Status and Associated Factors among Lactating Mothers in Nekemte Referral Hospital and Health Centers, Ethiopia. Food Science and Quality Management 35:64-72 |
|
|
Ukegbu PO (2014). A Study of the Nutritional Status and Dietary Intake of Lactating Women in Umuahia, Nigeria. American Journal of Health Research 2(1):20-26. doi: 10.11648/j.ajhr.20140201.14 |
|
|
WHO and UNICEF (2009). WHO child growth standards and the identification of severe acute malnutrition in infants and children: A Joint Statement by the World Health Organization and the United Nations Children's Fund. Geneva: WHO and UNICEF, 2009. |
|
Copyright © 2024 Author(s) retain the copyright of this article.
This article is published under the terms of the Creative Commons Attribution License 4.0


