International Journal of
Physical Sciences

  • Abbreviation: Int. J. Phys. Sci.
  • Language: English
  • ISSN: 1992-1950
  • DOI: 10.5897/IJPS
  • Start Year: 2006
  • Published Articles: 2572

Full Length Research Paper

Estimation of heavy metals contamination and silicate mineral distributions in suspended sediments of Subansiri River

B. J. Saikia
  • B. J. Saikia
  • Department of Physics, Anandraram Dhekial Phookan College, Nagaon 782 002, India.
  • Google Scholar
S. R. Goswami
  • S. R. Goswami
  • Department of Physics, Assam Down Town University, Guwahati 781 026, India.
  • Google Scholar
R. R. Borah
  • R. R. Borah
  • Department of Physics, Nowgong College, Nagaon 782 001, India
  • Google Scholar


  •  Received: 31 August 2014
  •  Accepted: 21 October 2014
  •  Published: 16 November 2014

 ABSTRACT

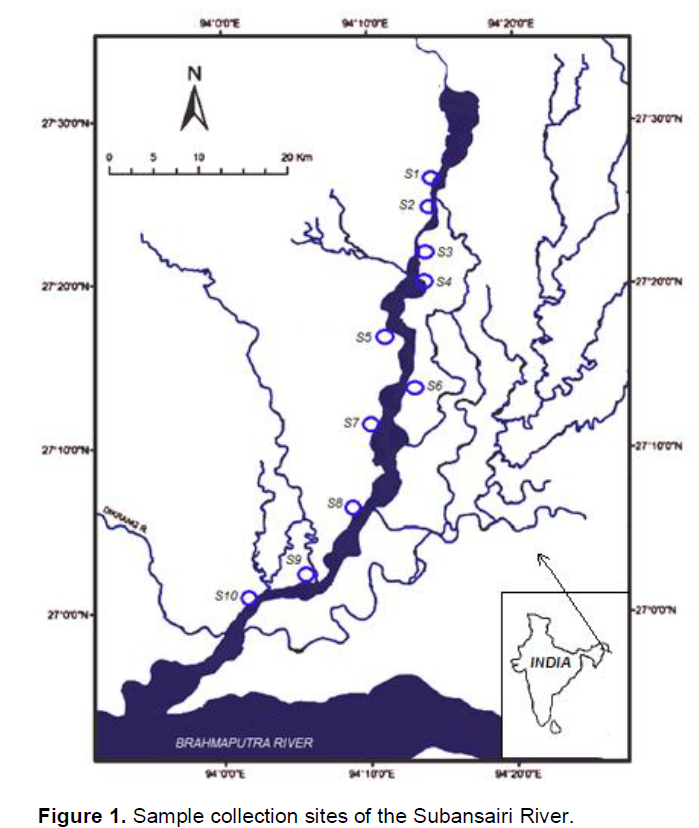
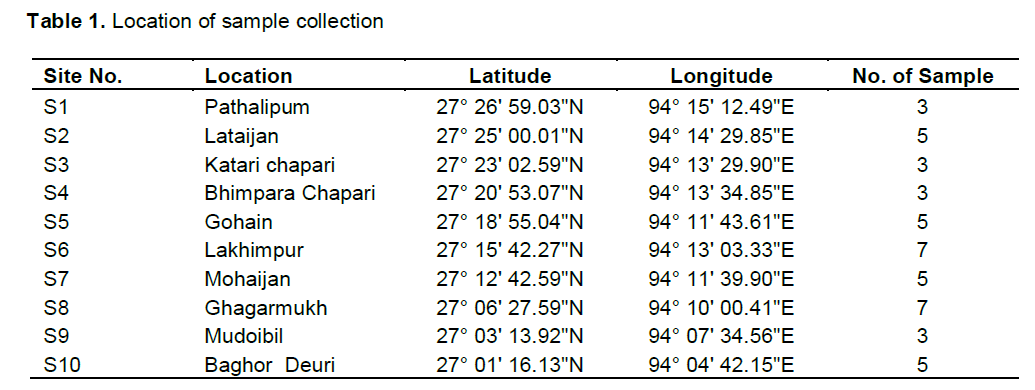
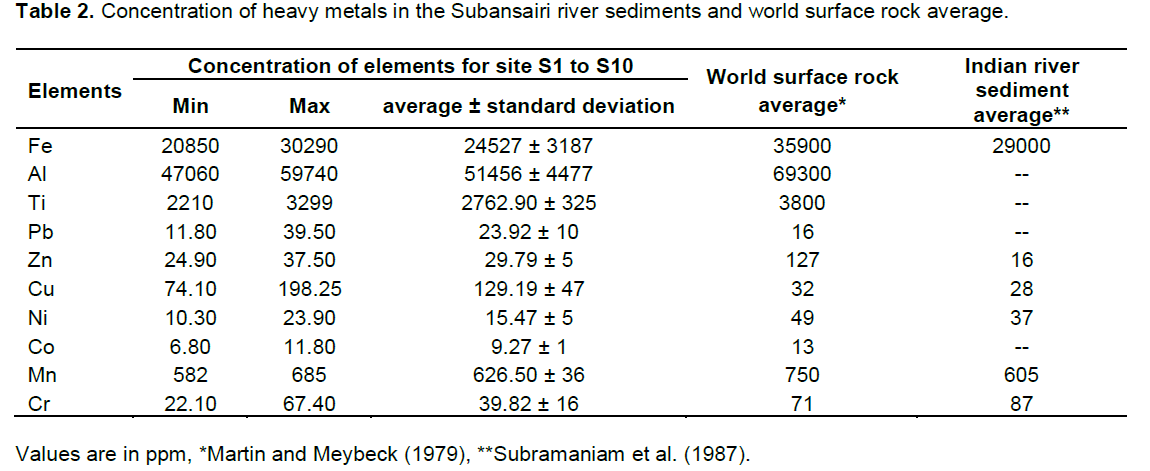
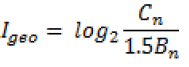
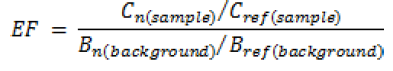
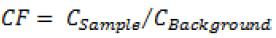
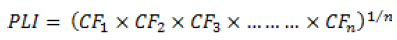
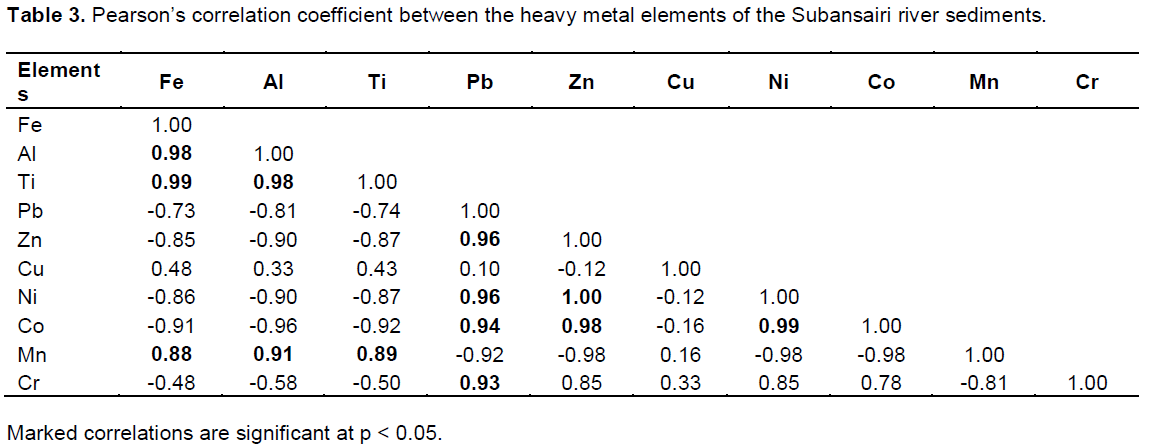
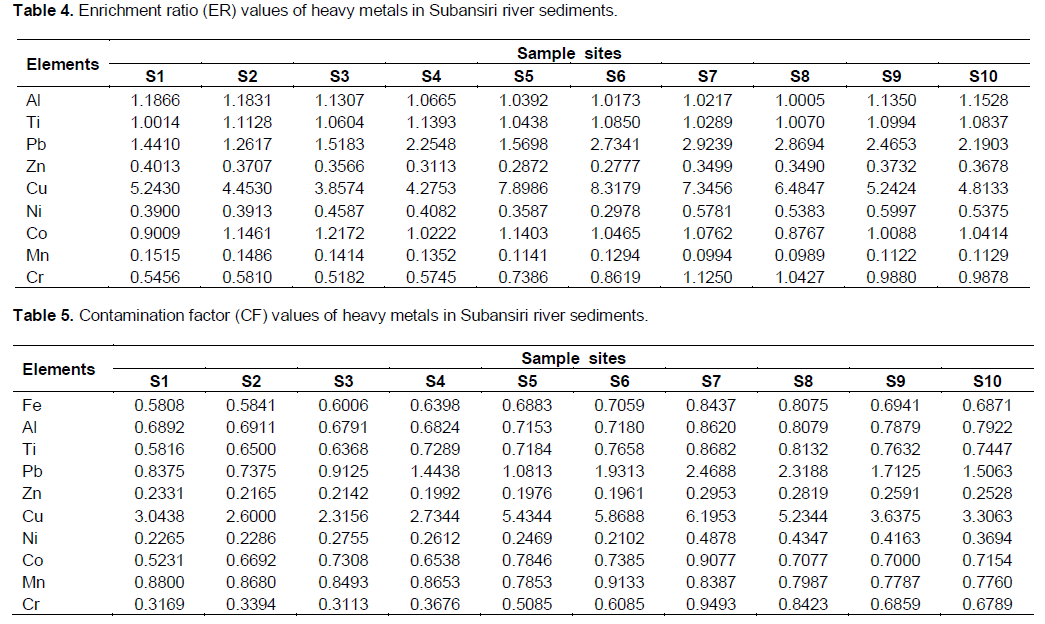
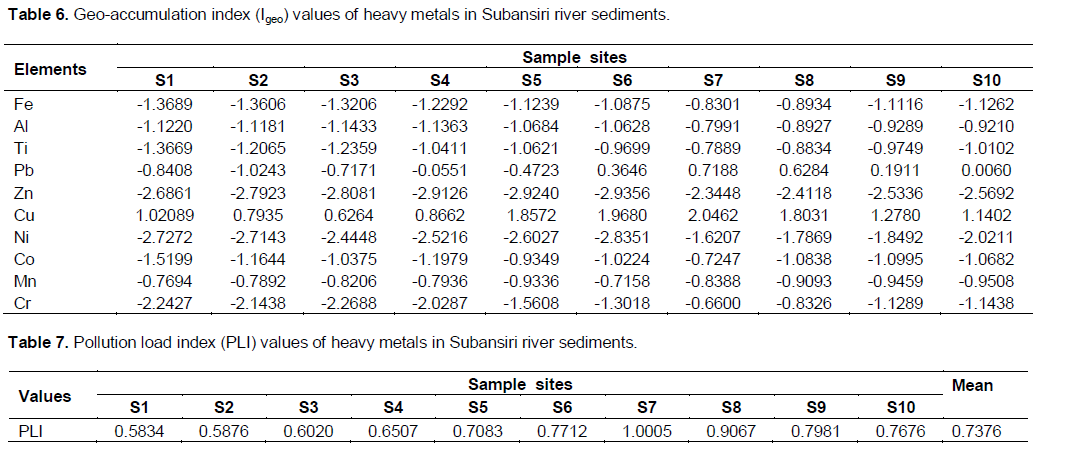
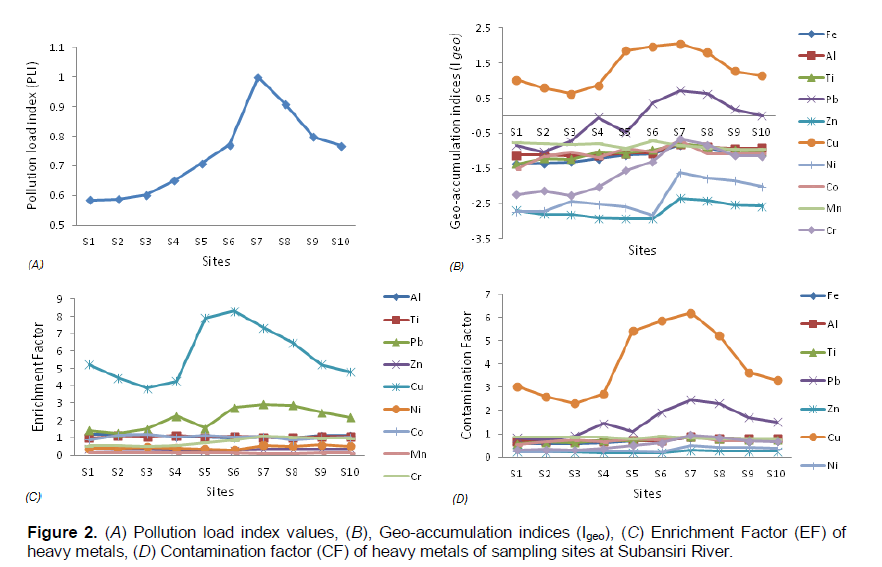
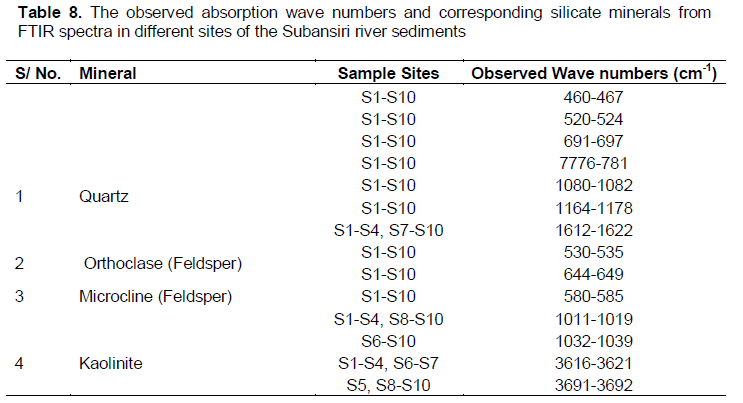
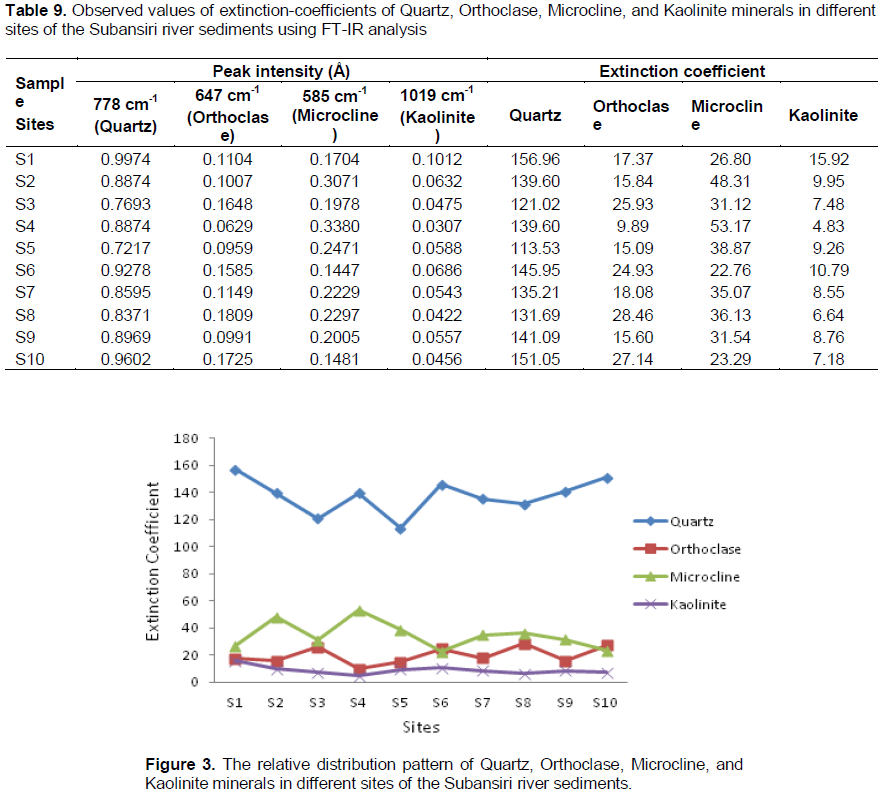
Suspended sediments samples were collected from ten different locations through the Subansiri River to assess heavy metals contamination such as Fe, Al, Ti, Pb, Zn, Cu, Ni, Co, Mn and Cr. The enrichment factor (EF), contamination factor (CF), geo-accumulation index (Igeo) and pollution load index (PLI) were investigated for evaluate metal contamination in the sediments. The relative distribution of major minerals such as quartz, feldspar (orthoclase and microcline) and kaolinite are determined by calculating extinction co-efficient. The mean concentration exhibits positive correlations among Fe, Al, Ti, Mn, Zn, Pb, Ni, and Co. The relative distributions of the contamination are: Al > Ti > Fe > Mn > Cu > Cr > Zn > Pb > Ni > Co. The investigating factors suggest the significant contamination for Subansiri river sediments are Cu and Pb. The mean concentrations of heavy metals in the sediments were found to be below the geochemical background level of world surface rock average. The elemental correlation is indicative to the metamorphosed pyrophanite (MnTiO3) deposition. The infrared analysis indicates presence of micro-crystalline quartz particles and weathered metamorphous silicate minerals.


Key words: Heavy metals, suspended sediments, pollution.


 INTRODUCTION

Sediments are detrital products of rocks and bear the mineralogical properties of the original rock formation. Geochemical studies of sediments are helpful in understanding the different sediment sources, element distribution pattern and evaluating the environmental conditions existing in an area. The mineralogical properties of sediments reflect the geological history of transport and sorting process. The sediments have been contaminated   by    heavy    metals    when    rocks    are disintegrated through natural and anthropogenic process. The accumulation and distribution of heavy metals are the most common environmental pollutants, and their occurrence in waters and biota indicate the presence of natural or anthropogenic sources (Cataldo et al., 2001; Hobbelen et al., 2004; Koukal et al., 2004; Okafor and Opuene, 2007; Mohiuddin et al., 2010). River sediments act as both source and sink for heavy metals. Many heavy metals such as Fe, Co, Cr, Mn, Ni, Zn, Cu, and  Se are essential elements for normal growth of plants and living organisms. However, at high concentrations of these metals become toxic. The metals, such as Pb or Cr, may be tolerated by the ecosystem in low concentration, but become harmful in higher concentrations (Alloway and Ayres, 1997; Nriagu, 1988). Recently deposited trace elements in bed sediments can provide information on transport processes and sources. As deposition occurs over time that is, the deep sediments become a historical record of the temporal trends of chemicals in the environment. However, studies of river sediments especially big rivers and sedimentary rock geochemistry have made important contributions all over the world to interpret tectonic settings and estimates of average upper crustal composition.
 
Chemical weathering of rocks is one of the major processes which modify the Earth's surface. The heavy metals contaminations in river sediments has been studied by various authors in many rivers (Priju and Narayana, 2007; Nabi Bidhendi et al., 2007; Dixit and Tiwari, 2008; Mumba et al., 2008; Kashulin et al., 2008; Mensi et al., 2008; Akoto et al., 2008; Venugopal et al., 2009; Biati et al., 2010; Nouri et al., 2010; Buccolieri et al., 2006; Acevedo-Figueroa, 2006; Karbassi et al., 2007; Cuculic et al., 2009). The focus on mineralogical, geochemical and geophysical studies and chemical composition of sediments of many Indian rivers were done by Borole et al. (1982); Subramanian et al. (1985, 1987); Seralathan (1987); Ramesh et al. (1990); Chakrapani and Subramanian (1990); Singh et al. (1997); Kotoky et al. (1997); Singh (1999); Subramanian (1988); Dekov (1998); and Braun et al. (2009).
 
The variations in bulk rock composition or weatherable rocks can generate significant differences in dissolved chemical components. The dissolved chemical load and sediment flux of Brahmaputra river has significantly higher rates of physical and chemical weathering than other large Himalayan catchments (Sarin et al., 1989; Harris et al., 1998; Galy and France-Lanord, 1999; Galy and France-Lanord, 2001; Dalai et al., 2002; Singh and France-Lanord, 2002; Singh et al., 2005). The estimation of silicate distribution in sediments is important because the total CO2 consumption by silicate weathering can be approximated by the total molar charge equivalents of all cations generated by silicate weathering. In many weathering environment, the chemical weathering of silicate minerals results in the formation of secondary clays.
 
Present study is confined in the river Subansiri, one of the most important sediment carrying tributary of Brahmaputra river. Subansiri river basin is influenced by two main tectonic features: main central thrust (MCT) and the main boundary thrust (MBT). The rock structure is fine grained to pebbly, weathered, highly jointed to massive sandstone, medium to coarse grained, soft weathered to shared, massive to moderately jointed sandstone with stringers of  carbonaceous  material.  The overall rock composition is poor which causes more erosion in the basin. As river sediments act as both source and sink for heavy metals therefore contaminants may eventually pass through the food chain and result in a wide range of adverse environmental effects. This spectroscopic study is conducted to evaluate the concentration of heavy metals (Fe, Al, Ti, Pb, Zn, Cu, Ni, Co, Mn and Cr) due to the natural and anthropogenic activities of the river Subansiri, which helps to assess the ecotoxic potential of the river sediments.


 MATERIALS AND METHODS

Sample collection and preparation
 
The suspended sediment samples were collected from ten locations of the Subansairi river (Figure 1). Suspended samples were collected at a depth of 2 to 3 ft. from the surface of each sampling locations.  To eliminate the possibility of bank materials of the local origin, special care is taken on the sample collection by collecting them as far away from the banks as possible. The precise location (longitude and latitude) of the sampling sites has been determined using handheld Global Positioning System (GPS) (Table 1).
 
The suspended particles were separated by gravimetric method using Whatman filter paper (40 m). The wet samples were allowed to dry and the moisture contents were removed by heating the samples at temperature 110°C for 10 min. The heavy metals (Al, Co, Cr, Cu,  Fe, Mn, Ni, Pb, Ti and Zn) in sediment samples were determined using a  Philips MagiX PRO wavelength dispersive X-ray spectrometer with a rhodium anode X-ray tube was used, which may operated at up to 60 kV and current up to 125 mA, at a maximum power level of 4 kW.  The precision and accuracy of the data is ±2%, and average values of three replicates were taken for each determination. The powdered samples (0⋅25 g) were put into platinum crucibles and HNO3 (conc.), HCl, H2O2 and HF were added in the proportion of 5: 2: 1: 2 ml. Crucibles were heated on hot plate and the solution evaporated to near dryness. After that, 2 ml HF were added few times until precipitate of SiO2 was eliminated as SiF4 vapours. After cooling down to room temperature, a mixture of HCl (conc.) and redistilled water at a ratio 2: 5 ml was added, the solution transferred in 50 ml volumetric flasks and filled up with redistilled water. Then 0⋅5 g of powdered sample was put in a glass beaker and a mixture of redistilled water and HCl (conc.) in a ratio 15: 20 ml was added and the solution evaporated to near dryness. The residue was dissolved with 10 ml 1% tin, and SiO2 precipitated and coagulated. Precipitate was filtered and washed with HCl solution in a ratio of 5 : 95 ml. Filter paper and residue were transferred into a platinum crucible and heated at 1000°C for 10 min. Crucible was weighed and the content of SiO2 calculated. The powdered sample was homogenized in spectrophotometric grade KBr (1: 20) in an agate mortar and was pressed with 3 mm pellets using a hand press. The infrared spectrum was acquired using Perkin-Elmer system 2000 FTIR spectrophotometer with helium–neon laser as the source reference, at a resolution of 4 cm–1. The spectra were taken in transmission mode in the region 400 to 4000 cm–1. The room temperature was 30°C during the experiment.
 
Extinction coefficient
 
To estimate the relative distribution of silicate minerals among the studied samples, the extinction coefficient for the characteristic peaks has been calculated. The extinction coefficient (K)  has  been calculated using the relation (Saikia et al., 2008):


Where, A is the area of the pellet and m the mass of the sample.
 
The optical density (D) is defined as the logarithm to the base 10 of the reciprocal of the transmitted radiant power (T).
 
 
Index of geo-accumulation
 
The   index   of   geo-accumulation   (Igeo)   is   used   to  assess  the accumulation of contamination in sediments (Muller, 1969). The index of geo-accumulation is defined as: 
 
 
Where, Cn is the measured concentration of element and Bn is the geochemical background value. The constant 1.5 allowed to analyze the possible natural fluctuations in background data due to lithologic effect. The seven grades or classes profile of the geo-accumulation index proposed by Muller (1981) and according to this classification the value of sediment quality is considered as unpolluted (Igeo is ≤ 0 , class 0); from unpolluted to moderately polluted (Igeo is 0-1 , class 1); moderately polluted (Igeo is 1-2 , class 2); from moderately to strongly polluted (Igeo is 2-3 , class 3); Strongly polluted (Igeo is 3-4 , class 4); from strongly to extremely polluted (Igeo is 4-5 , class 5) and Extremely polluted (Igeo is >6 , class 6). The total geo-accumulation index (Itot) is defined as the sum of Igeo for all trace elements obtain from the site (Ya et al., 2007).
 
 
Enrichment factor
 
The contamination or enrichment factor (EF) is based on the standardization of the analysed element against a reference element. It is used to assess the level of contamination and the possible anthropogenic impact in sediments. The element which has low occurrence variability is considered as a reference element. Generally geochemical normalization of the heavy metals data to a conservative element, such as Al, Si and Fe is employed. In this study Fe is considered as reference element of normalization because natural sources (1.5%) vastly dominate its input (Tippie, 1984). The EF is defined as follows:
 
 
Where, Cn(sample) and Cref(sample) are the content of the examined and reference element in the examined environment respectively;  Bn(background) and Bref(background)  are the content of examined and reference element in the reference environment respectively.
 
Due to the unavailability of metal background values for the study area, we used the values from world surface rocks (Martin and Meybeck, 1979) for  analysis.  We  used  categories  of  enrichment factor described by Mmolawa et al. (2011) that is, deficiency to minimal enrichment (EF < 2); moderate enrichment (2 ≤ EF < 5); significant enrichment (5 ≤ EF < 20); very high enrichment (20 ≤ EF < 40) and extremely high enrichment (EF ≥ 40) for our investigation.
 
 
Contamination factor (CF)
 
The level of contamination of sediment by metal is expressed in terms of CF calculated as: 
Where, CSample is the concentration of the given metal in river sediment, and CBackground is value of the metal equals to the world surface rock average given by Martin and Meybeck (1979). The CF and level of contamination proposed by Hakanson (1980) is used (Table 4) for describing the contamination level of this study. According to Hakanson the classifications are: low contamination (CF < 1); moderate contamination (1 ≤ CF < 3); considerable contamination (3 ≤ CF < 6) and very high contamination (CF > 6).
 
Pollution load index (PLI)
 
Pollution load index (PLI) for a particular site can be estimated using the method proposed by Tomilson et al. (1980).
Where, CF is the contamination factor and n is the number of metals.


 RESULTS AND DISCUSSION

Metal contaminations 
 
The concentration of heavy metals in the sediment samples of Subansairi river is presented in the Table 2. The enrichment factor (EF), contamination factor (CF), geo-accumulation index (Igeo), and pollution load index (PLI) of the studied samples were depicted in Tables 4, 5, 6, and 7  respectively.  The  world  surface  rock  average prescribed by Martin and Meybeck (1979) is used as background value for investigation.
 
 
The concentration of Pb and Cu varied from 11.8 to 39.5 ppm with mean value 23.92 ppm, and 74.1 to 198.25 ppm with mean value 129.19 ppm respectively. This value is more than the world surface rock average as background level. The elements Pb and Fe expressed a strong positive correlation with Ni, Co, Cr and Al, Ti, Mn respectively at 0.05 level. The other elements such as Al have strong positive correlation with Ti and Mn; Ti has strong positive correlation with Mn; Zn has strong positive correlation with Co and Cr; Ni has strong positive correlation with Co and Cr at this level of significance (Table 3).  The strong correlation indicates that these elements have common sources.
 
The EF values for Cu in Subansairi River sediments were ranged from 3.8574 to 8.3179. The EF values for Cu were found to be greater than 4 in most of sampling sites (Table 4), suggesting that these sites are classified as moderate enrichment for Cu. The stations S5, S6 and S7 are significant enrichment for Cu. In case of Pb, the EF values were ranged from 1.4410 to 2.9239. The sites S4 and S6-S10 are found to be moderate enrichment for Pb. The CF values for Cu in Subansairi River sediments varied from 2.6000 to 6.1953 with a mean value of 4.0370. For Pb the CF varies from 0.7375 to 2.4686 with a mean value of 1.495 (Table 5). Most sampling sites had the CF greater than 1 and less than 6 for the elements Cu and Pb. The remaining elements had the CF values less than 1. It was found that most sampling sites S4 - S10 were moderately contaminated by Pb. It was found that most sampling sites S1,S5,S6, S8,S9 and S10 face considerable contaminated by Cu except S2, S3, S4 were moderately contaminated. The site S7 has very high contamination of Cu. The Igeo values of majority elements in sampling sites were less than 0 (<0), except the elements Cu and Pb. The Igeo values of Cu and Pb in sites S2- S4 and S6-S10 were less than 1 (<1) respectively, in case of Cu the Igeo values of sampling sites S1, and  S5-S10 were greater than 1  (>1) (Table 6). According to Muller’s classification, the calculated Igeo values for Pb indicate sediment quality be considered as unpolluted to moderately polluted for S6- S10. The calculated Igeo values of Cu indicates sediment quality be considered as polluted for majority of sites as unpolluted and moderately polluted except the site S7 shows from moderately to strongly polluted.
 
The concentration of Fe in Subansairi River sediments varied from 20850 ppm at S1 to 30290 ppm at S7 with mean value 24527 ppm. The Fe mean value was less than world surface rock average as geochemical background level (Table 2). The CF values for Fe are ranged from 0.5808 at S1 to 0.8437 at S7, with a mean value of 0.6832. Because of the CF values for Fe in all sampling sites less than 1, Subansiri River Sediments face low contamination by Fe. The Igeo values for Fe at all sampling sites were negative. According to Muller’s classification, Subansiri river sediments were unpolluted by Fe.
 
Zn concentration ranged between 24.9 and 37.5 ppm with mean value 29.79 ppm. The mean value is less than the world surface rock average as a geochemical background level (Table 2). Zn expressed very strong positive correlation with Ni and strong positive correlation with Co and Cr at 0.05 level. The highest values of Zn concentration is reported at S7. The concentration of Zn at all sampling sites were found to be below the geochemical background level of world surface rock average.
 
The enrichment factor (EF) values for Zn in Subansiri River sediments ranged from 0.2777 at S6 to 0.4013 at S1. The EF values for majority of sampling sites were greater than 0.3 and less than 0.4 (Table 4), suggesting that these sites are classified as deficiency to minimal enrichment for Zn. The CF values for Zn are varied from 0.2331 at S1 and 0.2528 at S10 with mean value of 0.2346 (Table 5). All sampling sites have CF less than 1, therefore, all sampling sites were classified as low contaminated. The Igeo values for Zn in all sampling sites were less than 0 (<0) (Table 6). These negative values indicate that the Subansiri River sediments in the study area are unpolluted by Zn.
 
 
The concentration of Ni value was between 10.3 and 23.9 ppm with mean concentration 15.47 ppm. The mean value is less than the world surface rock average as background level. Ni concentrations of Subansiri River sediments vary between 10.3 ppm at S6 and 23.9 ppm at S7. The EF values for Ni are range from  0.2978  at  S6  to 0.5997 at S9 (Table 4). The EF values for all sampling sites were less than 0.6, suggesting that these sites are classified as deficiency to minimal enrichment for Ni. The CF values for Ni are ranged from 0.2102 at S6 to 0.4878 at S7, with mean value of 0.3157. These values of CF represent the sampling sites as low contaminated. The Igeo values for Ni at all sampling sites were negative. According to Muller’s classification, Subansiri River sediments were unpolluted at all sites due to Ni.
 
Co concentration ranged between 6.8 and 11.8 ppm with mean value 28.16 and 9.27 ppm. The mean value of Co concentration  is  less  than  the world surface rock average as geochemical background level. Co showed good positive correlation with Cr at 0.05 level. The EF values for Co are ranged from 0.8767 at S8 and 1.1461 at S2 (Table 4). The EF values of sampling sites suggesting that these sites are classified as deficiency to minimal enrichment for Co. All sampling sites have CF less than 1, therefore, all sampling sites were classified as low contaminated. The negative value of Igeo at all sampling sites represents Muller’s classification as unpolluted at all sites due to Co.
 
Mn concentration ranged between 582 ppm at S10 and 685 ppm at S6 with mean value 626.5 ppm. The mean value of Mn was less than world surface rock average as geochemical background level. The EF values for all sampling sites (Table 4), suggesting that these sites are classified as deficiency to minimal enrichment for Mn. The contamination factor (CF) values for Mn are varied from 0.7760 at S10 to 0.9133 at S6 (Table 5). The values of CF suggest the sampling sites were low contaminated. According to Muller’s classification, the negative Igeo values for Mn at all sampling sites represents sediments are unpolluted by Mn. 
 
 
Cr concentration varied between 22.1 ppm at S3 and 67.4 ppm at S7 with mean value 39.82 ppm. It was less than world surface rock average as geochemical background level, (Table 2). The EF values for Cr in all sampling sites are classified as deficiency to minimal enrichment for Cr. The Igeo   values   for   Cr   at  all  sampling  sites  were negative. According to Muller’s classification, Subansiri river sediments were unpolluted by Cr. The contaminations of various sampling sites were compared by determining the PLI.  PLI values of the analyzed samples ranged from 0.5834 at S1 to 1.0005 at S7 with a mean value of 0.7376 (Table 7). All sampling sites suggest has no overall pollution, whereas S7 shows signs of pollution.
 
The very strong positive correlation of Al with Fe (0.98) indicates their association with clay derived from the adjoin study sites. A very strong positive correlation of Al (0.98) and Fe (0.99) with Ti is observed, but, generally Ti shows a strong correlation with Al or Fe in the marine sediments. The manganese titanium oxide mineral Pyrophanite (MnTiO3) is usually found in metamorphosed manganese deposits. Therefore, the observed positive correlation between Ti and Mn may indicative to the presence of pyrophanite mineral deposition in the adjoin areas of the study sites.
 
 
Figure 2A is corresponding to the pollution load indices of the sampling sites. The pollution load indices provide a comparative assessment of the site quality. According to Tomlinson et al. (1980) assessment, when the value of pollution load indices is < 1 then the site has perfection but, the value > 1 would indicate deterioration of site quality. The value of pollution load indices is equal to 1 indicates that only baseline levels of pollutants are present. Among the sampling sites, in the site S7 the value of pollution load indices is found to be slightly greater than 1, which is indicative to the deterioration of sediment quality in the sites. The growth of the industries in the adjacent areas of this site cannot be ignored for it. Chakravarty and Patgiri (2009) has also reported the nature of pollution in the adjacent area of this site.  
The very strong positive correlation of Al with Fe (0.98) indicates their association with clay derived from the adjoin study sites. A very strong positive correlation of Al (0.98) and Fe (0.99) with Ti is observed, but, generally Ti shows a strong correlation with Al or Fe in the marine sediments.   The    manganese   titanium   oxide   mineral Pyrophanite (MnTiO3) is usually found in metamorphosed manganese deposits. Therefore, the observed positive correlation between Ti and Mn may indicative to the presence of pyrophanite mineral deposition in the adjoin areas of the study sites.
 
The geo-accumulation index (Igeo) is used to determine the pollution level of sediments. Figure 2B indicates that the calculated Igeo values of heavy metal Cu in the sampling sites S5- S10 have the Muller’s class 2.  The Igeo values of Pb in the sampling sites S7 and S8 indicates the Muller’s class 1, whereas the other investigated heavy metals in the sampling sites exhibit the Muller’s class 0. This indicates that Cu and Pb are responsible for pollution of the respective sites. The Pb pollution of the adjacent area of the site S7 has also reported by the previous worker Chakravarty and Patgiri (2009).  
 
Figure 2C depicts the enrichment factor of the heavy metals in the sampling sites. The significant enrichment of Al in the sites S1 and S5-S9 and a moderate enrichment of Pb in the sites S4 and S6-S10 is observed. The heavy metals in other sites have the permissible categories of enrichment values as reported in by Mmolawa et al. (2011). The contaminations of the heavy metals in the sampling sites are presented in Figure 2D. The sites S1 and S5-S10 are considerably contaminated 
 
 
by Cu and sites S4-S10 are moderately contaminated due to Pb according to the level of contamination as suggested by Hakanson (1980). The heavy metals in other sites have below contamination level. The comparison of the Indian river sediment average (Table 2), the Subansiri river is contaminated by heavy metals Zn, Cu and Mn. It is worthwhile that the value of Pb is much higher than the world surface rock average. Therefore, the Subansiri river is contaminated by Cu, Pb, Zn and Mn and the significant heavy metal pollutant of this river is Cu.
 
 
Distribution of silicate minerals
 
The observed infrared frequencies of the studied sediment samples were compared with the available literature of Gadsden (1975) and the minerals such as quartz, microcline feldspar, orthoclase feldspar, kaolinite, are identified. The observed frequencies are interpreted in Table 8. The mid infrared spectra of silicate in between the range 1200 to 400 cm–1 are generally classified into characteristic region or fingerprint region. In this characteristic region, the octahedral peak at 695 cm–1 is unique to the crystalline quartz (Saikia et al., 2008). All studied samples exhibits peaks at around 695cm-1 which indicative of the presence of micro-crystalline quartz particles. In the fingerprint region, the characteristic peaks of quartz, orthoclase, microcline and kaolinite at around 778 647, 585 and 1019 cm-1 respectively are taken for estimation of extinction coefficient.
 
The absorption peaks at 1615 to1620 cm-1 indicates the presence of quartz in river sediments are weathered from metamorphic origin (Keller and Pickett, 1949). The discussion of Ramasamy et al. (2004, 2005, 2006). also indicates to the presence of silicates at this range in  river sediments from the weathered metamorphic rocks (Ramasamy et al., 2004, 2005, 2006). The presence of absorption peaks in between 1612 to 1622 cm-1   in this study is indicative to the origin of the observed silicate minerals.
 
The calculated extinction co-efficient values of quartz are greater than other silicate minerals in all the sites. Therefore, microcrystalline quartz particles is the major constitutes in all study sites. It throws light on the nature of erosion and environmental degradation. The maximum extinction co-efficient values for quartz, orthoclase, microcline and kaolinite are 156.91, 28.451, 53.171 and 15.921 in the site no. S1, S8, S4 and S1 respectively, whereas the minimum values are 113.531, 9.891, 22.76 and 4.83 in the site no. S5, S4, S6 and S4 respectively (Table 9). This observed range of extinction coefficient values of the silicate minerals in the study sites indicates a low fluctuation of distribution. The distribution of kaolinite is very much lesser than quartz and feldspar in the study sites (Figure 3).  


 CONCLUSION

The investigation of Subansiri River sediments shows the order of the mean concentrations of tested heavy metals as: Al > Ti > Fe > Mn > Cu > Cr > Zn > Pb > Ni > Co. The correlation analysis of mean concentrations showed good to strong positive correlations among Fe, Al, Ti, Mn, Zn, Pb, Ni, and Co, suggesting that these metals have common sources. The EF, CF, geo-accumulation index (Igeo) and PLI were applied for assessment of contamination. The EF values suggest that Subansiri river sediments were moderate enriched for Cu and Pb. The CF values suggest that sample sites are moderate contaminated   by   Cu   and   some   sites    suffers    low contamination due to Pb. The Igeo values show that the sediments quality is moderately polluted for Cu and from unpolluted to moderately polluted for Pb.
 
 
PLI of all sites suggest sampling sites suggest has no overall pollution, only site S7 shows signs of pollution. The negative value of Itot indicates that the mean concentrations of heavy metals Subansiri river sediments are lower than world surface rock average.
 
It is worthwhile to mention that in the site S1 there is absence of industrial establishments, but we observed the effects of heavy metal Cu in this area. On the other hand, the heavy metals Cu, Ni, Pb and Zn have been reported by Geological Survey of India in 1974 and 1983 (GSI, 1974 and GSI, 1983) from the metamorphic belt lying in the Subansiri river catchment. Therefore, the sediment is contaminated with Cu and Pb that is due to dispersion   from   the   mineralized   zone   of  the  upper catchment area. But the effects of anthropogenic factors cannot be ignored due to the gradually developing industries and habitats (for example site S7) in the adjacent areas of the sampling locations. The very strong positive correlations of Al with Fe are indicative to their association with clay. The observed positive correlation between Ti and Mn is indicative to the presence of pyrophanite (MnTiO3) mineral from the metamorphosed manganese deposition in the adjoin areas.
 
The infrared analysis of the Subansiri River sediments indicates the presences of quartz, feldspar (orthoclase and microcline) and kaolinite as major minerals. The presence of absorption peaks in between 1612 to 1622 cm-1 in this study is indicative to the weathered metamorphic origin of the silicate minerals. All studied samples   exhibits   peaks   at   around   695 cm-1    which indicative  to   the   presence  of   micro-crystalline  quartz particles in the sediment samples. The range of extinction coefficient of the silicate minerals in the study sites has a low fluctuation of distribution. The quartz exhibits higher extinction co-efficient values than all other silicate minerals; therefore, it throws light on the nature of erosion and environmental degradation. 


 CONFLICT OF INTEREST

The authors have not declared any conflict of interest.


 ACKNOWLEDGEMENTS

Authors thank the Directors, National Geophysical Research Institute (NGRI-CSIR), Hyderabad and North East Institute of Science and Technology (NEIST-CSIR), Jorhat for their cooperation during this work. They also thank Dr. J.R. Chetia, Dibrugarh University, Dibrugarh, for his assistance in the FTIR analysis.


 REFERENCES

Acevedo-Figueroa D (2006). Trace metals in sediments of two estuarine lagoons from Puerto Rico. Environ. Poll. 141(2):336-342.
Crossref
 
Akoto O, Ephraim JH, Darko G (2008). Heavy metals pollution in surface soils in the vicinity of abundant railway servicing workshop in Kumasi, Ghana. Int. J. Environ. Res. 2(4):359-364.
 
 
Alloway BJ, Ayres DC (1997). Chemical principles of environmental pollution, second edition, Blackie Academic and Professional, Chapman and Hall, London. pp. 208-211.
 
 
Biati A, Moattar F, Karbassi AR, Hassani AH (2010). Role of saline water in removal of heavy elements from industrial wastewaters. Int. J. Environ. Res. 4(1):177-182.
 
 
Borole DV, Sarin MM, Somayajulu BLK (1982). Composition of Narmada and Tapti Estuarine particles and adjacent Arabian sea sediments. Ind. J. Mar. Sci. 11:51-62.
 
 
Braun JJ, Descloîtres M, Riotte J, Fleury S, Barbiero L, Boeglin J, Violette A, Lacarce E, Ruiz L, Sekhar M, Kumar MSM, Subramanian S, Dupré B (2009). Regolith mass balance inferred from combined mineralogical, geochemical and geophysical studies: Mule Hole gneissic watershed, South India. Geochem. Cosmochim. Acta 73(4):935-961.
Crossref
 
 
Buccolieri A, Buccolieri G, Cardellicchio N, Dell'Atti A, Di Leo A, Maci A (2006). Heavy metals in marine sediments of Taranto Gulf (Ionian Sea, Southern Italy). Marine Chem. J. 99:227–235.
Crossref
 
 
Cataldo D, Colombo JC, Boltovskoy D, Bilos C, Landoni P (2001). Environmental toxicity assessment in the Parana river delta (Argentina): simultaneous evaluation of selected pollutants and mortality rates of Corbicula Fluminea (Bivalvia) early juveniles. Environ. Poll. 112(3):379-389.
Crossref
 
 
Chakrapani GJ, Subramanian V (1990). Preliminary studies on the geochemistry of the Mahanadi river basin, India. Chem. Geol. 70:247-266.
 
 
Chakravarty M, Patgiri AD (2009). Metal pollution assessment in sediments of the Dikrong River, N.E. India. J. Hum. Ecol. 27(1):63-67.
 
 
Cuculic V, Cukrov N, Kwokal Z, Mlakar M (2009). Natural and anthropogenic sources of Hg, Cd, Pb, Cu and Zn in seawater and sediment of Mljet National Park, Croatia Estuarine. Coastal Shelf Sci. J. 81:311-320
Crossref
 
 
Dalai TK, Krishnaswami S, Sarin MM (2002). Major ion chemistry in the headwaters of the Yamuna river system: Chemical weathering, its temperature dependence and CO2 consumption in the Himalaya. Geochim. Cosmochim. Acta. 66:3397-3416.
Crossref
 
 
Dekov VM (1998). Chemical composition of sediments and suspended matter from the Cauvery and Brahmaputra rivers (India). Sci. Total Environ. 212(2-3):89-105.
Crossref
 
 
Dixit S, Tiwari S (2008). Impact assessment of heavy metal pollution of Shahpura Lake, Bhopal, India. Int. J. Environ. Res. 2(1):37-42.
 
 
Gadsden JA (1975). Infrared Spectra of Minerals and Related Inorganic compounds, Butterworths. USA. pp. 189-235.
 
 
Galy A, France-Lanord C (1999). Weathering processes in the Ganges–Brahmaputra basin and the riverine alkalinity budget. Chem. Geol. 159:31-60.
Crossref
 
 
Galy A, France-Lanord C (2001). Higher erosion rates in the Himalaya: geochemical constraints on riverine fluxes. Geology 29:23–26.
Crossref
 
 
GSI (1974). Geology and Mineral Resources of the States of India (Part IV–Arunachal Pradesh, Assam, Manipur, Mizoram, Nagaland and Tripura). Geol Sur of India Misc Pub No. 30, Kolkata: GSI.
 
 
GSI (1983). Proceedings of the symposium on geology and mineral resources of North Eastern Himalayas. Geol. Surv. India Misc Pub No. 43, Kolkata: GSI.
 
 
Hakanson L (1980). An ecological risk index for aquatic pollution control a sedimentological approaches. Water Res. 14(8):975-1001.
Crossref
 
 
Harris N, Bickle MJ, Chapman H, Fairchild I, Bunbury J (1998). The significance of Himalayan rivers for silicate weathering rates: Evidence from the Bhote Kosi tributary. Chem. Geol. 144:205–220.
Crossref
 
 
Hobbelen PHF, Koolhaas JE, van Gestel CAM (2004). Risk assessment of heavy metal pollution for detritivores in floodplain soils in the Biesbosch, The Netherlands, taking bioavailability into account. Environ. Poll. 129 (3):409-419.
Crossref
 
 
Karbassi AR, Monavari SM, Nabi Bidhendi Gh R, Nouri J, Nematpour K (2008). Metal pollution assessment of sediment and water in the Shur River. Environ. Monit. Assess. J. 147:107-116.
Crossref
 
 
Kashulin NA, Terentiev PM, Koroleva IM (2008). The status of whitefish population from Chuna Lake in the Lapland Biosphere Reserve Russia. Int. J. Environ. Res. 2(2):111-124.
 
 
Keller WD, Pickett EE (1949). Absorption of infrared radiation by powdered silica minerals. The American mineralogist. 34:855-868.
 
 
Kotoky P, Baruah J, Baruah NK, Sarma JN (1997). Geoenvironmental studies of the river Jhanji, Assam. J. Hum. Ecol. Special Issue No. 6: 55-67.
 
 
Koukal B, Dominik J, Vignati. D, Arpagaus P, Santiago S, Ouddane B, Benaabidate L (2004). Assessment of water quality and toxicity of polluted rivers Fez and Sebou in the region of Fez (Morocco). Environ. Poll. 131(1):163-172.
Crossref
 
 
Martin JM, Meybeck M (1979). Elemental mass balance of materials carried by major world rivers. Mar Chem. 7:173-206.
Crossref
 
 
Mensi Gh S, Moukha S, Creppy EE, Maaroufi K (2008). Metals accumulation in Marine Bivalves and Seawater from theLagoon of Boughrara in Tunisia (North Africa). Int. J. Environ. Res. 2(3):279-284.
 
 
Mmolawa K, Likuku A, Gaboutloeloe G (2011). Assess-ment of heavy metal pollution in soils along roadside areas in Botswana. Afr. J. Environ. Sci. Technol. 5(3):186-196.
 
 
Mohiuddin KM, Zakir HM, Otomo K, Sharmin S, Shikazono N, (2010). Geochemical distribution of trace metal pollutants in water and sediments of downstream of an urban river. Int. J. Environ. Sci. Tech. 7(1):17-28
Crossref
 
 
Muller G (1969). Index of geoaccumulation in sediments of the Rhine River. J. Geol. 2:108-118.
 
 
Muller G (1981). The heavy metal pollution of the sediments of Neckars and Its Tributary, A Stock taking Chemische Zeit. 150:157-164.
 
 
Mumba PP, Chibambo BQ, Kadewa W (2008). A comparison of the levels of heavy metals in cabbages irrigated with reservoir and tap water. Int. J. Environ. Res. 2(1):61-64.
 
 
Nabi Bidhendi GR, Karbassi AR, Nasrabadi T, Hoveidi H (2007). Influence of copper mine on surface water quality. Int. J. Environ. Sci. Tech. 4(1):85-91.
Crossref
 
 
Nouri J, Mahvi AH, Bazrafshan E (2010). Application of electrocoagulation process in removal of zinc and copper from aqueous solutions by aluminum electrodes. Int. J. Environ. Res. 4(2):201-208.
 
 
Nriagu JO (1988). Production and uses of chromium, in: Nriagu JO, Niebner E (Eds.), Chromium in the natural and human environments. Wiley, New York, pp. 81-104.
 
 
Okafor EC, Opuene K (2007). Preliminary assessment of trace metals and polycyclic aromatic hydrocarbons in the sediments. Int. J. Environ. Sci. Tech. 4(2):233–240
Crossref
 
 
Priju CP, Narayana AC (2007). Heavy and Trace Metals in Vembanad Lake Sediments. Int. J. Environ. Res. 1(4):280-289.
 
 
Ramasamy V, Murugesan S, Mullainathan S (2004). Characterization of minerals and relative distribution of quartz in Cauvery river sediments from Tamilnadu, India- A FTIR study. Bull. Pure Appl. Sci. 23(1-2):1.
 
 
Ramasamy V, Murugesan S, Mullainathan S (2005). Distribution and characterization of minerals in Cauvery river sediments by grain size analysis –A new approach by FTIR study. Ind. Miner. 39(2):91-93.
 
 
Ramasamy V, Rajkumar P, Ponnusamy V (2006). FTIR spectroscopic analysis and mineralogical characterization of Vellar river sediments. Bull. Pure Appl. Sci. 25(1):49-55.
 
 
Ramesh R, Subramanian V, Van Grieken R (1990). Heavy metal distribution in sediments of Krishna river basin, India. Environ Geol. Water Sci. 15:303-324.
Crossref
 
 
Saikia BJ, Parthasarathy G, Sarmah NC (2008). Fourier transform infrared spectroscopic estimation of crystallinity in SiO2 based rocks. Bull. Mater. Sci. 31(5):775-779.
Crossref
 
 
Sarin MM, Krishnaswami S, Dilli K, Somayajulu BLK, Moore WS (1989). Major ion chemistry of the Ganga–Brahmaputra river system: Weathering processes and fluxes to the Bay of Bengal. Geochim. Cosmochim. Acta. 53:997-1009.
Crossref
 
 
Seralathan P (1987). Trace element geochemistry of modern deltaic sediments of the Cauvery river, east coast of India. Ind. J. Mar. Sci. 16:235-239.
 
 
Singh AK (1999). Elemental composition of the Damodar river sediments – A tributary of the Lower Ganga, India. J. Geol. Soc. India 53:219-231.
 
 
Singh M, Ansari AA, Muller G, Singh IB (1997). Heavy metals in freshly deposited sediments of the Gomti river (a tributary of the Ganga river): effects of human activities. Environ. Geol. 29:246-252.
Crossref
 
 
Singh S, Sarin MM, France-Lanord C (2005). Chemical erosion in the eastern Himalaya: major ion composition of the Brahmaputra and d13C of dissolved inorganic carbon. Geochim. Cosmochim. Acta 69:3573-3588.
Crossref
 
 
Singh SK, France-Lanord C (2002). Tracing the distribution of erosion in the Brahmaputra watershed from isotopic compositions of stream sediments. Earth Planet Sci. Lett. 202:645–662.
Crossref
 
 
Subramanian V (1988). Environmental geochemistry of the Indian river basins: A review. J. Geol. Soc. India. 29:205-220.
 
 
Subramanian V, Grieken RV, Dack LV (1987). Heavy metals distribution in the sediments of Ganges and Brahmaputra rivers. Environ. Geol. Water Sci. 9:93-103.
Crossref
 
 
Subramanian V, Van't Dack L, Grieken V (1985). Chemical composition of river sediments from the Indian subcontinent. Chem. Geol. 48:271-279.
Crossref
 
 
Tippie V (1984). An environmental characterization of Chesa- peak Bay and a Framework for Action, In: V. Kennedy (Ed.) The Estuary as a Filter, Academic Press, New York. pp. 467-487.
Crossref
 
 
Tomlinson D, Wilson J, Harris C, Jeffrey D (1980). Pro- blems in the Assessment of Heavy-Metal Levels in Estu-aries and the Formation of a Pollution Index. Helgoland Marine Res. 33(1-4):566-575.
 
 
Venugopal T, Giridharan L, Jayaprakash M (2009). Characterization and Risk Assessment Studies of Bed Sediments of River Adyar-An Application of Speciation Study. Int. J. Environ. Res. 3(4):581-598.
 
 
Ya ZG, Zhou LF, Bao ZY, Gao P, Sun XW (2007). High efficiency of heavy metal removal in mine water by limestone. Chin. J. Geochem. 28(3):293-298. 


          */?>