Many plants produce very attractive flowers, leaves and fruits. Colour pigments that are derived from nature are believed to be environmentally friendly because of their non-toxic, non-carcinogenic and biodegradable nature. In this project, colour pigment from ethanol extract of Sorghum bicolour was investigated using three different spectroscopic techniques (UV-Vis, FT-IR and GC/MS). The effects of dyeing parameters; temperature, pH and the presence of mordant on dyeing quality of the extract were also examined. UV-VIS absorption spectra indicates a λmax peak at 535 nm, value associated to delphinidin dyes under bathochromic shift. Structural characterization by FT-IR revealed presence of C=O, OH and C=C of aromatic. Twelve phytochemicals were identified through GC/MS study.The extract showed colour change from brown to red between pH ranges of 3 to 12. The best dyeing quality was achieved at 30°C with alum pre-treated cloth at neutral pH. Presence of delphinidin dye in S. bicolour extract was confirmed from spectroscopy and chemical analysis results; however, further feasibility study has to be carried out on S. bicolour before it can be applied as dye in industry.
Sorghum bicolour is
annual or short-term perennial plant that grows up to 4 m or more in height. Mature glumes of sessile spikelets are either red or reddish brown or straw coloured or yellowish, sometimes flushed with dark red or reddish brown; grain predominantly red or reddish brown (De Wet et al., 1972).
Plants, animals and minerals sourced natural dyes are renewable and sustainable bioresource products with minimum negative environmental impact. Biosource dyes have been known since antiquity for their uses, not only in coloration of textiles (Kadolph, 2008) but also as food ingredients (Dweck, 2002) and cosmetics (Frick, 2003). Awareness of the hazard associated with synthetic dye has led to upsurge in the use of non-allergic, non-toxic and ecofriendly natural dyes. Recently, a number of commercial dyer and small textile houses have started investing on the possibilities of using natural dyes for regular basic dyeing and printing of textile in order overcome negative environmental impacts caused by synthetic dyes (Glover and Pierce, 1993).
The choice of dyeing parameters can influence the affinity (substantivity) of dyes for cellulose fibres which depends on the type of chromophore (Ross et al., 1989).
Solubility, substantivity of the dyes, and their stability in the dyebath are influenced by the pH value of the solution. Dyeing equilibrium is determined by temperature, which at room temperature is shifted strongly toward adsorption on the fibre. At high temperature, usually 80.0°C the equilibrium is attained more rapidly (Klaus, 2003). Natural dyes adhere to natural fibres with the use of a mordant or fixative. Mordant dyes require addition of chemical substances, such as metal salts (mordanted), to give them an affinity for the material being dyed. Highly adhesive, basic metal compounds are formed on the fibre. These compounds are capable of producing insoluble coloured complexes (lakes) with certain azo and anthraquinone derivatives. The shade of the dyeing depends on the type of metallic mordant used (Rath, 1972).
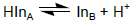
At equilibrium the two forms of indicator are present in solution.The most important structure changes for indicator dyes are; Reversible transition between acid and base form of a molecule (pH indicator); Reversible transition between reduced and oxidized forms of a molecule (redox indicator), and reversible transition between the free molecule and its complex with a cation (metal indicator) (Ingrid, 2001).
Extraction
Dried leaves of S. bicolour obtained from the open market in Oyo (Oyo State, Nigeria) were used in this study. The powdered sample 450.0 g was extracted with 1.5 L of distilled ethanol. The extraction was done for 7 days and the extract was filtered using Whatmann No.2 filter paper. The filtrate was evaporated in vacuo to give a residue (60.50 g), which was kept at 4°C until further use.
UV-Vis spectroscopy analysis
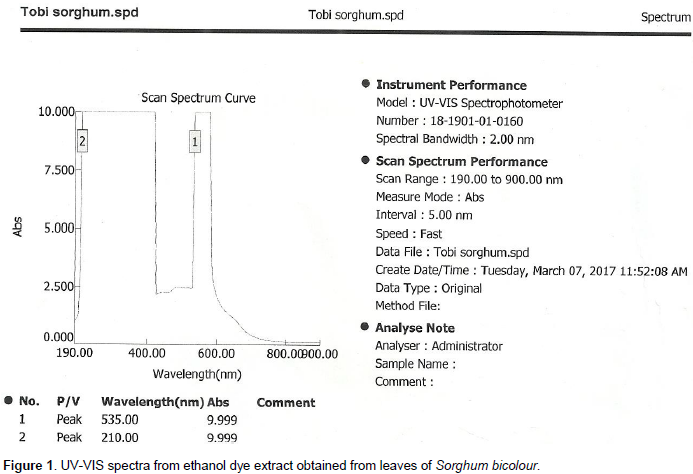
An aliquot of the extract was introduced in a quartz cell (1 cm pathway) and analyzed in UV/Vis spectrophotometer. A scan from 190 to 900 nm was performed in order to generate the characteristic absorption spectra of the sample.
FT-IR spectroscopy analysis
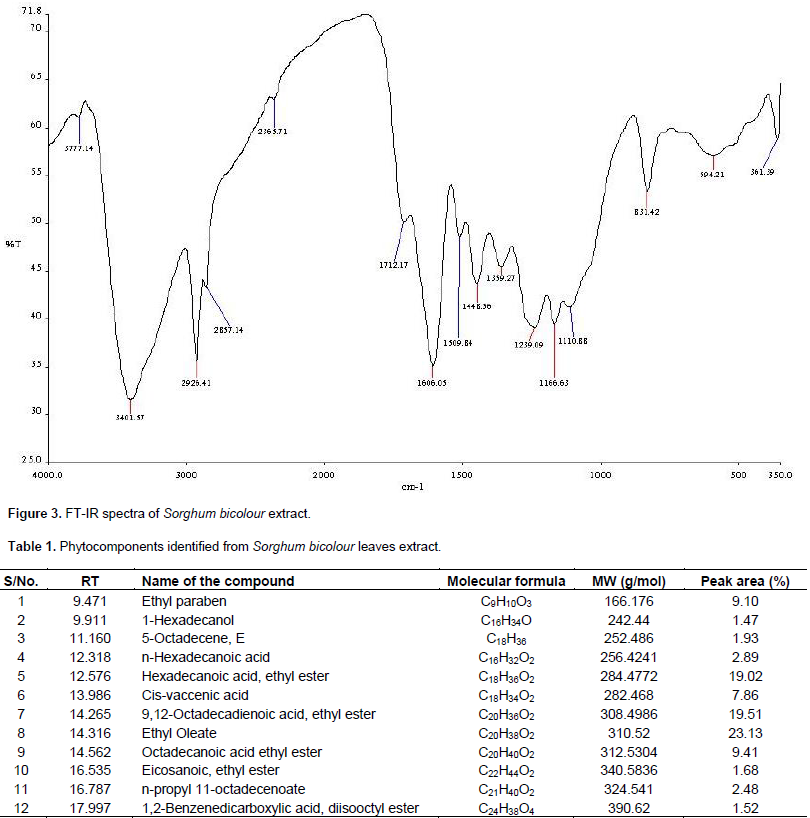
2 mg of powered extract was mixed thoroughly with 200 mg of potassium bromide (KBr) and homogenized in an agate mortar. The mixture was then placed in the sample compartment of Infrared Fourier Transform Spectroscopy (FT-IR) for analysis.
GC/MS analysis
Dyeing process
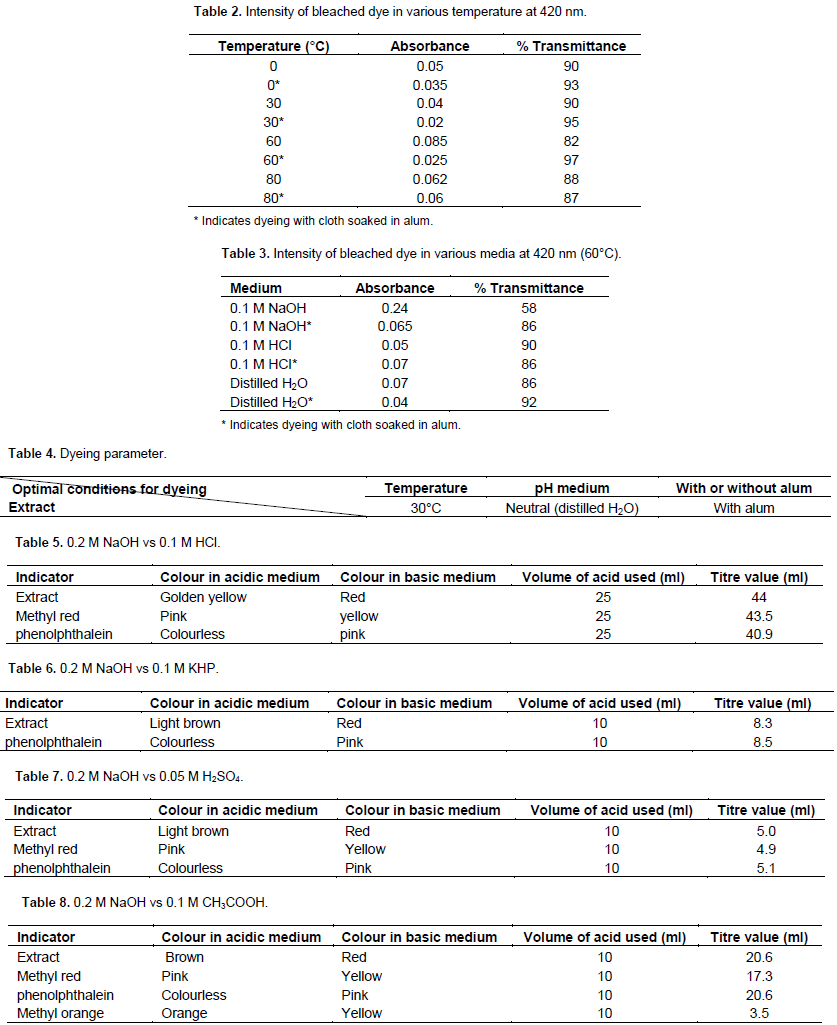
Stock solution was prepared by dissolving 30 g of the extract in 100 mL of distilled water. To 5 ml of aliquot 100 ml of distilled water was added and this was replicated into 32 flasks. Fourteen pieces of cleaned white cloths of equal length were boiled in alum solution. Effect of temperature was investigated by varying the temperature of dyeing solution; 0, 30, 60 and 80°C. A piece of cloth was then added to each solution and dyed for 15 min. For the effect of pH, a piece of cloth was immersed each into dyes containing dilute hydrochloric acid, distilled water and dilute sodium hydroxide solution. For the effect of mordant, ordinary cloths and those soaked in alum solution were used for dyeing. All experiments were carried out in duplicate. After dyed cloths had been dried, they were soaked in distilled water for 15 min. The bleaching of the colour was then monitored colorimetrically (Peters, 1975).
pH indicator
Solutions of various pH 1 - 14 were prepared and 3 drops of the plant extract were added to each solution to observe the colour change. Furthermore, 0.1 M solutions of HCI, H2SO4, KHP and CH3COOH were prepared in 4 different conical flasks. To each conical flask, 3 drops of extracts were added and titrated against standardized 0.2 M NaOH solution.
The characteristic red colour manifested by the dye extract could be the consequence of the presence of delphinidin (anthocyanins) derivatives. Figure 1 shows the absorption spectra generated during the analysis of leaves extract of S. bicolour. A maximum absorbance peak at uv range (λmax) was detected at 535 nm. This value is closed to the value of delphinidin-3-cis-coumaroylrut-5-glucoside (532 nm) reported by Eva et al. (2006). Other delphinidin derivatives reported in her findings range from 522-530 nm.
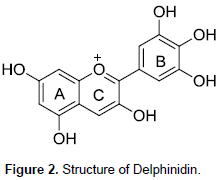
Delphinidin is formed by two aromatic rings (Figure 2) the benzopiril group(A and C ring) and the phenolic group (B ring). Delphinidin which may have H, -OH, -OCH3 or sugar moiety substituent groups. Their characteristic colour depends strongly on the number of substituents at the B ring (Myjavcová, et al., 2010). FT-IR spectra in Figure 3 show a strong signal at 3401 cm-1 corresponding to the characteristic O-H vibration which is corroborated by C-O vibration at 1239 cm-1. The signals at 1606, 1509 and 1446 cm-1 are C=C aromatic group vibrational frequency. A weak absorption band at 1712 cm-1 is assigned to C=O in ring. Gas chromatography-mass spectrometry analysis of the leaf extract resulted in the identification of twelve (12) compounds. The major components are ethyl oleate (23.13%), Linoleic acid ethyl ester (19.51%), Hexadecanoic acid ethyl ester (19.02%), octadecanoic acid ethyl ester (9.41%), ethyl paraben (9.15%), and octadeca-9-enoic acid (7.86%). Table 1 lists the constituents in order of elution from HP-5 capillary column.
Presence of delphinidin in S. bicolour extract was evidence from spectroscopy and chemical analysis results. Natural dyes are limited in application because they are easily degraded by light and heat. Nevertheless, natural dyes are non-hazardous and more desirable than synthetic dyes. Biosource dyes are non-allergic and they are more suitable for children and babies. Moreover, they are biodegradable and pose less pollution problems. However, further stability study has to be carried out on S. bicolour pigment before it can be used by industry as dye.
The author has not declared any conflict of interests.