Full Length Research Paper

ABSTRACT
Vertical electrical sounding (VES) and 2D electrical resistivity tomography (ERT) employing the Schlumberger and Wenner configurations respectively were combined for groundwater exploration in parts of Enugu metropolis. The area is underlain by Enugu Shale and Mamu Formation. A total of twenty (20) VES and four (4) 2D ERT traverses were acquired in the study area. VES and 2D ERT data were processed and interpreted using INTERPEX 1X1D and RES2DINV respectively. Sounding curves shows dominant decrease in resistivity with depth while 2D ERT inverse model shows lateral variation in resistivity of the rock layers with lower resistivity at increasing depth. VES geoelectric layer sections show top sideritic clay - clay/shale sequence. Resistivity curve analysis also shows predominance of Q and K curve types. 2D map of aquifer layer resistivity, thickness and depth were constructed. Aquifer layer resistivity range from 2.00 to 190 ?m, while the thickness range from 10 to 75 m and a depth range of 23 to 150 m. The 2D ERT shows layer resistivity range of 0.1 to 250 ?m. Based on the combination of the two techniques for groundwater exploration in the study area, a water table depth of 18 m with a maximum drill depth of about 100 m was determined. However, it is recommended that the selection of point of drill should be on the low saturated regolith as observed on the 2D ERT sections.
Key words: Aquifer, groundwater, VES, 2D ERT, resistivity.
INTRODUCTION
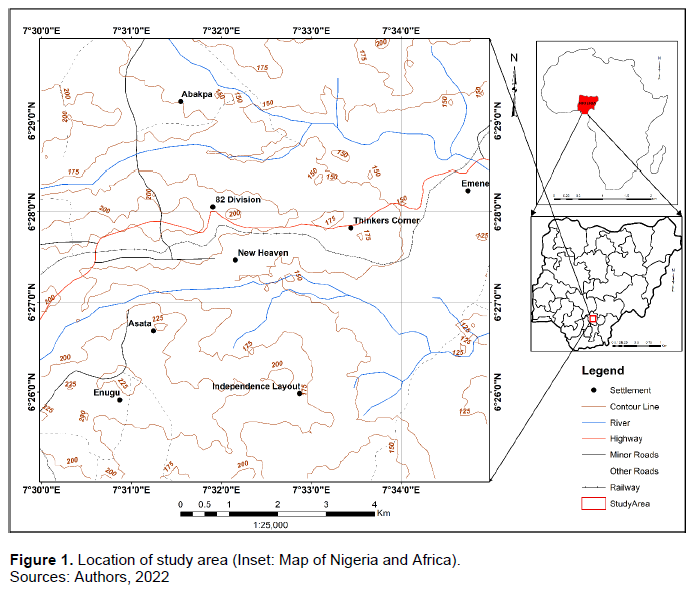
The study area is located within Latitude 06° 25' 00''N to 06° 30' 00''N and Longitude 007° 30I' 00''E to 06° 35' 00''E (Figure 1) with an area extent of 85 Km2. The rapid rate of urban development in Enugu metropolis has led to continual increase in the human population in the area.
A required basic amenity as a result of this upsurge in population is sustainable groundwater supply. Water is one of the most important natural resources occurring both as surface water and groundwater. Groundwater represents the second-most abundantly available freshwater resources and constitutes about 30% of fresh water resources of the globe (Ajayi and Hassan, 1990). Groundwater is vital for all life on the earth. Groundwater remains the possible means of water supply, as surface water systems in the study area are mostly perennial in nature. A case of failed or abortive boreholes largely exists within the study area. Reliable groundwater potential is very vital and fundamental for large scale development of groundwater (Singhal and Niwas, 1985; Obi et al., 2001). Exploration for groundwater has been possible by the use of geophysical tools. Various surface geophysical techniques are available but the most commonly used technique in Nigeria for rural and urban areas is the Electrical Resistivity (ER) method, because of its low cost and relative high diagnostic value. The electrical geophysical survey method is the detection of the surface effects produced by the flow of electric current inside the earth (Anakwuba and Chinwuko, 2016). In recent times, the vertical electrical sounding (VES) technique of ER method has proved very popular with groundwater prospecting due to simplicity of the techniques. However, the horizontal profiling (HP) technique of ER method is not quite popular with respect to groundwater explorations. VES is a geo-electric common method to measure vertical alteration of electrical resistivity of the subsurface lithologies, while HP investigate horizontal lithologic subsurface extent. Details of these techniques have been documented in previous research work (Igbokwe et al., 2006; Zigede et al, 2015; Nwadike et al, 2017). In the present study, attempts have been made to explore for groundwater in the study area by combining the VES and the 2D HP which is electrical resistivity tomography (ERT) techniques. It is hoped that these combined applications will help to decipher the regolith horizons and possible groundwater drilling point(s).
Physiography
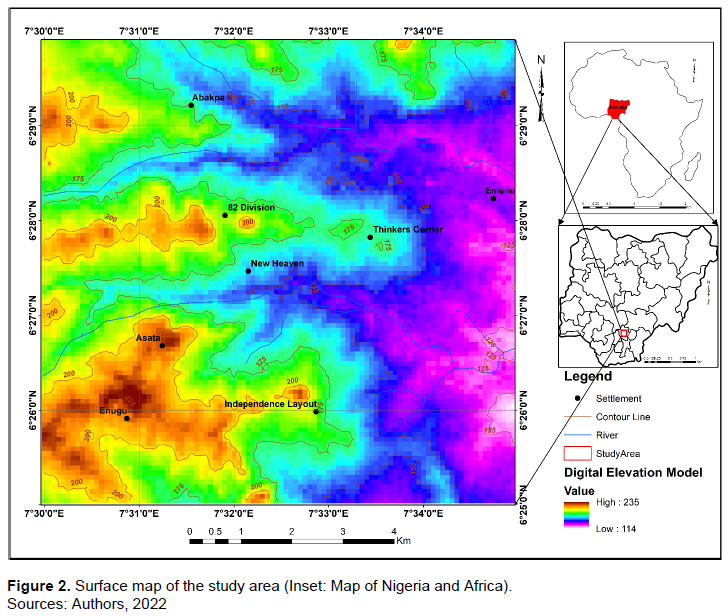
The topography of an area is a reflection of the tectonic and geologic events that occurred over the years and mildly neotectonically continues today to shape the geomorphic landscape (Egboka et al, 1989). The underlying rocks are the Enugu shale and Mamu Formation. A roughly trending NW-SW ridge crosses the study area (Figure 2) at the fringe to the west. While to the east are lowland areas. Egboka and Onyebueke (1990) observed a north - south trending cuesta or escarpment crossing the study area with Enugu at the foot of the scarp, while Ngwo and Udi are on the plateau. The climate of Nigeria is classified into meterological zones with Enugu area in zone B (Menakaya and Floyd, 1965). This area is characterized by relatively warm temperature days of 27 to 32°C and moderately cool nights of 17 to 28°C (Egboka and Onyebueke, 1990). Two main climatic changes occur, namely the dry season and rainy season. Dry season prevails from early November to March, while rainy season starts from April to October with an August break or short period of no rain. Rainfall intensity in Enugu is highest in September and lowest in December and January. The conventional nature of rainfall results in alternating sunny and rainy periods (Egboka and Onyebueke, 1990).
Geology
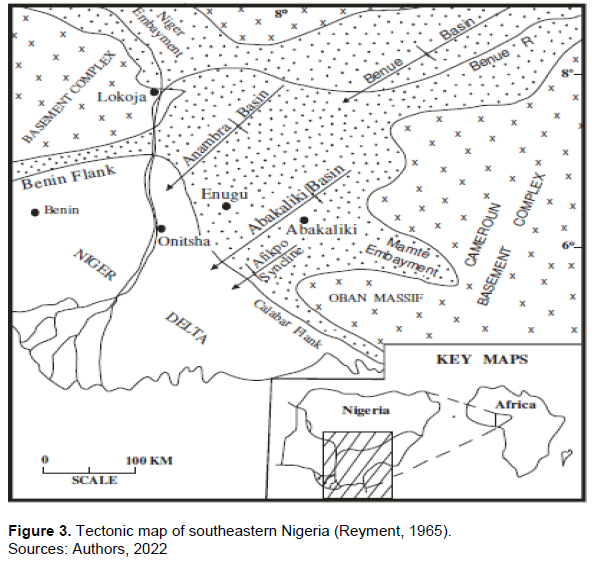
The study area lies within the Anambra Basin. Anambra Basin is a synclinal structural depression and one of the intracratonic-inland basins (Figure 3). It is located in south eastern part of Nigeria. The Basin is roughly triangular and covers about 4000 km2 (Ibe and Uzoukwu, 2004; Nwajide and Reijers 1996). It is located between the Nupe Basin in the northwest, the Abakaliki Anticlinorium in the east and the northern Niger Delta complex (Akaegbobi and Boboye, 1999). The Anambra Basin contains post deformational Campano-Maastrichtian to Eocene Sedimentary strata.
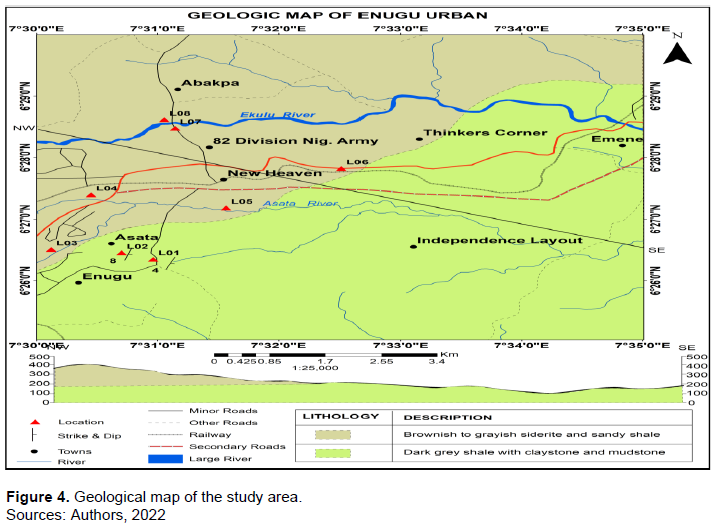
Two geologic units underlie the study area; Enugu Shale and Mamu Formation (Figure 4). The Enugu Shale is of Campanian in age, dark-grey shale with fissility at outcrop areas, while the Mamu Formation is of Lower Maastrichtian in age. It is dominantly sandy shale, dark-white in colour and coal bearing.
Hydrogeology
The study area falls within the Cross River Basin. Offodile (2002) described the Cross River Basin as hydro-geologically problematic groundwater basin. More than 90% of the Cross River Basin is underlain by Cretaceous rocks of the Asu River, Ezeaku, Awgu, Nkporo and Mamu Formations, with the oldest, the Asu River Formation, underlain by the Basement Complex rocks. The hydraulic units in the study area include confined and semi-confined aquifer conditions which exist in areas where the immature Enugu shale is overlain by the Imo Formation. Semi-confined condition is envisaged in places with thick sequences of shale that are aquiferous, inter-bedded with sandy-clay or clayey-sand aquicludes. Various aquifers in this group exist in the upper to middle horizons of the Enugu shale Formation and constitute the partial recharge zones for the deep-seated confined aquifers (Egboka and Onyebueke, 1990; Akudinobi and Egboka 1996). Unconfined aquifer conditions exist in the central portion of the study area underlain by Enugu shale, which represents sections where the semi-permeable or impermeable cap beds of Ajali Formation have been eroded or does not exist. The thickness of these aquifer conditions vary from shallow to deep as was suggested by borehole data of the study area.
MATERIALS AND METHODS
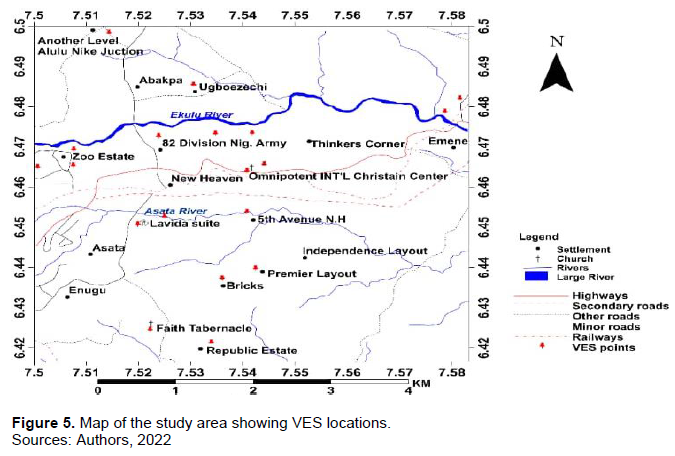
Twenty (20) VES and Four (4) ERT measurements were acquired in such a way that the study area was well covered. The Ohmega Resistivity meter SAS 300 was deployed for the study. Some VES points were run along a defined profile for comparative purposes to check the efficacy of this method (Figure 5).
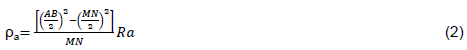
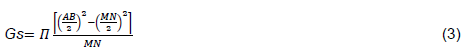
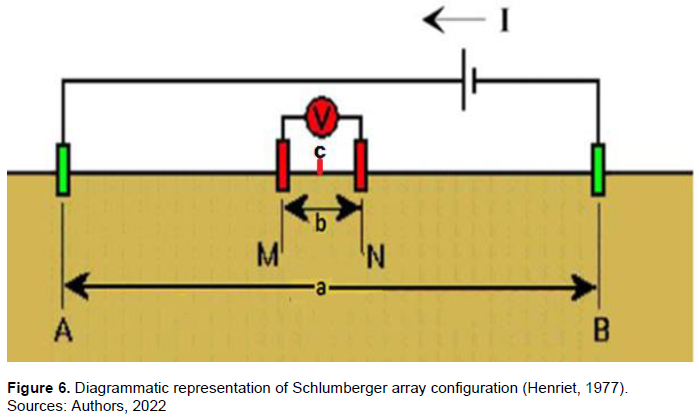
The Schlumberger electrode configuration (Figure 6) was used for the acquisition of VES data, with maximum current electrode separation AB, ranging from 100 to 150 m depending on the accessibility of the road. The field sounding point coordinates were measured using global positioning system instrument. The computation of the apparent resistivity (ρa) was done using the values of the apparent resistance (Ra) and geometric factor (Gs) for Schlumberger array:

Where Gs is the geometric factor for Schlumberger array mainly affected by electrode arrangement and Ra is the field apparent resistance measured from the equipment. Equation (1) can also be written as:
where AB is the distance separating the two current electrodes
while MN is the separating distance between the potential electrodes, and:
The initial interpretation of the VES data was accomplished using the conventional partial curve matching technique, with two-layer master curves in conjunction with auxiliary point diagrams (Orellana and Mooney, 1966; Kellar and Frischknecht, 1966; Koefoed, 1977). From this, estimates of layer resistivities and thicknesses were obtained which served as starting points for computer-assisted interpretation. The computer program INTERPEX 1X1D, was used to interpret all the data sets obtained.
The study area was also surveyed employing the Wenner array electrode configuration (Figure 7) which yielded a detailed four (4) ERT profiles by allowing equal electrode spacing (a) of 5 to 40 m and station distance of 5 m between the pairs of current and potential electrodes throughout the entire survey. All electrodes were moved at interval of 5 m, covering a maximum length of 200 m. The Wenner electrode configuration is very prone to variations in the subsurface resistivity which occurs in the vertical direction and can solve problems resulting from vertical changes in the subsurface. Also Wenner electrode array have the ability to produce set of data with high signal to noise ratio. Equation 4 was used to calculate the apparent resistivity values for the 2D imaging from the measured field resistance values which was further processed using RES2DINV_32 version 3.71.115 software package.
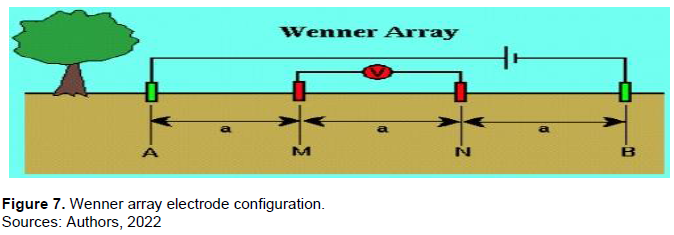
Apparent resistivity (ρa) = 2πaR (4)
Where 2πa is the geometric factor which depends on the electrode arrangement while R is the resistance in Ohms.
RESULTS AND DISCUSSION
VES
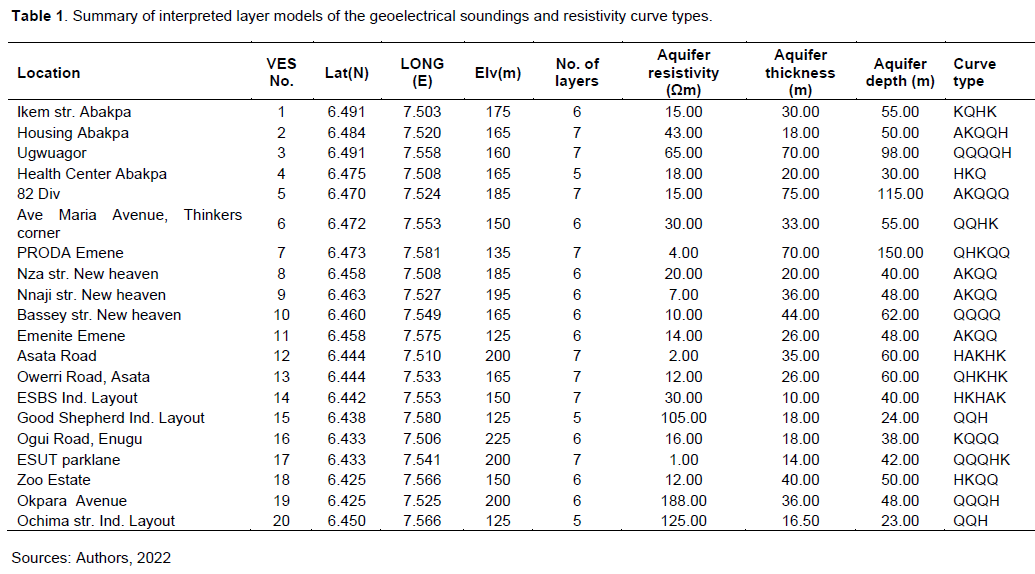
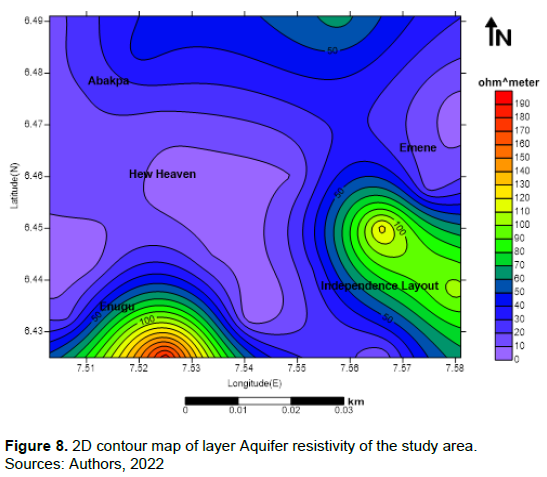
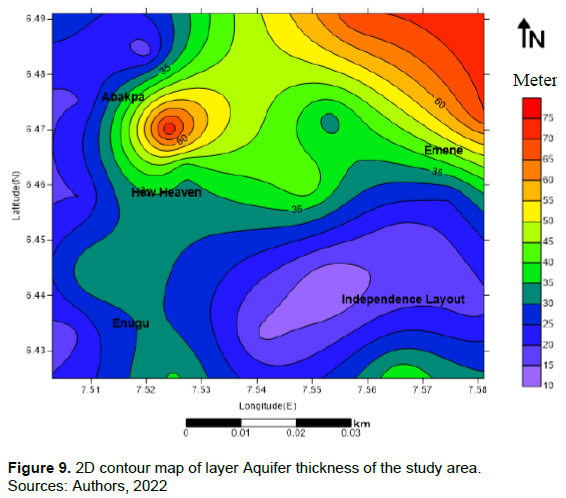
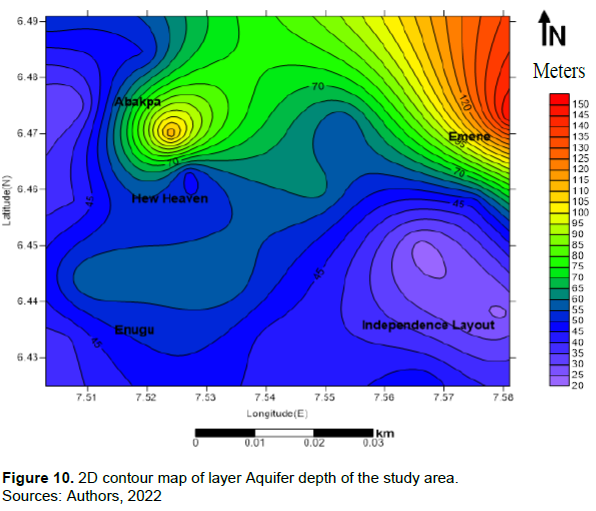
Table 1 presents the summary of interpreted layer models of VES data. Aquifer resistivity range from 2.00 ?m around Asata road to about 190 ?m at Okpara avenue areas. Resistivity is a function of rock matrix or framework. Aquifer depth is variable in the study area. It ranges from 23.00 m around Ochima Street to 150 m around PRODA Emene. Aquifer thickness range from 10 m around ESBS Independence layout to 75 m around 82 Division barracks. Variable comparison of Aquifer resistivity and thickness largely exists in the study area. 2D contour map of Aquifer resistivity thickness and depth were constructed for comparable variable distributions (Figures 8 to 10) of the calculated quantities in the study area. Low resistivity exists around Emene, Abakpa and New heaven with good aquifer thickness and at depth range of 70 to 150 m. Variable low resistivity horizons are possible groundwater targets in shaley terrains.
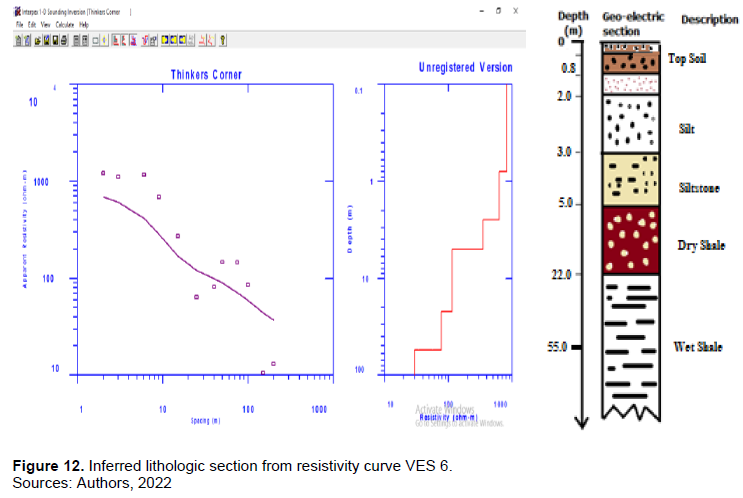
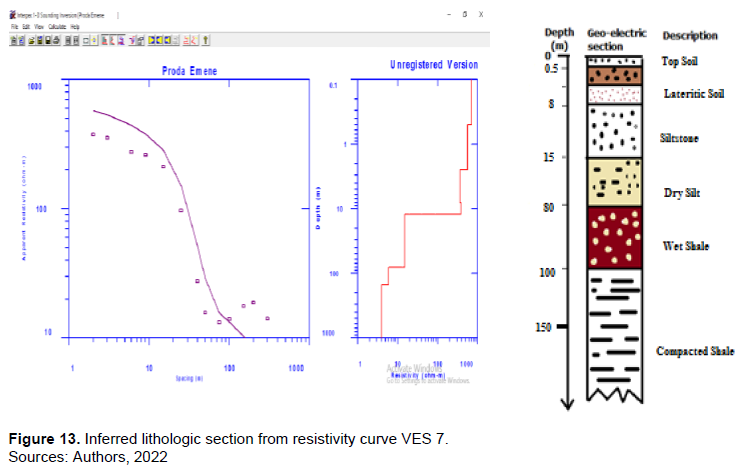
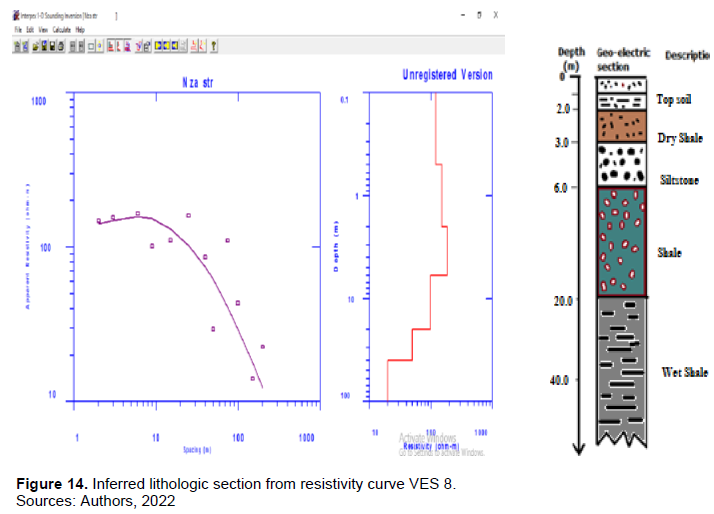
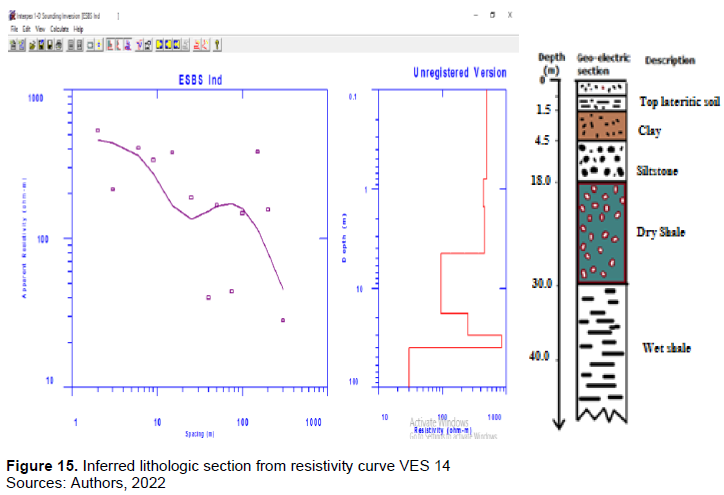
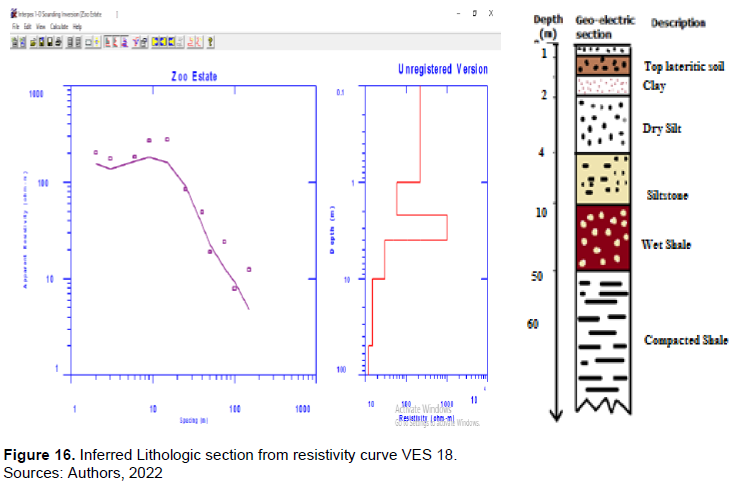
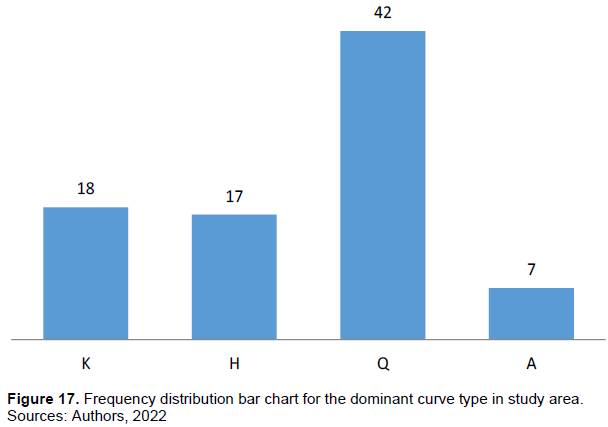
The lithological interpretation of the geo-electric section shows a rhythmic sequence of siltstone – clay/shale horizons. Based on the uniqueness of the locations, six (6) VES numbers were selected to shows the lithological sequence (Figure 11 to 16). They are VES 1, 6, 7, 8, 14 and 18. Resistivity curve type shows multilayer system with seven (7) layer case dominating. Frequency bar chart plot of curve types shows the predominance of Q and K curve type (Figure 17). This indicates a shaley horizon with intercalations sandy siltstones.
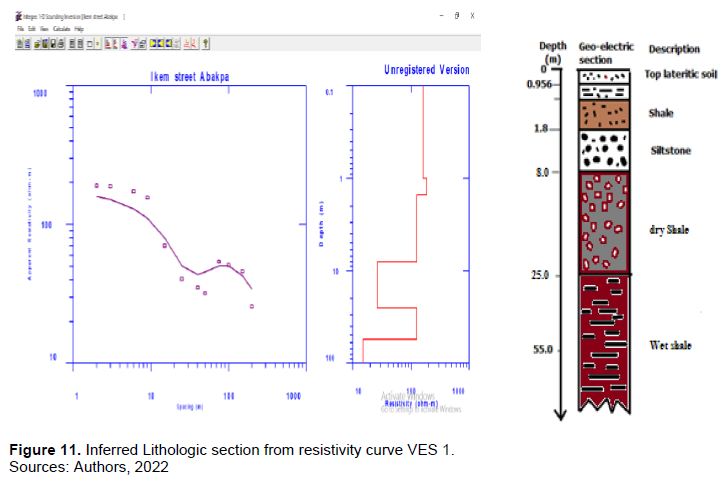
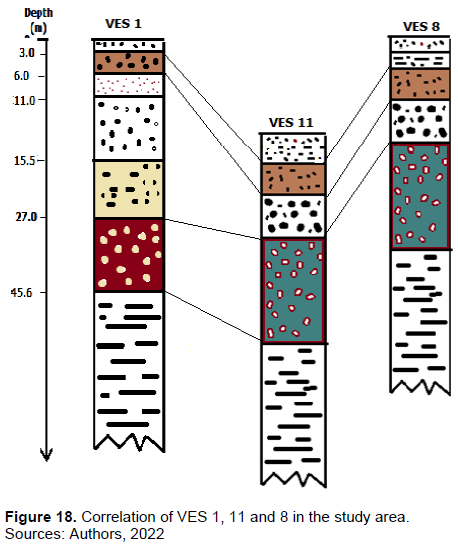
The correlation of geo-electric sections for VES 1, 11 and 18 were constructed (Figure 18). It shows that the top layer thickness in the three geoelectric sections, along the profile is 1.0, 0.8 and 0.5 m respectively. The underlying litho-unit was delineated as shale and this occurs in the three geo-electric sections, although there are variations in their depths and thickness. Again, the wet shale zone shows varying thickness and depths. The depth to the wet shale in VES one is 32 m with thickness of 20 m while the depth to the wet shale in VES eleven is 48 m and thickness of 35 m. That of VES eight has thickness of 20 m and at a depth of 40 m. The depth of the wet shale depth along the profile is not at horizontal level, it is undulating. The depth to the base was not reached in the VES but they are interpreted as compacted shale because of their high conductivity value.
2D ERT sections
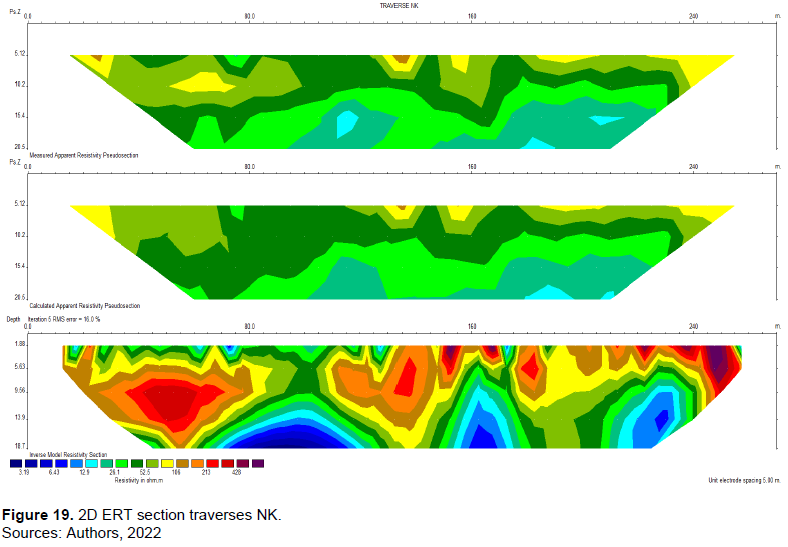
The 2D ERT sections show continuous subsurface lithological variations across sections of an area in the study area. The inverse model resistivity section is the diagnostic interpretation section. The contact points between the siderite materials, marked by high resistivity areas and shale/clay units, marked by low resistivity zones are possible saturated regolith horizons. These are possible groundwater zones.
Traverse NK
The inverse model (Figure 19) shows maximum depth of investigation of 26.5 m. Pockets of high resistivity exists which indicates siderite materials with underlying shaley horizons at depth of 15 m. This horizon is possible target for groundwater drilling.
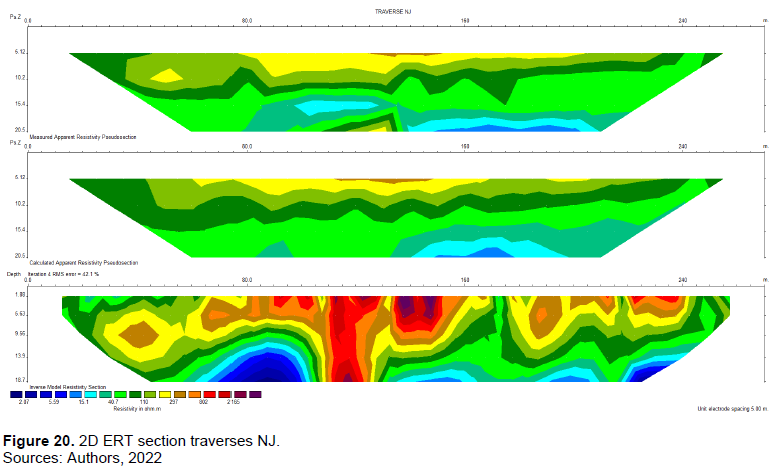
Traverse NJ
Along the traverse (Figure 20) from distances of 20 to 22m to a depth of about 2.9 m, the resistivity in that region increased with depth before a decrease was observed at depth range of 2.55 m to 4.96 m. Possible groundwater horizon was observed at horizontal distance between 8.0 and 16.5 m at depth of between 2.55 and 6.06 m.
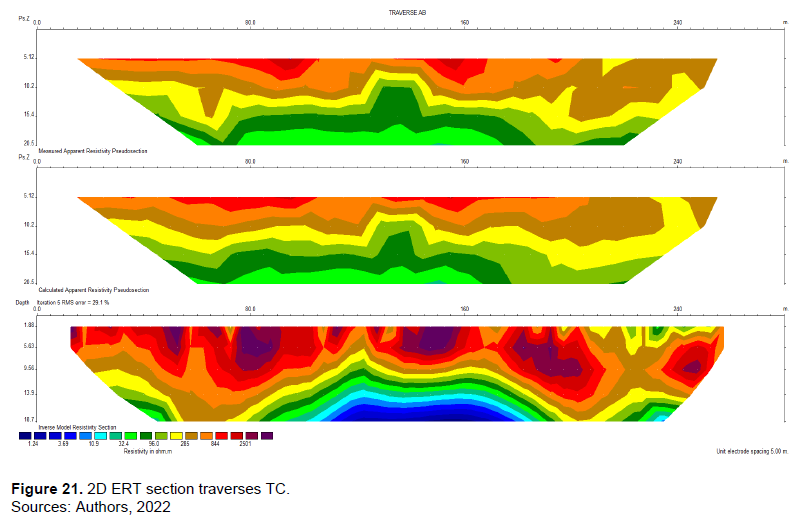
Traverse TC
The interpretation model (Figure 21) shows lateral variation in near surface resistivity with resistivity decreasing laterally from the left end of the model to horizontal distance of 1.6 to 9.5 m reveals high resistivity values of about 544 to 1000 Ωm this suggest that the horizon is possible sandy siltstone. Also resistivity decreased from the end of the profile to the same profile length 9.7 to 18.8 m. Hence, lowest resistivity (about 32.4Ωm) is interpreted as wet shale and it is believed to be a lithic content of the Enugu shale.
Traverse AB
The interpretation model (Figure 22) shows lateral variation in near surface resistivity with resistivity decreasing laterally from the left end of the model to profile length of 1.6 to 5.3 m reveals high resistivity values of about 944 to 1320 Ωm this region is interpreted as the top lateritic soil. At the middle of the model profile contains material with relatively low resistivity of about 6.9 to 253 Ωm and it interpreted as wet shale. The base of this model contains materials of low resistivity and it is interpreted as compacted shale.

CONCLUSION
The 2D ERT imaging has shown subsurface lithological variation in the study area. The technique compared favorably with the VES measurements, which showed the vertical successions of rock layers. The possible saturated regolith horizons are marked by the contact between the high and low resistivity subsurface regions. The deep brown and red colours mark the high resistivity horizons. While the deep blue and green colours mark the low resistivity horizons. These are possible points of drilling for groundwater which can sustain for a long period in the study area.
CONFLICT OF INTERESTS
The authors have not declared any conflict of interests.
REFERENCES
|
Ajayi CO, Hassan M (1990). The delineation of aquifer overlaying Basement complex in the Western part of Kubarni basin of Zaria: Nigeria. Journal of Mining and Geology 26(1)117-124. |
|
|
Akaegbobi IM Boboye OA (1999). Textural, Structural Features and Microfossil assemblage Relationship as Delineating criteria for the Stratigraphic boundary between Mamu Formation and Nkporo Shale within the Anambra Basin, Nigeria. NAPE Bull 9:193-206. |
|
|
Akudinobi BEB, Egboka BCE (1996). Aspects of hydrogeological studies of the escarpment regions of southeastern Nigeria. Water Resources J. NAH 7(1-2):12-25. |
|
|
Anakwuba EK, Chinwuko IC (2016). Application of vertical electrical sounding (VES) for groundwater exploration in Onitsha and environs, Nnamdi Azikiwe University, Nigeria. |
|
|
Egboka BCE, Nwankwor GI, Orajaka IP (1989). Implications of palaeo and neo-tectonics in gully erosion prone areas of southern Nigeria. Natural Hazards Journal. The Netherlands (In press). |
|
|
Egboka BCE, Onyebueke FO (1990). Acute hydrogeological problems Vis-à-Vis- planning and management of a developing economy: A case study of Enugu area, Nigeria. Water Resources J. NAH, 2(1):43-55. |
|
|
Henriet JP (1977). Direct Application of Da- Zarrouk Parameters in Groundwater Surveys. Geophysical Prospecting 24(2):344-353. |
|
|
Ibe KM, Uzoukwu SC (2004). An appraisal of subsurface geology and groundwater resources of Owerri and environs based on electrical resistivity survey and borehole data evaluation. Journal of Environmental Monitoring and Assessment 8:303-321. |
|
|
Igbokwe MU, Okwueze EE, Okereke CS (2006). Delineation of Potential Aquifer Zones from Geoelectric Soundings in Kwa Ibo River Watershed, Southeastern, Nigeria. Journal of Engineering and Applied Sciences 1(4):410-421. |
|
|
Kellar GV, Frischknecht FC (1966). Electrical methods in Geophysical prospecting. Perganon Inc. Press Oxford. |
|
|
Koefoed O (1977). Geosounding Principles 1. Resistivity Sounding Measurements. Elsevier: Amsterdam, the Netherlands. 277 p. |
|
|
Nwadike I, Ezeh CC, Okonkwo AC (2017). Two-dimensional electrical resistivity imaging of solid waste dumpsite at Ugwuaji, Enugu state, Nigeria. International research journal of natural and applied sciences. 4(7):262-272. |
|
|
Nwajide CS, Reijers TJA (1996). Sequence architecture in outcrops: examples from the Anambra Basin. NAPE Bulletin 11:23-32. |
|
|
Obi GC, Okogbue CO, Nwajide CS (2001). Evolution of the Enugu Cuesta: A tectonically driven erosional process. Global Journal of Pure and Applied Sciences 7:321-330. |
|
|
Offodile ME (2002). Groundwater study and development in Nigeria. 2nd Edition. Mecon geology and Engineering services Ltd. Jos, Nigeria. 453 p. |
|
|
Orellana E, Mooney HM (1996). Master tables and curves for vertical electrical sounding over layered structures. Interscience, Madrid, Spain. |
|
|
Reyment RA (1965). Aspects of the Geology of Nigeria.University of Ibadan Press, Nigeria 145 p. |
|
|
Singhal DC, Niwas S (1985). Aquifer transmissivity of porous media from resistivity data. Journal of Hydrology 82:143-153. |
|
|
Zigede LJ, Ezeh CC, Okonkwo AC (2015). Evaluation of 2D electrical resistivity imaging and self-potential anomalies over Agbani Sandstone, Southern Benue Trough: Implication for Sulphide Ore Enrichment. Journal of Environment and Earth Science. 5(20):52-61. |
|
Copyright © 2024 Author(s) retain the copyright of this article.
This article is published under the terms of the Creative Commons Attribution License 4.0


