Full Length Research Paper

ABSTRACT
A model of the dimensions that measure the way students perceive and think about the image of vocational education training (VET) was developed together with an instrument to measure the impact of VET’s image on students’ loyalty towards the VET sector in the Vietnamese context. The data were collected from 900 students: 300 in lower secondary school, 300 in upper secondary school and 300 in vocational education and training using a face-to-face administered survey questionnaire. Exploratory factor analysis was conducted to determine the nature of the constructs or dimensions quantifying the image of vocational education and students’ loyalty towards VET. Correlation analysis was used to examine the relationships between the independent variables that comprised the image of VET and the dependant variables of students’ loyalty and, finally, regression analysis was used to measure the impact of the image of VET on the students’ loyalty. Three main findings emerged from the study: (1) the image of VET was constructed by seven dimensions (entry requirement, facility and equipment, recognition of qualification, student career and job potential, quality of curriculum, social skills and soft skills); (2) students’ loyalty was constructed by two dimensions (future study choice and earning potential); and (3) students’ loyalty towards VET, namely the rationale underlying their decisions about whether to continue their future studies in higher education or VET, and their perceptions of the earning potential offered by obtaining a qualification in VET, were impacted significantly by their perceptions of the relevance or quality of the VET curriculum to the emerging industrialised and market-led economy of Vietnam, and the level of entry requirements for VET courses, with exception of lower secondary students.
Key words: Influence, vocational education training, image, loyalty, and students.
INTRODUCTION
Over the last two decades, Vietnam was in a period of transition from a pre-industrial and agriculturally dominated economy towards an industrialised market-orientated economy with the expectation of becoming an industrialised nation by 2020. The Vietnamese government and World Bank both recognize that the quality and quantity of human resources, especially an appropriately skilled labour force, is one of the key factors leading to successful economic transition to a market economy. [TH1] Concurrent with economic restructuring, Vietnam saw significant changes to the structure of its social institutions. The education sector was not without exception and was forced to accept change in order to meet the economic necessities and the changing skills required of Vietnam’s workforce (London, 2011).
To make the economic transition successfully, the Vietnamese government designated vocational education instrumental to achieving this goal (GDVT, 2011).For this reason, in 2006, the Vietnamese National Assembly responded to the World Bank’s recommendations by passing the Law on Vocational Training, formally acknowledging the significance of its training system as a sustainable way to produce the skilled labour force. Included in the law, was the requirement that a pathway be established for those students looking to enter higher education following graduation from VET. Implementation of the new law, led to rapid growth of VET providers such that institutions are now located in all 64 cities and provinces of Vietnam. Presently, the VET network has 1293 registered vocational training institutions including 136 vocational colleges, 308 vocational secondary schools and 849 vocational training centres (GDVT, 2011).
The matter of increasing students’ enrolments in VET presented another issue. In the past, capable students were steered toward more intellectual routes and others, the less academic, were directed towards a life of labour. Under the influence of Confucian ideology, academic vocations are more respected than others in Vietnam, and so the preference amongst parents is for their children to attend higher education and gain a higher degree (London, 2011).For many years, vocational education was perceived as second-rate and an opt-out for particular sections of society, for example, juvenile delinquents, blue collar workers, and so on – a last option for gaining a degree.
In an attempt to combat these deep-seated cultural attitudes and behaviour of its population, the Vietnamese government fuelled its efforts to increase the attractive-ness of VET to potential students. In the short-term, improvements to the image of VET paid off, as evident in the increase in students graduating, during the period 2006 to 2011. The long training route (12 to 36 months) produced over 1,300,000 skilled workers with a further 7,000,000 skilled workers trained on the short training route (3 to 12 months). According to the (GDVT, 2011), over 80% of students were successful in gaining employment immediately after graduating from VET. Employment rates in the welding, automotive, and electrical divisions were even higher, at approximately 90% (GDVT, 2011). In addition, the VET sector was made more attractive by its high salaries. In the technical field, divisions such as electricity, welding, computing, and mechanics, graduate salaries were 10% higher than those of academic graduates. Increasingly, vocational education was seen as a more worthwhile way of acquiring the skills needed to gain employment in an industrialised economy. The proportion of students holding bachelor degrees, and even master’s degrees that were unable to secure employment and have therefore enrolled in vocational schools, is up by 30% (Huy, 2014), These figures illustrate a positive change in the attitudes of young people towards the VET system. There was a growing realisation that the traditionally respected academic pathway was not the best way of achieving steady employment in modern day Vietnam.
Despite these gains, academic forms of education appeared to be more respected by students and parents than technical and vocational forms of education. To illustrate, during the academic year 2007-2008, 80% of year 9 students graduating from lower secondary school chose to remain in mainstream education. Of the remaining 20%, 17.5% of students went into the labour market and only 2.5% enrolled in VET (GDVT, 2011). The GDVT (2011) recognized that the first option for most upper secondary graduates was to sit the university entrance examination. In addition, the number of universities in both the public and private sector increased quickly in recent years indicating a continued demand for student places in higher education. According to statistics from Ministry of education and training (MOET,2013), there was a substantial increase in higher education institutions during the period 1988 to 2014, quadrupling from 100 to 472 universities and colleges. Notably, the GDVT (2011) report revealed that certain aspects of the VET system, for example, curriculum, the quality of teachers and provider facilities did not meet the needs of key stakeholders such as industries, students and parents. It is apparent that negative attitudes towards VET described are deeply ingrained in the mind of the Vietnamese people.
The aim was to change society’s perception of the sector and reform the image of VET as pivotal to shifting perceptions of and affecting a change in attitudes toward VET, if the Vietnamese government was to be successful in encouraging students to consider a career in vocational education.
Statement of the problems
This study is conducted in the context of the Vietnamese Government’s substantial efforts to promote training in the vocational education sector to society as a large, but more specifically to the younger generation. This is evidenced in the funding records for the sector which demonstrate an increase annually, and tenfold, from 49 million USD to 490 million USD, in the period from 2001 to 2011. The expectations of Government are that funding will impact and attract greater numbers of skilled workers, increasing from 23.5 million in 2015 to 33.4 million by 2020.
However, secondary student enrolment in long-term VET programs, during the period of increased funding, actually decreased. In 2010-2011, 80.36% of lower secondary students continued into mainstream education and enrolled in high school programs compared to only 1.88% of the graduating students who instead opted for enrolment in vocational education and technical education schools (GDVT, 2011). Statistics for the academic year 2011–2012 were equally damning with 61.26% of students graduating from upper secondary continuing to higher education and only 10% enrolling in technical and vocational education (MOET, 2013). The figures for students currently enrolled in vocational programs reveal further disengagement with the sector. In the academic year 2008-2011, there was a considerably high student dropout rate of 15% (equivalent to 21,782 students) recorded at vocational secondary schools and vocational colleges (GDVT, 2011).
These statistics lead us to question whether the current image of VET is strong enough to attract increasing student enrolments and sustain robust retention rates. So far there has been very limited research on the topic. The present study is therefore an exploratory study with the objective to empirically examine the model of the image of VET. In addition, the impact of each dimension of the model on vocational, upper secondary and lower secondary students’ loyalty towards VET programs will be examined. The meaning of students’ loyalty, in this study, was slightly different depending on the stakeholder group. For those currently studying with vocational education training providers, loyalty was defined as the intention to continue with their studies. For students in secondary schools, loyalty was defined as demonstrating positive thinking and intention to enter the VET sector.
This study aims to answer the following research questions:
(1)To what extent does the projected image of VET relate to students’ loyalty to the program?
(2)To what extent does the image of VET impact students’ intention to pursue vocational education?
[TH1]Is this sentence needed?
LITERATURE REVIEW
The concept of image
Image represents people’s perceptions of their own reality (Gotsi and Wilson, 2001). Ditcher (1985) defined image as ‘…the total impression an entity makes on the minds of others’. Therefore, image represents a simplification of the combination of a larger number of associations and slices of information connected to an object, person, organization or place. According to Dobni and Zinkhan’s (1990) image was a perceptual phenome-non that is formed by he sum of beliefs, attitudes and impressions that a person or group has of an object. For Kotler and Fox (1995) image was an overall impression that a person had about an object. It may be based on incomplete information and may be perceived differently by the various stakeholders of an institution. Since organizations have several different stakeholders, a company does not convey a single message; instead it projects multiple images (Dowling, 1988). By assessing image, an institution may reveal what strengths to emphasize to stakeholders and what precisely to communicate. Jenkins (1991) emphasized the need for organizations to have a visual identity, a way to project self-image.
By this definition, the image of vocational education and training can be defined as the sum of the beliefs an individual has towards the sector (Landrum et al., 1998; Arpan et al., 2003). Elements like name, logo, tagline, colour palette, facilities, the teacher’s ability, course offering, academic reputation, and employment opportu-nities are some of the elements that contribute to the representation of VET’s image (Alessandri, 2001).
Conceptualising an image of VET
One approach to constructing a measureable image of VET is to attempt to quantify the constructs or dimensions of ways of thinking individuals use to evaluate and make judgements about the sector. Challenges lie in identifying all the constructs of an image, given that different people rely on different combinations of elements to form their perception. Even if one could identify all constructs and elements defining an institutions image, it would be very difficult to accurately model all the connecting relationships and interactions, as image is a dynamic and complex concept. The same institution has the power to generate distinctive images in specific groups of audience members’ (Sung & Yang, 2008). Image is the result of certain choices, actions and social interactions of the involved stakeholders (Barich and Kotler, 1991).
According to Kennedy (1977) image had a functional component and an emotional component. The functional component comprising tangible stimuli that could be easily measured, like physical properties while the emotional component was related to psychological conditions that become perceptible in feelings and attitudes. A confluence of research evidence (Dobni and Zinkhan, 1990; Keaveney and Hunt, 1992; Stern and Krakover, 1993) pointed towards the importance of using both components to make an accurate assessment of image. However, Bagozzi and Burnkrants (1985) argued that each component should be treated separately in order to obtain more accurate predictions of behaviour. Nevertheless, it is crucial to remember that the inter-relatedness of each phenomenon contributes to shaping an image (Baloglu and Brinberg, 1997). Consensus on the importance of both components has not yet been achieved, so it remains important to study the effect of each component separately and together to foster research and discussion.
Influence of image on loyalty
Research by Nguyen and Leblanc (2001), Bloemer and de Ruyter (1998), and Helgesen and Nesset (2007) revealed university students’ retention and loyalty is strongly affected by institutional image and reputation. According to Eskildsen et al. (1999), this variable was the main influence on students’ continued loyalty and commitment to completing programs and maintaining a positive attitude towards an institution. In comparison, in the field of marketing a loyal customer is defined as one who would continue to purchase goods or service from the same company whenever possible, and who continues to maintain positive perceptions towards goods and services from the company (Caruana, 2002). According to Oliver (1999), if situational influences and marketing efforts were ignored, customer loyalty was defined as a self-promise to repurchase or re-choose a preferred product or service, this action, which will continue in the future, causing repetitive same brand or same brand series purchasing.
If we apply the concept of customer’s loyalty to higher education, according to Webb and Jagun (1997), it represented a student’s willingness to recommend an institution to others, making positive recommendations and demonstrating a readiness to return later to continue his or her studies. After graduating, a loyal student may continue to support his or her academic institution on a financial basis, through encouraging reports to current or former students, or even through some form of cooperation (Henning-Thurau et al., 2001).
From another perspective, research by Nguyen and LeBlanc (2001) conducted in the context of business education indicated that loyalty is measured by a student’s intention to: (1) consider business as his/her first choice of higher study; (2) continue his or her program at a business school; and (3) encourage friends to study at the same business school as well as the intention to recommend it as the best in its area. In the same way, for Athiyaman (1997) loyalty is the combination of student willingness to talk positively about the institution and to provide information to new candidates.
The relationship between image and students’ loyalty
According to Gronroos (1984), a relationship existed between the image of a university and its students’ loyalty. He concluded that university image and service quality are drivers (antecedents) for students’ loyalty. Similarly, students’ satisfaction with service quality and university image was a mediating variable that can be considered to form part of students’ loyalty. Consequently, students' satisfaction with the service provided by a university is assumed to have a positive association with the image of the university (Helgesen and Nesset, 2011).
As university image was shown to impact students’ perceptions, thus a favourable and well-known image was considered an asset for the education provider (Gronroos, 2001). Similarly, Rossetti’s (1990) research found a positive relationship between the image of vocational education and number of students enrolled in VET. Conversely, negative image leads to a decrease in the number of students enrolling in VET. Awang et al. (2011) investigated upper secondary and vocational student perceptions, thoughts and feelings about VET in Malaysia, revealing that recognition of a VET qualification, work ethic and social values of graduates and applicability of course content to contemporary society, were major predictors of students’ loyalty toward the VET sector.
According to Wu (2011) corporate image has been assessed as an important antecedent of loyalty. Martineau (1958) stated that if consumers favour the image of the store or organization, they would probably develop a certain degree of loyalty. Furthermore, Aaker (1997) suggested that an organization with a strong image emphasising high equity would have a greater number of loyal customers, leading to high and continued interaction and communication between customers and brands or organizations. Selnes (1993) also confirmed the influence of corporate brand image on brand loyalty. In contrary, Davies and Chun (2002) found that corporate brand had an indirect influence on brand loyalty via customer satisfaction when personality traits are used to portray corporate brand in an off-line setting.
METHODOLOGY
Sample and procedure
This research uses a survey approach to collect data from lower secondary school, upper secondary school and vocational education students from across both the Northern and Southern regions of Vietnam. Six provinces were purposively selected based on the researchers’ experiences of Vietnam. In the northern region the provinces were: Nam Dinh, NinhBinh, and Hai Duong. In the southern region the provinces were: BinhPhuoc, Dong Nai and Vung Tau. The distance between data collection points from each province was approximately 100 km.
In each province, six schools (two lower secondary, two upper secondary schools and two current vocational education training providers) were then randomly selected and approached to participate in the study. In each school, 25 students were chosen to participate in the survey using a systematic selection technique applied to the class roll. Beginning at student number one, then number four, number seven and so on counting three students each time until the 25th student was reached. In total, six schools were surveyed in each province, gathering a total of 150 completed surveys per province. A total of 450 participants were recruited from both the Northern and Southern regions providing 900 data points.
Instrumentation
The model of the image of VET and student’s loyalty towards VET trialled in this study was based on data from a variety of sources. The principle source for the image dimensions being the survey instrument deployed by Awang et al. (2011) [TH1] to investigate students’ loyalty towards VET in Malaysia. This was combined with the 12 principle dimensions used to describe the VET system in Vietnam (GDVT, 2011). The 12dimensions were used to provide cultural points of reference that could be blended into the modified scale. In the final model, seven dimensions explained the image of VET. These are: entry requirements, facility and equipment, teacher’s ability, recognition of qualification, student career and job potential, quality of curriculum, and social value and soft skills. The measure of student loyalty was again based on that devised by Awang et al. (2011) [TH2] and the GDVT (2011), and was modified for use taking into account the Vietnamese context and culture. Four subjective measures of students’ loyalty towards the VET sector were considered by asking students’ intentions on: further study, field of interest, career choice and parental encouragement.
The scale measuring the impact of the image of VET on students’ loyalty consisted of three sections and was in the form of a survey questionnaire. The first section was designed to collect demo-graphic information using 13 items. The second section examined students’ perception of the hypothesised image of VET and included 45 items. The third section contained 19 items describing students’ beliefs about VET education and was used to determine their loyalty towards VET. The survey questionnaire utilised a five-point Likert scale measuring the image of VET and student’s loyalty towards VET based on responses to five categories (1 = strongly disagree; 2 = disagree; 3 = neutral; 4 = agree; 5 = strongly agree). Students were asked to provide the most appropriate answer to a set of 64 statements. The seven dimensions making up the image of VET (independent variable) were measured using 45 questions that asked students’ evaluation based on their experience and knowledge of the sector. The four dimensions measuring students’ loyalty (dependent variable) were measured using 19 questions asking their intentions towards the VET sector. To overcome the students’ fatigue when responding to the random questions, the authors designed different types of the questionnaire altering the order of the items; for example the VET image including 45 items was quantified by 7 constructs separately, and each constructed comprised small numbers of items.
ANALYSIS AND FINDINGS
A total of 900 survey questionnaires were distributed and all were returned completed. It should be noted that at the end of each survey, the researcher checked the students’ responses. Students who had not fully completed the survey were given more time to finish. If someone selected from the list did not want to take the survey, then the researcher invited the next student on the list based on the systematic selection process mentioned above. This ensures that the target final sample size of 900 completed surveys was reached.
The data were coded and analysed using Statistical Package for the Social Sciences (SPSS) software version 19, taking into account the set of variables related to the new context, which was Vietnam. The analyses com-prised three stages: first, exploratory factor analyses (EFA) were conducted to identify the number of distinct factors involved in describing the image of VET and the number of factors involved in describing students’ loyalty towards the VET sector, second, correlation analyses were conducted to examine the relationship between the two sets of factors and finally, regression analyses, based on the findings from the correlation studies, were conducted to predict relationships between the indepen-dent variables and dependent variables.
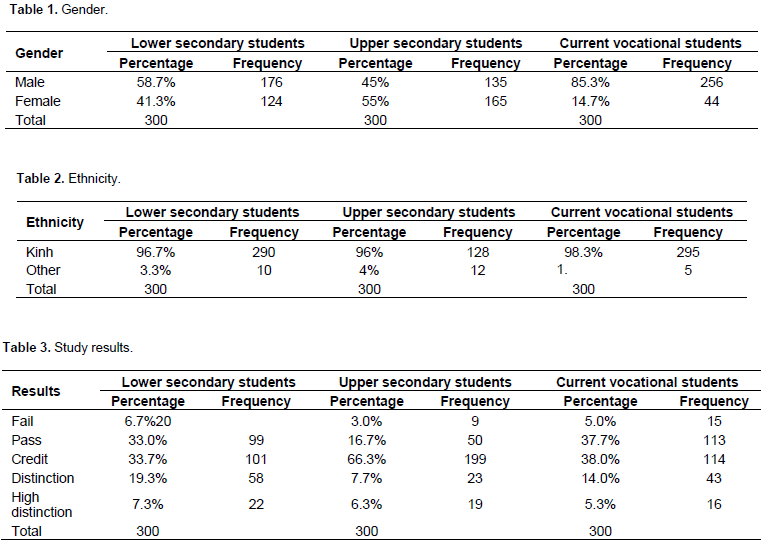
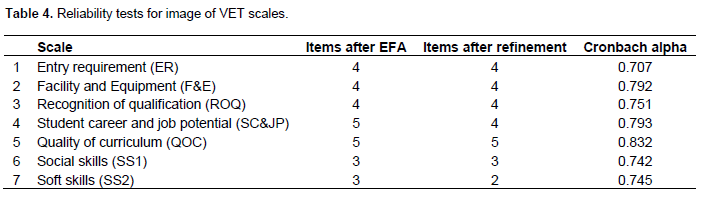
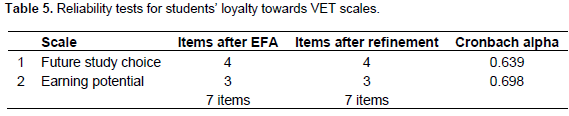
Before the EFA technique is explained, the details of demographic information of three student groups were presented. Tables 1, 2, and 3 sum up the percentages and frequency on the issues namely gender proportion, ethnicity, and study results.
Exploratory factor analysis
The VET image
A sample size of 900 participant responses was gathered from 45 items measuring the image of VET was sufficient for an exploratory factor analysis. An examination of the Kaiser-Meyer Olkin measure of sampling adequacy being 0.876 confirmed that the sample was factorable. The exploratory factor analysis was conducted using principal components analysis for extraction and rotation. Seven factors emerged with eigenvalues greater than 1, which cumulatively accounted for 60.8% of the variance. The factor loadings and factor names are represented in appendix 1.
Refining the scale
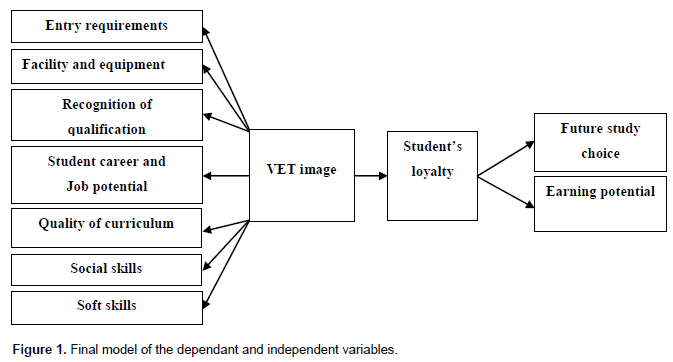
In order to refine the items that emerged from the exploratory factor analysis, the reliability of each new factor was determined using a combination of Cronbach alpha and the Scale if item deleted feature of SPSS. Items extracted with a factor loading of greater than 0.5 were retained in the factor structure. A factor loading or cut-off point of 0.5 was used as the threshold to ensure practical significance for further analysis (Worthington & Whittaker, 2006). Consequently, 17 items with low loadings were removed from the initial analysis and a further two during refinement. Twenty six items remained after refinement and formed the seven factors. The reliability of each new factor was indicated by a Cronbach alpha measure of greater than 0.6. Items with a total correlation measuring less than 0.3 were removed from any subsequent analysis. Table 4 summarises the results of the reliability tests conducted on the remaining items after scale refinement.
The exploratory factor analysis identified seven independent variables that measure the image of VET comprising the following elements:
Entry requirements (ER):[TH1] this dimension reflected students’ perceptions about the level or standard of entry requirements for vocational educational and training courses and the type and quality of students’ currently enrolled.
Facility and equipment (F&E): this dimension depicted students’ perceptions about the currency and affordances of leisure and educational resources accessed at VET institutions.
Recognition of qualification (ROQ): this dimension reflected students’ perception of the status of a degree gained in VET amongst employers and higher education providers, both in country and overseas.
Student career and job potential (SC&JP): this dimension reflected students’ perception of the employment potential following graduation from a VET school.
Quality of curriculum (QOC): this dimension reflected perceptions of the curriculum content and its applicability to contemporary society’s needs.
Social skills (SS1): this dimension reflected perceptions about the degree of social skills that VET graduates hold that are valued not only in skilled workers but also in society.
Soft skills (SS2): this dimension reflected perceptions about how effective VET is at equipping graduates with the soft skills that facilitate effective interpersonal relationships in the workplace.
Students’ loyalty toward VET
The analytical procedures for the first factor analysis were repeated when determining the dimensions of students’ loyalty towards VET. Again, a sample size of 900 participant responses was gathered from 19 items measuring students’ loyalty towards VET. For this scale, the Kaiser-Meyer Olkin measure of sampling adequacy was 0.714, confirming that the sample was factorable. Two factors emerged with Eigenvalues greater than 1, which cumulatively accounted for 55.7% of the variance (Table 5 and appendix 2). The exploratory factor analysis identified two dependent variables that measure students’ loyalty towards VET comprising the following elements:
[TH1]This might be the place to put in the abbreviation used later in the tables, as requested by the reviewer
Future study choice: This dimension reflected participants’ perceptions about the influences on students’ choice of future study pathway, be it mainstream education or VET.
Earning potential: This dimension depicted students’ beliefs about the VET ability to provide legitimate em-ployment and sufficient income to sustain a reasonable standard of living.
Establishing the reliability of scales
The measures for the dimensions of the image of VET and students’ loyalty towards VET were then scrutinised for reliability and validity. The exploratory factor analysis used data collected in the Vietnamese context and it was expected that cultural differences would emerge and influence the arrangement of items in the scales and the scales themselves. The hypothesised dimension teacher’s ability did not emerge from the analysis of the independent variable data measuring the image of VET. However, the hypothesised dimension of social values and soft skills was extracted and grouped into two separate dimensions named social skills and soft skills. The Cronbach alpha values for each of the subscales making up the image of VET scale were all above the threshold of 0.7 (Nunnally, 1978) indicating reliability of the scales.
Disappointingly, only two dimensions of students’ loyalty were condensed (Table 5). The arrangement of items differed from any of the hypothesised dimensions and the new scales were named future study choice and earning potential. The Cronbach alpha values for both scales measured just below the threshold of 0.7 but were retained in the later correlation and regression analysis on the basis of the sample number (900 data points). Having established the reliability of scales and modelled the relationship between the dependent variables and independent variables (Figure 1) the answers to the research questions of the study could be exposed.
Correlation analysis
In order to address the first research question, correlation analysis was determined to be, in the first stage, the most appropriate method of data analysis to test for linear relationships and the degree of association between variables. Four analyses were undertaken, one over the whole sample and the other three over lower, upper secondary and vocational students, respectively. In each analysis, two measures of relationship were conducted. The first was a measure of the relationship between all seven dimensions of the image of VET and students’ loyalty, specifically the dimension future study choice. The second was a measure of all seven independent variables representing the image of VET and the dependant variable students’ loyalty, specifically the dimension earning potential.
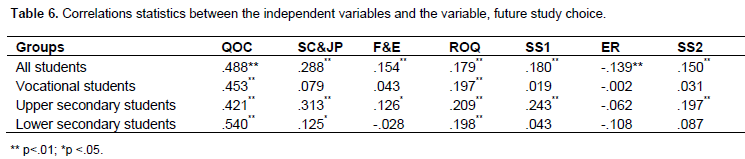
The first correlation analysis
It was observed that quality of curriculum (QOC) shows a statistically significant moderate (Strath[TH1] University, 2014; Table. 3) and strong positive, correlation with future study choice in all groups (Table 6). The lower secondary student grouping, quality of curriculum shows a statistically significant and strong positive correlation (r = .540, P < .01), with future study choice. The other three groups (r = .488 all students; .453 vocational students; and .421 upper secondary students, P< .01) had moderate correlations
[TH1]Strathclyde?
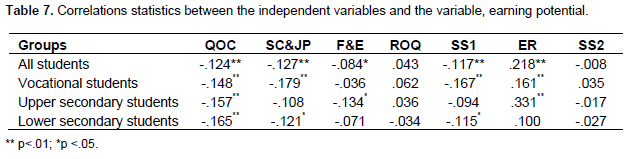
The second correlation analysis
Table 7 displays the correlations between each of the seven independent variables defining the image of VET and the dependant variable, earning potential. Only the quality of curriculum dimension (QOC) demonstrated a statistical significant and negative modest correlation with earning potential (r = -.124; -.148; -.157; and -.165, P < 0.01) for all four groupings. However, two dimensions namely recognition of qualification and social skills showed a negligible correlation with earning potential and were removed from the analysis.
Regression analysis
In regression analysis, independent variables are considered for their ability to predict dependant variables. In this study, students’ loyalty was hypothesised as the dependent variable being influenced by the independent variable, the image of VET. In other words, these analyses examine the impact of students’ perceptions of the image of VET on students’ loyalty toward the VET sector.
As with the correlation analysis, four linear regression analyses were performed. One for each of the groupings described above. For each analysis, two measures of impact between the independent variables and depen-dent variables were conducted. The first was a measure of impact between all of the qualifying independent variables representing the image of VET and the variable of students’ loyalty, future study choice. The second was a measure of all qualifying independent variables and the dependant variable of students’ loyalty, earning potential.
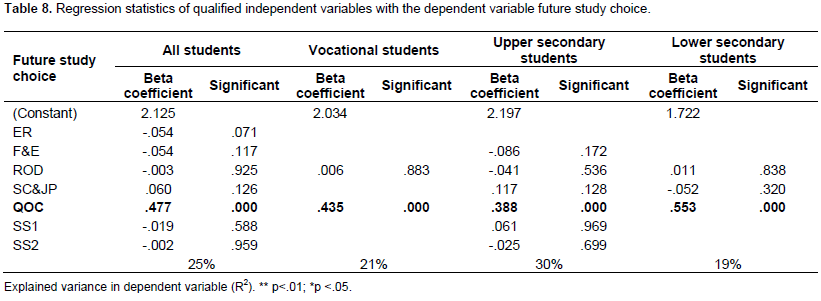
Linear regression between the image of VET and future study choice
Table 8 describes the results of the analysis estimation of the linear regression between all qualified independent variables and dependent variable, future study choice. The findings indicate that only quality of curriculum impacted significantly on future study choice(B = .477 p < .001 for all students; .435 p < .001 for vocational students; .388 p < .001 for upper secondary students; and .553, p < .001 for lower secondary students). The R2 of each model was 0.25; 0.21; 0.30 and 0.19 respectively, suggesting that 25; 21; 30 and 19% of the variance in further study choice can be explained by quality of curriculum. Multicollinearity was absent in the data for all four cases, confirmed by the collinearity statistics for variance inflation factor that were under the cut-off point of 10 (Belsley et al., 1980).
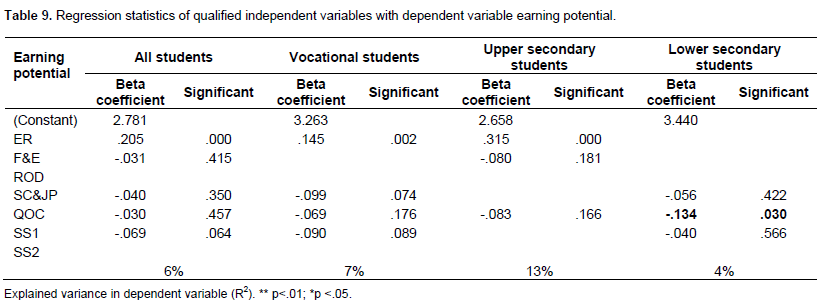
Linear regression between the image of VET and earning potential
Table 9 describes the linear regression coefficients of the independent variables with the dependent variable, earning potential. The findings indicate that entry requirement impacted significantly on earning potential (B = 0.205, all students p < 0.01; B = 0.145, vocational students p < 0.01; B = 0.315, upper secondary students p < 0.01). For the grouping lower secondary students, quality of curriculum impacted significantly on earning potential (B = -.134, p < .05). The R2 of the model was 0.06; 0.07; 0.13; and 0.04 separately, suggesting that about 6, 7, and 13% of the variance in earning potential can be explained by entry requirement and about 4% by quality of curriculum. As with the previous analysis, the collinearity statistics for variance inflation factor was below 10 confirming the absence of multicollinearity in the data
CONCLUSION
Exploratory factor analysis
The findings from the EFAs have identified seven distinct latent variables that influence students’ loyalty towards the VET sector, comprising the following elements: entry requirement; facility and equipment; recognition of qualification; student career and job potential; quality of curriculum; social skills; and soft skills. The above findings are compared with the preceding study by Awang et al (2011) that investigated the dimensions of the image of VET that influence students’ loyalty towards VET in Malaysia.The comparison with the Vietnamese context revealed two interesting conclusions. First of all, five out of seven variables depicting the image of VET appear to have remained relatively stable across the studies, independent of cultural context. Second, two new variables were isolated; formed by the separation of the hypothesised social values and soft skills variable.
Interestingly, it appears that when thinking about VET, for Vietnamese students, the hypothesised dimension teacher ability was not identified as emergent in the EFA. This appears contradictory to Confucian ideology and its ideal of respecting the role of the teacher. In the educational environment, such as schools, teachers are always central to the learning and teaching process and other activities. It suggests weakened influence of the doctrine amongst the younger generation. The absence of the dimension teacher ability indicates that students did not hold VET teachers’ knowledge and skills in high regard. These findings supported those presented by GDVT (2011) that reveal the limitation of vocational teachers. Vocational teachers were found to have limited occupational skills and competences and, low foreign language and information technology capabilities that were a barrier to updating knowledge and technological advancements required to teach vocational education.
Of further interest in the analysis of the image of VET is the division of the hypothesised dimension, social value and soft skills into two independent variables, social skills and soft skills. These findings demonstrate that the acquisition of soft skills such as communication and leadership skills, as well as social skills that include creativity, innovation and those of being a valuable citizen are important and as necessary as subject based know-ledge acquired through academic study in mainstream education. This finding mirrors the following statement by the Vietnamese President Truong (2014) that ‘For a long time, in the past, we only focused on the academic subjects such as Math, Physics, Chemistry, Biology, Literature and English for examination to get a place at university. We did not pay much attention to teaching and the training of children to build up their social values and soft skills while at school’.
Correlation analysis
The findings from the correlation analyses indicate that all the independent variables defining the image of VET had statistically significant correlations (weak, with the exception of quality of curriculum, all positive with the exception of entry requirement) with the two dependent variables (further study choice and earning potential) representing students’ loyalty towards VET. These results suggest that in order to encourage and attract students to enter the VET sector, its policy makers, managers and especially principals of VET institutions must consider carefully the seven dimensions that contribute to the projected image of VET and take these into account when formulating marketing strategies that will promote the sector to all areas of society, especially young people and their parents.
Regression analysis
This paper concludes that student perceptions about the image of vocational education and training, specifically its efficacy and the quality of the curriculum and entry requirements play a decisive role in predicting students’ loyalty towards the sector or their willingness to pursue either further study in vocational education or their inclination towards completing a course of study they are currently enrolled on.
Consistent across all groupings of students were perceptions of the quality of curriculum as a predictor of students’ choices about further study. Low expectations of the curriculum, in particular its perceived focus on skill development rather than the furthering of knowledge mean that students believe their future study choices are more influenced by parents. When the curriculum is perceived as vibrant and able to fulfil the expectations of a market-oriented economy, students believe they have parental support to make the choices they wish for further study
It appears that lower secondary students look towards the future and assessing the suitability of the content of the vocational curriculum to equipping them with the knowledge and skills needed to ensure the longevity of their employment prospects and ultimately their earning potential. This differed from the overall perceptions of the whole sample, and specifically the older students in upper secondary and vocational education, who saw their future economic prospects, associated with undertaking vocational training, to be a feature of the initial quality of entrants into vocational education courses and their social status. It suggests that the criteria students use to assess the viability of VET as a career pathway maybe related to their maturity and reflect differences in the decision-making processes students use. It may also reflect students changing position in relation to how they see their influence on the world with an improved understanding of how identity affects an individual’s interaction with society.
Out of all four groupings, it is surprising that only lower secondary student loyalty towards VET was not impacted by their perceptions of the entry requirements for VET, but was impacted by quality of curriculum. It may be concluded that the driver of students’ loyalty, represented by earning potential is a significant influence for all students, and at the level of vocational students and upper secondary students. However, this was not the case for lower secondary students when analysing the group. Instead quality of curriculum was the main predictor of earning potential.
Students’ beliefs about the earning potential related to training in VET impacted their perceptions of the entry requirements to enroll on a course of study in VET, with the exclusion of lower secondary students. The findings concur with those of Awang et al (2011) [TH1] who found that few of the identified dimensions impacted students’ loyalty. They determined three dimensions: recognition of qualification, work ethics and social values, and appli-cability of course content were major predictors of students’ loyalty toward the technical education and vocational training field in Malaysia. This comparison reveals that factors impacting student loyalty in Vietnam tend to be similar to those in Malaysian contexts, with quality of curriculum playing key role. It may be concluded that the driver of students’ loyalty is no different between the two countries. In the Vietnamese context, entry requirement also presents as a driver of students’ loyalty.
Implications of the study
Aside from the main student stakeholders, the findings from this study have a wider significance to groups of associated stakeholders such as parents, industry, VET policy makers and young people who have an overview of the VET sector in Vietnam. The findings from this study will provide solid and reliable evidence of students’ perception and evaluation of the sector. They may also assist policy makers in planning future programs related to changing cultural attitudes towards VET, at the level of schools, communities and government. Furthermore, the findings will inform the decision making of student stake-holders with regard to future study in either vocational education and training or mainstream education. It has the potential to impact the employability and career choices of Vietnam’s younger generation.
Limitations of the study
The two main limitations of this study are external barriers and methodological limitations. The external barriers in this research refer to geographically limitations of the study in Vietnam and consequent difficulties extrapolating the results to other countries. In addition, internationally published research related to the Vietnamese VET sector in Vietnamese context is limited. Methodological limitations refer to other methodological approaches that could have been pursued but were not undertaken due to the specific nature of this investigation such as using in depth interview approach to explore students’ opinions deeply. Also, the sample size collected in this study is considered insufficient to represent the whole range of views of Vietnamese students as only small numbers (900 students) were sampled in comparison with over 1,000,000 students available.
[TH1]Needs to be in full
CONFLICT OF INTERESTS
The authors have not declared any conflict of interests.
REFERENCES
|
Aaker JL (1997). Dimensions of brand personality.Journal of Marketing Research, 34(3):347-357. Crossref |
||||
| Alessandri SW (2001). Modelling corporate identity: a concept explication and theoretical explanation. Corporate communications: Int. J. 6(4):173-182. | ||||
|
Arpan L, Raney A, Zivnuska S (2003). A cognitive approach to understanding university image. Corporate Communications: Int. J. 8(2):97-113. Crossref |
||||
|
Athiyaman A (1997). Linking student satisfaction and service quality perceptions: the case of university education. Euro. J. Mark. 31(7):528-540. Crossref |
||||
| Awang AH, Sail RM, Alavi K, Ismail IA (2011). Image and students' loyalty towards technical and vocational education and training. J. Technical Educ. Train. 3(1):13-28. | ||||
|
Bagozzi RP, Burnkrant RE (1985). Attitude organization and the attitude-behavior relation: A reply to Dillon and Kumar. J. Pers. Soc. Psychol. 49(1):47-57. Crossref |
||||
| Baloglu S, Brinberg D (1997).Affective image of tourism destination. J. Travel Res. 35(4):11-15. | ||||
| Barich H, Kotler P (1991). A Framework for Marketing Image Management. Sloan Manage. Rev. 32(Winter):94-105. | ||||
|
Belsley DA, Kuh E, Welsch RE (1980). Regression diagnostics: Identifying influential data and sources of Collinearity. New York, NY: John Wiley & Sons. Crossref |
||||
|
Bloemer J, de Ruyter K., Peeters P (1998). Investigating drivers of bank loyalty: the complex relationship between image, service quality and satisfaction. Inter. J.Bank Market.16(7):276-86. Crossref |
||||
|
Caruana A (2002). Service loyalty: the effects of service quality and the mediating role of customer satisfaction. Euro. J. Market. 36(7–8):811–829. Crossref |
||||
|
Davies G, Chun R (2002). Gaps between the internal and external perceptions of the corporate brand. Corporate Reputat. Rev. 5:144–158. Crossref |
||||
|
Dichter E (1985). What's in an image. J. Consumer Mark. 2(1):75 – 81. Crossref |
||||
| Dobni D, Zinkhan GM (1990). In search of brand image: a foundation analysis. Adv. Consumer Res.17(1):110-119. | ||||
|
Dowling G (1988). Measuring corporate images: a review of alternative approaches. J. Bus. Res. 17(1):27-34. Crossref |
||||
| Eskildsen J, Martensen A, Gronholdt L, Kristensen K (1999). Benchmarking student satisfaction in higher education based on the ECSI methodology, Proceedings of the TQM for Higher Education Institutions Conference: Higher Education Institutions and the Issue of Total Quality, 30-31 August, Verona, pp.385-402. | ||||
| General Directorate of Vocational Training (GDVT). (2011). VET report. Retrieved from http://khdn.tcdn.gov.vn/tintuc/tintuctrongnuoc/Pages/B%C3%A1o-c%C3%A1oD%E1%BA%A1y ngh%E1%BB%81-Vi%E1%BB%87t-Nam-n%C4%83m-2011.aspx. | ||||
|
Gotsi M, Wilson A (2001). Corporate Reputation: Seeking a Definition. Corporate Communications. Int. J. 6(1):24-30 Gronroos C (1984). A service quality model and its marketing implications. Euro. J.Mark.18(4),36-44. Crossref |
||||
|
Gronroos C (2001). The perceived service quality concept-a mistake? Manag. Service Q. 11:150-152. Crossref |
||||
|
Helgesen O, Nesset E (2011). Does LibQUAL+TM account for student loyalty to a university college library? Q. Assur. Edu. 19(4):413-440. Crossref |
||||
|
Henning-Thurau T, Lager MF, Hansen U (2001). Modelling and managing student loyalty: An approach based on the concept of relationship quality. J. Service Res.3 (1):331-344. Crossref |
||||
| Huy L (2014). ThạcsÄ©, cá»nhân ồ ạthá»ctrungcấp. Retrieved from http://truongtrungcapnghehatinh.edu.vn/thacsicu-nhan-o-hoc-trung-cap. | ||||
| Jenkins N (1991). The business of image: Visualising the corporate message. London, Kogan Page Limited. | ||||
|
Keaveney SM, Hunt KA (1992). Conceptualization and Operationalization of Retail Store Image: A Case of Rival Middle-level Theories. J. Acad. Mark. Sci. 20(2):165-175. Crossref |
||||
|
Kennedy SH (1977). Nurturing institutional image. Euro. J. Mark.11(3):120-164. Crossref |
||||
| Kotler P, Fox K (1995). Strategic Marketing for Educational Institutions, 2nd ed., Prentice-Hall, Englewood Cliffs, NJ. | ||||
|
Landrum R, Turrisi R, Harless C (1998), University image: the benefits of assessment and modelling. J. Market. High. Edu. 9(1). 53-68. Crossref |
||||
| London JD (2011) Education in Vietnam: Historical Roots, Recent Trends. In J.D. London (Ed), Education in Vietnam.Singapore: Institute of Southeast Asian Studies Press. | ||||
| Martineau P (1958). The personality of retail store. Harvard Bus. Rev. 36(1):47-55. | ||||
| Ministry of Education and Training (MOET). 2013. Thốngkếgiáodụcnăm 2013. Retrieved from http://www.moet.gov.vn/?page=11.11&view=5251. | ||||
|
Nguyen N, LeBlanc G (2001). Image and reputation of higher education institutions in students' retention Decisions. The International Journal of Educational Management, 15 (7), 303-11. Crossref |
||||
| Nunnally JC (1978). Psychometric theory (2nded.). New York: McGraw-Hill. | ||||
|
Oliver RL (1999). Whence consumer loyalty? J. Market.63, 33-44. Crossref |
||||
| Rossetti R (1990). An examination of factors influencing students not to enrol in secondary vocational education. Columbus, OH: Ohio State University, Department of Agricultural Education. | ||||
|
Selnes F (1993). An examination of the effect of product performance on brand reputation, satisfaction and loyalty. Euro. J. Mark. 27(9):19-35. Crossref |
||||
|
Stern E, Krakover S (1993). 'The formation of a composite urban image', Geogr. Anal. 25(2):130–146. Crossref |
||||
| Strath University. (2014). Correlations: Direction and Strength. Retrieved from http://www.strath.ac.uk/aer/materials/4dataanalysisineducationalresearch/unit4/correlationsdirectionandstrength/ | ||||
|
Sung M, Yang S (2008). Toward the model of university image: The influence of brand personality, external prestige, and reputation. J. Pub. Relat. Res. 20(4):357-376. Crossref |
||||
| Truong TS (2014). Khong day lam nguoi de sinh ra lam chuyen. Retrieved from http://dantri.com.vn/chinhtri/chu-tich-nuoc-khong-day-lam-nguoi-de-sinh-ra-chuyen-1003362.htm | ||||
| Webb D, Jagun A (1997). Customer care, customer satisfaction, value, loyalty and complaining behavior: validation in a UK university setting. J. Consumer Satisfaction, Dissatisfaction Complaining Behav. 10:139-151. | ||||
|
Worthington RL, Whittaker TA (2006). Scale development research: A content analysis and recommendations for best practices. Counsel. Psychol. 34(6):806- 838. Crossref |
||||
| Wu CC (2011). The impact of hospital brand image on service quality, patient satisfaction and loyalty. Afr. J. Bus. Manage.5(12):4873-4882. | ||||
Copyright © 2024 Author(s) retain the copyright of this article.
This article is published under the terms of the Creative Commons Attribution License 4.0


